
Environmental Science 15th Edition by Scott Spoolman,Tyler Miller
Edition 15ISBN: 978-1305090446Environmental Science 15th Edition by Scott Spoolman,Tyler Miller
Edition 15ISBN: 978-1305090446 Exercise 15
The graph below shows changes in the size of an Emperor penguin population in terms of numbers of breeding pairs on the island of Terre Adelie in the Antarctic. Scientists used this data along with data on the penguins' shrinking ice habitat to project a general decline in the island's Emperor penguin population, to the point where they will be endangered in 2100. Use the graph to answer the questions on the right.
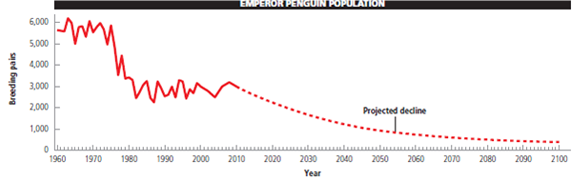
What was the overall percentage decline in the penguin population from 1975 tO2010?
What was the overall percentage decline in the penguin population from 1975 tO2010?
Explanation Verified
The Data Analysis shows the highest popu...
Environmental Science 15th Edition by Scott Spoolman,Tyler Miller
Why don’t you like this exercise?
Other Minimum 8 character and maximum 255 character
Character 255


