
A Visual Approach to SPSS for Windows 2nd Edition by Leonard Stern
Edition 2ISBN: 978-0205706051A Visual Approach to SPSS for Windows 2nd Edition by Leonard Stern
Edition 2ISBN: 978-0205706051 Exercise 1
For this problem, use the CourseEval.sav file provided on the publisher's website for this text, http://www.pearsonhighered.com/stern2e. The data in the file was gathered from students in various majors who were taking an introductory statistics course. Students were asked to identify their major and the grade they expected in the class. They were then given a 15-item multiple-choice test on statistical concepts.
The table shown below lists the name of each variable, an explanation of the concept assessed by each variable, and identification of the values for category variables.
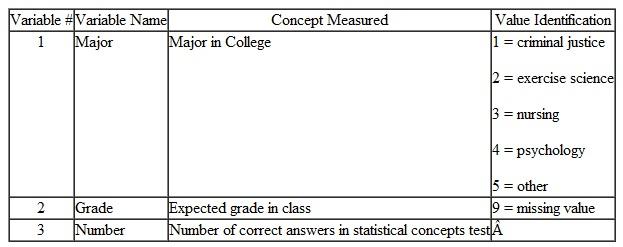 1. From the information shown in the table, provide suitable labels in the SPSS Statistics Data Editor for each variable. For the variable Major , create value labels. For the variable Grade , specify that the value 9 indicates a missing value.
2.Select cases that have the values 1-4 as values of the variable Major.
3. Do a 1-way ANOVA on the variable Grade as a function of Majors 1-4. Request a test of homogeneity of variance, descriptive statistics, and a means plot.
4. Describe the results of the analysis specified in question 3.
5. A person inspecting the results of the ANOVA described in question 3 decides to test which individual majors, criminal justice students differ from in terms of their mean expected grade. Perform a suitable analysis to address this question and describe the outcome of the test.
6. Perform the tasks specified in questions 3 using Number as the dependent variable. How do the results differ
The table shown below lists the name of each variable, an explanation of the concept assessed by each variable, and identification of the values for category variables.
1. From the information shown in the table, provide suitable labels in the SPSS Statistics Data Editor for each variable. For the variable Major , create value labels. For the variable Grade , specify that the value 9 indicates a missing value.2.Select cases that have the values 1-4 as values of the variable Major.
3. Do a 1-way ANOVA on the variable Grade as a function of Majors 1-4. Request a test of homogeneity of variance, descriptive statistics, and a means plot.
4. Describe the results of the analysis specified in question 3.
5. A person inspecting the results of the ANOVA described in question 3 decides to test which individual majors, criminal justice students differ from in terms of their mean expected grade. Perform a suitable analysis to address this question and describe the outcome of the test.
6. Perform the tasks specified in questions 3 using Number as the dependent variable. How do the results differ
Explanation Verified
1)
Using SPSS statistics data editor the...
A Visual Approach to SPSS for Windows 2nd Edition by Leonard Stern
Why don’t you like this exercise?
Other Minimum 8 character and maximum 255 character
Character 255


