
Economic Analysis of Social Issues 1st Edition by Alan Grant
Edition 1ISBN: 978-0134098371Economic Analysis of Social Issues 1st Edition by Alan Grant
Edition 1ISBN: 978-0134098371 Exercise 5
Refer to the table in problem 3. Suppose that, because of rising steel costs, sellers offer 10,000 fewer cars at each price. Create a new table that reflects that change in the supply relationship. Then, following methods similar to those you used in problem 1, use supply and demand analysis to construct a graph that shows the effect of rising steel prices on the equilibrium price and quantity of cars sold.
Problem 1:
Using the information from problem 2, graph the original supply and demand curves and indicate the equilibrium price and quantity. Then graph the new demand curve and determine the new equilibrium price and quantity. How does the decrease in demand affect the price and quantity of cars sold?
Problem 2:
Using the information in problem 3, suppose that demand decreases by 10,000 units at each price. Construct a new table of supply and demand relationships. Then illustrate the change in demand by graphing the new demand curve.
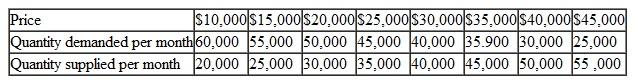
Problem 3:
The table below shows the supply and demand relationships in the market for cars. Graph the demand for and supply of cars and find the equilibrium price and equilibrium quantity of cars sold.
Problem 1:
Using the information from problem 2, graph the original supply and demand curves and indicate the equilibrium price and quantity. Then graph the new demand curve and determine the new equilibrium price and quantity. How does the decrease in demand affect the price and quantity of cars sold?
Problem 2:
Using the information in problem 3, suppose that demand decreases by 10,000 units at each price. Construct a new table of supply and demand relationships. Then illustrate the change in demand by graphing the new demand curve.
Problem 3:
The table below shows the supply and demand relationships in the market for cars. Graph the demand for and supply of cars and find the equilibrium price and equilibrium quantity of cars sold.
Explanation Verified
Equilibrium condition:
A product market...
Economic Analysis of Social Issues 1st Edition by Alan Grant
Why don’t you like this exercise?
Other Minimum 8 character and maximum 255 character
Character 255


