
Cost Management: A Strategic Emphasis 5th Edition by David Stout, Edward Blocher, Gary Cokins
Edition 5ISBN: 0073526940Cost Management: A Strategic Emphasis 5th Edition by David Stout, Edward Blocher, Gary Cokins
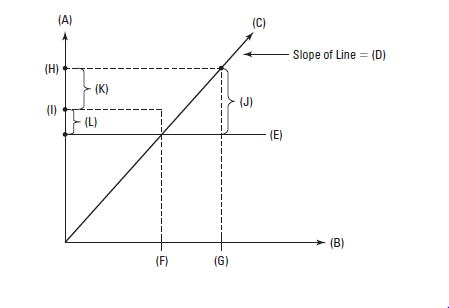
Edition 5ISBN: 0073526940Graphical Analysis—Fixed Overhead Variances (Continuance of 15-40) The controller is satisfied with the graphical representation you prepared in conjunction with 15-40. She thinks this graphical representation of variable overhead variances will be well received by operating managers of the company. As such, she asks you to prepare an accompanying graph for fixed overhead variances. She indicates that you should assume the following in constructing your graph: (1) fixed overhead is applied to production on the basis of standard machine hours allowed for the output of the period (the standard total overhead cost per machine hour is $10, while the standard variable overhead cost per machine hour is $6); (2) during the example case, there was a favorable production-volume variance and an unfavorable spending (budget) variance for fixed overhead. Based on these assumptions, the controller has asked you to complete the following graph.
Required
1. (A) = ?
2. (B) = ?
3. (C) = ?
4. (D) = ?
5. (E) = ?
6. (F) = ?
7. (G) = ?
8. (H) = ?
9. (I) = ?
10. Vertical distance (J) = ?
11. Vertical distance (K) = ?
12. Vertical distance (L) = ?
Step 1 of 13
Cost Variance and Capacity Management:
Cost variance (CV), otherwise called spending fluctuation, is the distinction between the real expense and the planned expense, or what you expected to spend versus what you really spent.
Capacity management refers to the demonstration of guaranteeing a business amplifies its possible exercises and creation yield—consistently, under all conditions. The limit of a business quantifies how much organizations can accomplish, produce, or sell inside a given time-span.
Step 2 of 13
Step 3 of 13
Step 4 of 13
Step 5 of 13
Step 6 of 13
Step 7 of 13
Step 8 of 13
Step 9 of 13
Step 10 of 13
Step 11 of 13
Step 12 of 13
Step 13 of 13
Why don’t you like this exercise?
Other


