expand icon
book Cost Management: A Strategic Emphasis 5th Edition by David Stout, Edward Blocher, Gary Cokins cover

Cost Management: A Strategic Emphasis 5th Edition by David Stout, Edward Blocher, Gary Cokins

Edition 5ISBN: 0073526940
book Cost Management: A Strategic Emphasis 5th Edition by David Stout, Edward Blocher, Gary Cokins cover

Cost Management: A Strategic Emphasis 5th Edition by David Stout, Edward Blocher, Gary Cokins

Edition 5ISBN: 0073526940
Exercise 72

Master Budget, Flexible Budget, and Profit-Variance Analysis Going into the period just ended, Ortiz&Co., manufacturer of a moderately priced espresso maker for retail sale, had planned to produce and sell 3,900 units at $100 per unit. Budgeted variable manufacturing costs per unit are $50. Ortiz pays its salespeople a 10 percent sales commission, which is the only variable nonmanufacturing cost for the company. Fixed costs are budgeted as follows: manufacturing, $50,000; marketing, $36,000.

Actual financial results for the period were disappointing. While sales volume was up (4,000 units sold), actual operating profit was only $20,000 for the period. Fixed manufacturing costs were as budgeted, but fixed marketing expenses exceeded budget by $4,000. Actual sales revenue for the period was $390,000, and actual variable costs were $70 per unit (the actual sales commission was 10 percent of sales revenue generated).

Required

1. Develop an Excel spreadsheet that is able to produce a profit-variance report similar to the one presented in text Exhibit 14.4.


2. Use the spreadsheet you developed in (1) and the data presented above to complete the profit-variance report for the period. Below the table you create, show separately the following variances:

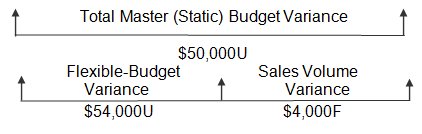
?a. Total master (static) budget variance (i.e., the total operating-income variance for the period).

?b. Total flexible-budget variance.

?c. Flexible-budget variance for total variable costs, plus the flexible-budget variance for:

??(1) variable manufacturing costs.

??(2) variable nonmanufacturing costs.

?d. Flexible-budget variance for total fixed costs, plus the flexible-budget variance for:

??(1) fixed manufacturing costs.

??(2) fixed nonmanufacturing costs.


3. Provide a concise interpretation for each of the variances calculated above in (2).


4. Using the variances you calculated above in (2), prepare in as much detail as the data allow, a separate summary report similar to text Exhibit 14.2.

Step-by-step solution
Verified
like image
like image

Step 1 of 3

1.  


Actual Results

Flexible-Budget Variances

Flexible Budget

Sales Volume Variance

Master (Static) Budget

Unit sales

4,000

0

4,000

100F

3,900

Sales

$390,000

$10,000U

$400,000

$10,000F

$390,000

Variable Costs:


Manufacturing

$241,000

$41,000U

$200,000

$5,000U

$195,000

Marketing

$39,000

$1,000F

$40,000

$1,000U

$39,000

Total Variable Costs

$280,000

$40,000U

$240,000

$6,000U

$234,000

CM

$110,000

$50,000U

$160,000

$4,000F

$156,000

Fixed Costs:


Manufacturing

$50,000

$0

$50,000

$0

$50,000

Marketing

$40,000

$4,000U

$36,000

$0

$36,000

Total Fixed Costs

$90,000

$4,000U

$86,000

$0

$86,000

Operating Income

$20,000

$54,000U

$74,000

$4,000F

$70,000

                                                    <div class=answer> 1.   <table width=50% cellspacing=0 cellpadding=5 border=0>     <tbody>      <tr>       <td valign=top>   </td>       <td valign=top> Actual <span class=underline>Results</span> </td>       <td valign=top> Flexible-Budget <span class=underline>Variances</span> </td>       <td valign=top> Flexible <span class=underline>Budget</span> </td>       <td valign=top> Sales Volume <span class=underline>Variance</span> </td>       <td valign=top> Master (Static) <span class=underline>Budget</span> </td>      </tr>      <tr>       <td valign=top> Unit sales </td>       <td valign=top><p align=right><span class=underline>4,000</span> </td>       <td valign=top><p align=right><span class=underline>0</span> </td>       <td valign=top><p align=right><span class=underline>4,000</span> </td>       <td valign=top><p align=right>100F </td>       <td valign=top><p align=right><span class=underline>3,900</span> </td>      </tr>      <tr>       <td valign=top> Sales </td>       <td valign=top><p align=right>$390,000 </td>       <td valign=top><p align=right>$10,000U </td>       <td valign=top><p align=right>$400,000 </td>       <td valign=top><p align=right>$10,000F </td>       <td valign=top><p align=right>$390,000 </td>      </tr>      <tr>       <td valign=top> Variable Costs: </td>       <td valign=top><p align=right>  </td>       <td valign=top><p align=right>  </td>       <td valign=top><p align=right>  </td>       <td valign=top><p align=right>  </td>       <td valign=top><p align=right>  </td>      </tr>      <tr>       <td valign=top> Manufacturing </td>       <td valign=top><p align=right>$241,000 </td>       <td valign=top><p align=right>$41,000U </td>       <td valign=top><p align=right>$200,000 </td>       <td valign=top><p align=right>$5,000U </td>       <td valign=top><p align=right>$195,000 </td>      </tr>      <tr>       <td valign=top> Marketing </td>       <td valign=top><p align=right><span class=underline>$39,000</span> </td>       <td valign=top><p align=right><span class=underline>$1,000</span>F </td>       <td valign=top><p align=right><span class=underline>$40,000</span> </td>       <td valign=top><p align=right><span class=underline>$1,000</span>U </td>       <td valign=top><p align=right><span class=underline>$39,000</span> </td>      </tr>      <tr>       <td valign=top> Total Variable Costs </td>       <td valign=top><p align=right><span class=underline>$280,000</span> </td>       <td valign=top><p align=right><span class=underline>$40,000</span>U </td>       <td valign=top><p align=right><span class=underline>$240,000</span> </td>       <td valign=top><p align=right><span class=underline>$6,000</span>U </td>       <td valign=top><p align=right><span class=underline>$234,000</span> </td>      </tr>      <tr>       <td valign=top> CM </td>       <td valign=top><p align=right>$110,000 </td>       <td valign=top><p align=right>$50,000U </td>       <td valign=top><p align=right>$160,000 </td>       <td valign=top><p align=right>$4,000F </td>       <td valign=top><p align=right>$156,000 </td>      </tr>      <tr>       <td valign=top> Fixed Costs: </td>       <td valign=top><p align=right>  </td>       <td valign=top><p align=right>  </td>       <td valign=top><p align=right>  </td>       <td valign=top><p align=right>  </td>       <td valign=top><p align=right>  </td>      </tr>      <tr>       <td valign=top> Manufacturing </td>       <td valign=top><p align=right>$50,000 </td>       <td valign=top><p align=right>$0 </td>       <td valign=top><p align=right>$50,000 </td>       <td valign=top><p align=right>$0 </td>       <td valign=top><p align=right>$50,000 </td>      </tr>      <tr>       <td valign=top> Marketing </td>       <td valign=top><p align=right><span class=underline>$40,000</span> </td>       <td valign=top><p align=right><span class=underline>$4,000</span>U </td>       <td valign=top><p align=right><span class=underline>$36,000</span> </td>       <td valign=top><p align=right><span class=underline>$0</span> </td>       <td valign=top><p align=right><span class=underline>$36,000</span> </td>      </tr>      <tr>       <td valign=top> Total Fixed Costs </td>       <td valign=top><p align=right><span class=underline>$90,000</span> </td>       <td valign=top><p align=right><span class=underline>$4,000</span>U </td>       <td valign=top><p align=right><span class=underline>$86,000</span> </td>       <td valign=top><p align=right><span class=underline>$0</span> </td>       <td valign=top><p align=right><span class=underline>$86,000</span> </td>      </tr>      <tr>       <td valign=top> Operating Income </td>       <td valign=top><p align=right><span class=underline>$20,000</span> </td>       <td valign=top><p align=right><span class=underline>$54,000</span>U </td>       <td valign=top><p align=right><span class=underline>$74,000</span> </td>       <td valign=top><p align=right><span class=underline>$4,000</span>F </td>       <td valign=top><p align=right><span class=underline>$70,000</span> </td>      </tr>     </tbody>    </table>                                                 


Step 2 of 3


Step 3 of 3

close menu
Cost Management: A Strategic Emphasis 5th Edition by David Stout, Edward Blocher, Gary Cokins
cross icon