
Cost Management: A Strategic Emphasis 5th Edition by David Stout, Edward Blocher, Gary Cokins
Edition 5ISBN: 0073526940Cost Management: A Strategic Emphasis 5th Edition by David Stout, Edward Blocher, Gary Cokins
Edition 5ISBN: 0073526940Job Costing, Departmental Rates, Pivot Tables in Excel (see also 4-45)
Boston Manufacturing Company had the following cost information for May.
| Summary of Direct Materials Requisitions | ||
Department Number | Job Number | Quantity | Cost per Unit |
1 | 88X | 6,650 | $8.31 |
1 | 88Y | 2,130 | 2.52 |
1 | 88Z | 1,818 | 9.16 |
1 | 88Y | 921 | 4.18 |
1 | 88Z | 63 | 3.23 |
| Summary of Direct Labor Time Tickets | |
Department Number | Job Number | Hours |
1 | 88X | 554 |
2 | 88Y | 321 |
2 | 88Z | 618 |
1 | 88Y | 25 |
1 | 88Z | 613 |
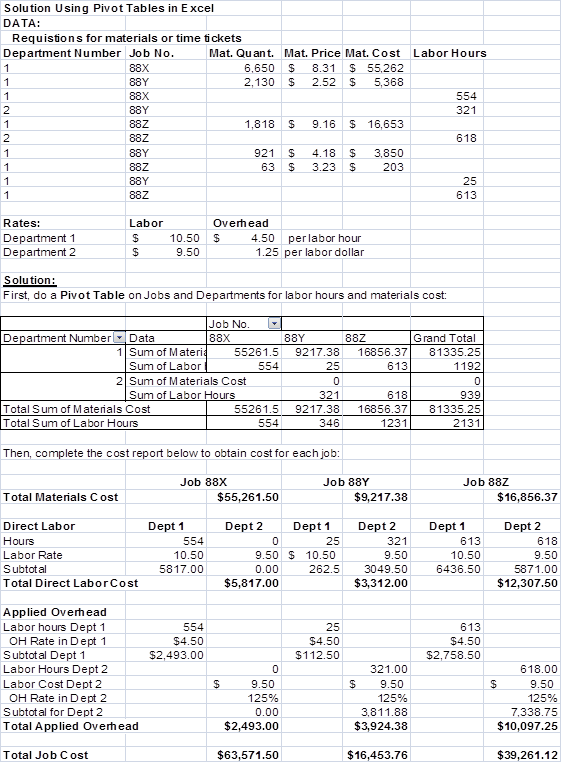
The labor rate in Department 1 is $10.50 and in Department 2 is $9.50. The overhead rate in Department 1 is based on direct labor-hours, at $4.50 per hour; in Department 2 the rate is 125 percent of direct labor cost.
Boston had no beginning work-in-process inventory for May. Of the jobs begun in May, Job 88X was completed and sold on account for $86,000, Job 88Y was completed but not sold, and Job 88Z was still in process.
Required
1. Using Pivot Tables in Excel, calculate the direct materials, direct labor, factory overhead, and total costs for each job started in May.
2. Perform the same calculations as in requirement (1), but assume that labor rates in both departments have increased by 20 percent.
Step 1 of 5
1.?Solution using Pivot Tables: (See Note at end of Solution)
Step 2 of 5
Step 3 of 5
Step 4 of 5
Step 5 of 5
Why don’t you like this exercise?
Other


