
Introductory Econometrics: A Modern Approach 6th Edition by Jeffrey M Wooldridge
Edition 6ISBN: 130527010XIntroductory Econometrics: A Modern Approach 6th Edition by Jeffrey M Wooldridge
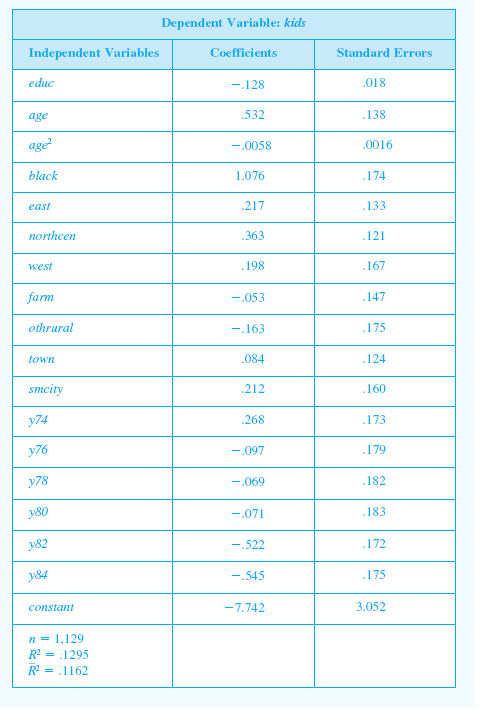
Edition 6ISBN: 130527010XRefer to Table in Chapter 13. There, we used the data in FERTIL1.RAW to estimate a linear model for kids, the number of children ever born to a woman.
(i) Estimate a Poisson regression model for kids, using the same variables in Table 13.1. Interpret the coefficient on y82.
(ii) What is the estimated percentage difference in fertility between a black woman and a nonblack woman, holding other factors fixed?
(iii) Obtain u. Is there evidence of over- or underdispersion?
(iv) Compute the fitted values from the Poisson regression and obtain the R-squared as the squared correlation between kidsi and
Compare this with the R-squared for the linear regression model.
Determinants of Women’s Fertility
Step 1 of 5
(i)
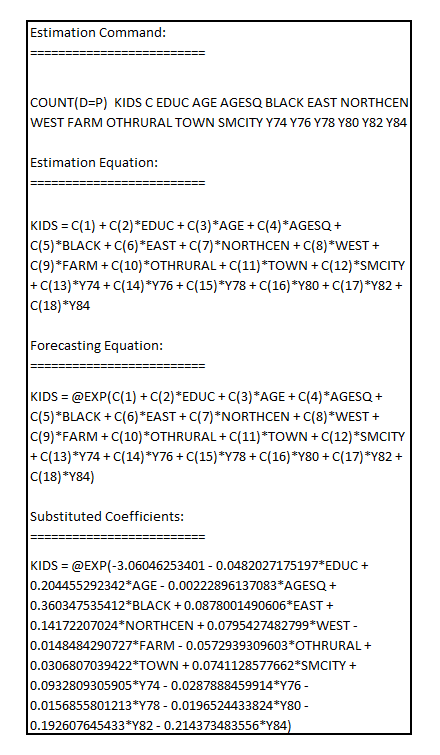
Estimate the Poisson regression model with  as the dependent variable on
The result is:
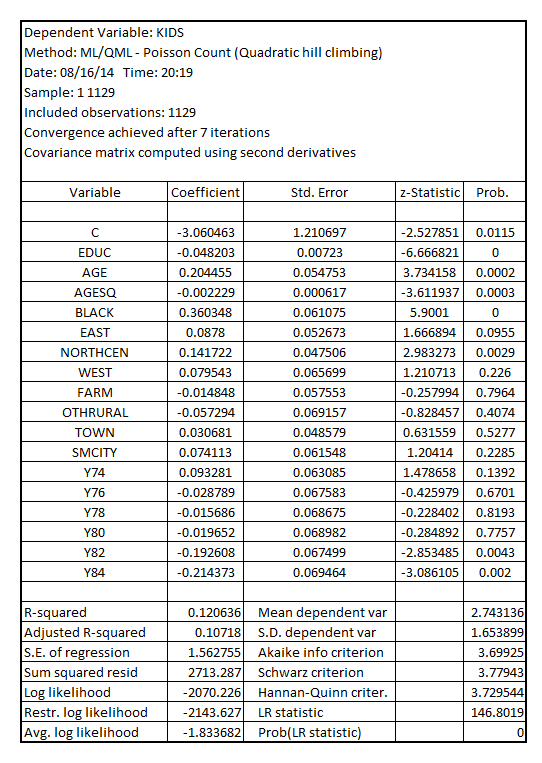
The coefficient of  is -0.192608 and it is significant at 5% level of significance as its p-value is 0.0043 which is less than critical p-value of 0.05 at 5% level of significance.
This coefficient is interpreted as a decline in the fertility rate by 19.26% in the year 1982 vis-à-vis the year 1972.
Step 2 of 5
Step 3 of 5
Step 4 of 5
Step 5 of 5
Why don’t you like this exercise?
Other


