
Introductory Econometrics: A Modern Approach 6th Edition by Jeffrey M Wooldridge
Edition 6ISBN: 130527010XIntroductory Econometrics: A Modern Approach 6th Edition by Jeffrey M Wooldridge
Edition 6ISBN: 130527010XThe data set in VOUCHER.DTA, which is a subset of the data used in Rouse (1998), can be used to estimate the effect of school choice on academic achievement. Attendance at a choice school was paid for by a voucher, which was determined by a lottery among those who applied. The data subset was chosen so that any student in the sample has a valid 1994 math test score (the last year available in Rouse’s sample). Unfortunately, as pointed out by Rouse, many students have missing test scores, possibly due to attrition (that is, leaving the Milwaukee public school district). These data include students who applied to the voucher program and were accepted, students who applied and were not accepted, and students who did not apply. Therefore, even though the vouchers were chosen by lottery among those who applied, we do not necessarily have a random sample from a population where being selected for a voucher has been randomly determined. (An important consideration is that students who never applied to the program may be systematically different from those who did—and in ways that we cannot know based on the data.)
Rouse (1998) uses panel data methods of the kind we discussed in Chapter 14 to allow student fixed effects; she also uses instrumental variables methods. This problem asks you to do a cross-sectional analysis where winning the lottery for a voucher acts as an instrumental variable for attending a choice school. Actually, because we have multiple years of data on each student, we construct two variables. The first, choiceyrs, is the number of years from 1991 to 1994 that a student attended a choice school; this variable ranges from zero to four. The variable selectyrs indicates the number of years a student was selected for a voucher. If the student applied for the program in 1990 and received a voucher then selectyrs = 4; if he or she applied in 1991 and received a voucher then
selectyrs = 3; and so on. The outcome of interest is mnce, the student’s percentile score
on a math test administered in 1994.
(i) Of the 990 students in the sample, how many were never awarded a voucher? How many had a voucher available for four years? How many students actually attended a choice school for four years?
(ii) Run a simple regression of choiceyrs on selectyrs. Are these variables related in the direction you expected? How strong is the relationship? Is selectyrs a sensible IV candidate for choiceyrs?
(iii) Run a simple regression of mnce on choiceyrs. What do you find? Is this what you expected? What happens if you add the variables black, hispanic, and female?
(iv) Why might choiceyrs be endogenous in an equation such as ![The data set in VOUCHER.DTA, which is a subset of the data used in Rouse (1998), can be used to estimate the effect of school choice on academic achievement. Attendance at a choice school was paid for by a voucher, which was determined by a lottery among those who applied. The data subset was chosen so that any student in the sample has a valid 1994 math test score (the last year available in Rouse’s sample). Unfortunately, as pointed out by Rouse, many students have missing test scores, possibly due to attrition (that is, leaving the Milwaukee public school district). These data include students who applied to the voucher program and were accepted, students who applied and were not accepted, and students who did not apply. Therefore, even though the vouchers were chosen by lottery among those who applied, we do not necessarily have a random sample from a population where being selected for a voucher has been randomly determined. (An important consideration is that students who never applied to the program may be systematically different from those who did—and in ways that we cannot know based on the data.) Rouse (1998) uses panel data methods of the kind we discussed in Chapter 14 to allow student fixed effects; she also uses instrumental variables methods. This problem asks you to do a cross-sectional analysis where winning the lottery for a voucher acts as an instrumental variable for attending a choice school. Actually, because we have multiple years of data on each student, we construct two variables. The first, <i>choiceyrs</i>, is the number of years from 1991 to 1994 that a student attended a choice school; this variable ranges from zero to four. The variable <i>selectyrs </i>indicates the number of years a student was selected for a voucher. If the student applied for the program in 1990 and received a voucher then <i>selectyrs = </i>4; if he or she applied in 1991 and received a voucher then <i>selectyrs = </i>3; and so on. The outcome of interest is <i>mnce</i>, the student’s percentile score on a math test administered in 1994. (i) Of the 990 students in the sample, how many were never awarded a voucher? How many had a voucher available for four years? How many students actually attended a choice school for four years? (ii) Run a simple regression of <i>choiceyrs </i>on <i>selectyrs</i>. Are these variables related in the direction you expected? How strong is the relationship? Is <i>selectyrs </i>a sensible IV candidate for <i>choiceyrs</i>? (iii) Run a simple regression of <i>mnce </i>on <i>choiceyrs</i>. What do you find? Is this what you expected? What happens if you add the variables <i>black</i>, <i>hispanic</i>, and <i>female</i>? (iv) Why might <i>choiceyrs </i>be endogenous in an equation such as <i> </i> (v) Estimate the equation in part (iv) by instrumental variables, using <i>selectyrs </i>as the IV for <i>choiceyrs</i>. Does using IV produce a positive effect of attending a choice school? What do you make of the coefficients on the other explanatory vairables? (vi) To control for the possibility that prior achievement affects participating in the lottery (as well as predicting attrition), add <i>mnce</i>90—the math score in 1990—to the equation in part (iv). Estimate the equation by OLS and IV, and compare the results for <i> </i>For the IV estimate, how much is each year in a choice school worth on the math percentile score? Is this a practically large effect? (vii) Why is the analysis from part (vi) not entirely convincing? [Hint: Compared with part (v), what happens to the number of observations, and why?] (viii) The variables <i>choiceyrs</i>1, <i>choiceyrs</i>2, and so on are dummy variables indicating the different number of years a student could have been in a choice school (from 1991 to 1994). The dummy variables <i>selectyrs</i>1, <i>selectyrs</i>2, and so on have a similar definition, but for being selected from the lottery. Estimate the equation <i> </i> by IV, using as instruments the four <i>selectyrs </i>dummy variables. (As before, the variables <i>black</i>, <i>hispanic</i>, and <i>female </i>act as their own IVs.) Describe your findings. Do they make sense?](https://d2lvgg3v3hfg70.cloudfront.net/SMCC2709/cc2f00ec_706c_40bd_b051_4f7888eef461_SMCC2709_11.jpg)
(v) Estimate the equation in part (iv) by instrumental variables, using selectyrs as the IV for choiceyrs. Does using IV produce a positive effect of attending a choice school? What do you make of the coefficients on the other explanatory vairables?
(vi) To control for the possibility that prior achievement affects participating in the lottery (as well as predicting attrition), add mnce90—the math score in 1990—to the equation in part (iv). Estimate the equation by OLS and IV, and compare the results for ![The data set in VOUCHER.DTA, which is a subset of the data used in Rouse (1998), can be used to estimate the effect of school choice on academic achievement. Attendance at a choice school was paid for by a voucher, which was determined by a lottery among those who applied. The data subset was chosen so that any student in the sample has a valid 1994 math test score (the last year available in Rouse’s sample). Unfortunately, as pointed out by Rouse, many students have missing test scores, possibly due to attrition (that is, leaving the Milwaukee public school district). These data include students who applied to the voucher program and were accepted, students who applied and were not accepted, and students who did not apply. Therefore, even though the vouchers were chosen by lottery among those who applied, we do not necessarily have a random sample from a population where being selected for a voucher has been randomly determined. (An important consideration is that students who never applied to the program may be systematically different from those who did—and in ways that we cannot know based on the data.) Rouse (1998) uses panel data methods of the kind we discussed in Chapter 14 to allow student fixed effects; she also uses instrumental variables methods. This problem asks you to do a cross-sectional analysis where winning the lottery for a voucher acts as an instrumental variable for attending a choice school. Actually, because we have multiple years of data on each student, we construct two variables. The first, <i>choiceyrs</i>, is the number of years from 1991 to 1994 that a student attended a choice school; this variable ranges from zero to four. The variable <i>selectyrs </i>indicates the number of years a student was selected for a voucher. If the student applied for the program in 1990 and received a voucher then <i>selectyrs = </i>4; if he or she applied in 1991 and received a voucher then <i>selectyrs = </i>3; and so on. The outcome of interest is <i>mnce</i>, the student’s percentile score on a math test administered in 1994. (i) Of the 990 students in the sample, how many were never awarded a voucher? How many had a voucher available for four years? How many students actually attended a choice school for four years? (ii) Run a simple regression of <i>choiceyrs </i>on <i>selectyrs</i>. Are these variables related in the direction you expected? How strong is the relationship? Is <i>selectyrs </i>a sensible IV candidate for <i>choiceyrs</i>? (iii) Run a simple regression of <i>mnce </i>on <i>choiceyrs</i>. What do you find? Is this what you expected? What happens if you add the variables <i>black</i>, <i>hispanic</i>, and <i>female</i>? (iv) Why might <i>choiceyrs </i>be endogenous in an equation such as <i> </i> (v) Estimate the equation in part (iv) by instrumental variables, using <i>selectyrs </i>as the IV for <i>choiceyrs</i>. Does using IV produce a positive effect of attending a choice school? What do you make of the coefficients on the other explanatory vairables? (vi) To control for the possibility that prior achievement affects participating in the lottery (as well as predicting attrition), add <i>mnce</i>90—the math score in 1990—to the equation in part (iv). Estimate the equation by OLS and IV, and compare the results for <i> </i>For the IV estimate, how much is each year in a choice school worth on the math percentile score? Is this a practically large effect? (vii) Why is the analysis from part (vi) not entirely convincing? [Hint: Compared with part (v), what happens to the number of observations, and why?] (viii) The variables <i>choiceyrs</i>1, <i>choiceyrs</i>2, and so on are dummy variables indicating the different number of years a student could have been in a choice school (from 1991 to 1994). The dummy variables <i>selectyrs</i>1, <i>selectyrs</i>2, and so on have a similar definition, but for being selected from the lottery. Estimate the equation <i> </i> by IV, using as instruments the four <i>selectyrs </i>dummy variables. (As before, the variables <i>black</i>, <i>hispanic</i>, and <i>female </i>act as their own IVs.) Describe your findings. Do they make sense?](https://d2lvgg3v3hfg70.cloudfront.net/SMCC2709/438c8049_d6f1_4bbc_86e3_e32b0d3de755_SMCC2709_11.jpg) For the IV estimate, how much is each year in a choice school worth on the math percentile score? Is this a practically large effect?
For the IV estimate, how much is each year in a choice school worth on the math percentile score? Is this a practically large effect?
(vii) Why is the analysis from part (vi) not entirely convincing? [Hint: Compared with part (v), what happens to the number of observations, and why?]
(viii) The variables choiceyrs1, choiceyrs2, and so on are dummy variables indicating the different number of years a student could have been in a choice school (from 1991 to 1994). The dummy variables selectyrs1, selectyrs2, and so on have a similar definition, but for being selected from the lottery. Estimate the equation
![The data set in VOUCHER.DTA, which is a subset of the data used in Rouse (1998), can be used to estimate the effect of school choice on academic achievement. Attendance at a choice school was paid for by a voucher, which was determined by a lottery among those who applied. The data subset was chosen so that any student in the sample has a valid 1994 math test score (the last year available in Rouse’s sample). Unfortunately, as pointed out by Rouse, many students have missing test scores, possibly due to attrition (that is, leaving the Milwaukee public school district). These data include students who applied to the voucher program and were accepted, students who applied and were not accepted, and students who did not apply. Therefore, even though the vouchers were chosen by lottery among those who applied, we do not necessarily have a random sample from a population where being selected for a voucher has been randomly determined. (An important consideration is that students who never applied to the program may be systematically different from those who did—and in ways that we cannot know based on the data.) Rouse (1998) uses panel data methods of the kind we discussed in Chapter 14 to allow student fixed effects; she also uses instrumental variables methods. This problem asks you to do a cross-sectional analysis where winning the lottery for a voucher acts as an instrumental variable for attending a choice school. Actually, because we have multiple years of data on each student, we construct two variables. The first, <i>choiceyrs</i>, is the number of years from 1991 to 1994 that a student attended a choice school; this variable ranges from zero to four. The variable <i>selectyrs </i>indicates the number of years a student was selected for a voucher. If the student applied for the program in 1990 and received a voucher then <i>selectyrs = </i>4; if he or she applied in 1991 and received a voucher then <i>selectyrs = </i>3; and so on. The outcome of interest is <i>mnce</i>, the student’s percentile score on a math test administered in 1994. (i) Of the 990 students in the sample, how many were never awarded a voucher? How many had a voucher available for four years? How many students actually attended a choice school for four years? (ii) Run a simple regression of <i>choiceyrs </i>on <i>selectyrs</i>. Are these variables related in the direction you expected? How strong is the relationship? Is <i>selectyrs </i>a sensible IV candidate for <i>choiceyrs</i>? (iii) Run a simple regression of <i>mnce </i>on <i>choiceyrs</i>. What do you find? Is this what you expected? What happens if you add the variables <i>black</i>, <i>hispanic</i>, and <i>female</i>? (iv) Why might <i>choiceyrs </i>be endogenous in an equation such as <i> </i> (v) Estimate the equation in part (iv) by instrumental variables, using <i>selectyrs </i>as the IV for <i>choiceyrs</i>. Does using IV produce a positive effect of attending a choice school? What do you make of the coefficients on the other explanatory vairables? (vi) To control for the possibility that prior achievement affects participating in the lottery (as well as predicting attrition), add <i>mnce</i>90—the math score in 1990—to the equation in part (iv). Estimate the equation by OLS and IV, and compare the results for <i> </i>For the IV estimate, how much is each year in a choice school worth on the math percentile score? Is this a practically large effect? (vii) Why is the analysis from part (vi) not entirely convincing? [Hint: Compared with part (v), what happens to the number of observations, and why?] (viii) The variables <i>choiceyrs</i>1, <i>choiceyrs</i>2, and so on are dummy variables indicating the different number of years a student could have been in a choice school (from 1991 to 1994). The dummy variables <i>selectyrs</i>1, <i>selectyrs</i>2, and so on have a similar definition, but for being selected from the lottery. Estimate the equation <i> </i> by IV, using as instruments the four <i>selectyrs </i>dummy variables. (As before, the variables <i>black</i>, <i>hispanic</i>, and <i>female </i>act as their own IVs.) Describe your findings. Do they make sense?](https://d2lvgg3v3hfg70.cloudfront.net/SMCC2709/9ebc7263_9959_4088_9f97_45ddd743aad0_SMCC2709_11.jpg)
by IV, using as instruments the four selectyrs dummy variables. (As before, the variables black, hispanic, and female act as their own IVs.) Describe your findings. Do they make sense?
Step 1 of 14
(i)
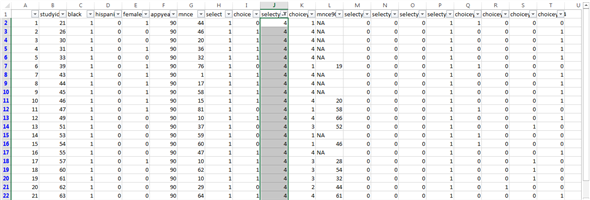
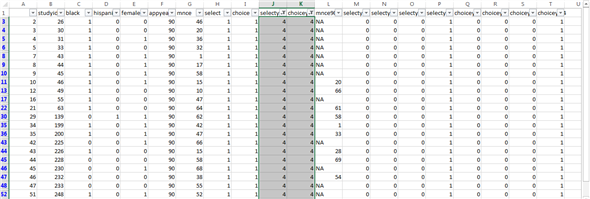
Consider the data for vouchers in Excel and put filter as shown below:
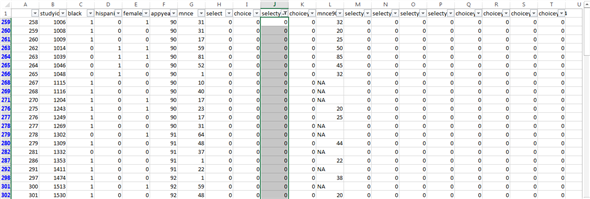
Therefore, the number of students never awarded a voucher are 468. Now look at the variables selectyrs and choiceyrs. From selectyrs, out of 990 students, 468 were never awarded a voucher and 108 were selected in the voucher system for all four years. From choiceyrs, only 56 actually attended a choice school for four years.
Therefore, the number of students selected for all the four years awarded a voucher are 108.
Therefore, the number of students attended the school for all the four years school awarded a voucher are 108.
Step 2 of 14
Step 3 of 14
Step 4 of 14
Step 5 of 14
Step 6 of 14
Step 7 of 14
Step 8 of 14
Step 9 of 14
Step 10 of 14
Step 11 of 14
Step 12 of 14
Step 13 of 14
Step 14 of 14
Why don’t you like this exercise?
Other


