
Introductory Econometrics: A Modern Approach 6th Edition by Jeffrey M Wooldridge
Edition 6ISBN: 130527010XIntroductory Econometrics: A Modern Approach 6th Edition by Jeffrey M Wooldridge
Edition 6ISBN: 130527010XUse the data in BEVERIDGE.RAW to answer this question. The data set includes monthly observations on vacancy rates and unemployment rates for the U.S. from December 2000 through February 2012.
(i) Find the correlation beween urate and urate_1. Would you say the correlation points more toward a unit root process or a weakly dependent process?
(ii) Repeat part (i) but with the vacancy rate, vrate.
(iii) The Beveridge Curve relates the unemployment rate to the vacancy rate, with the simplest relationship being linear
![Use the data in BEVERIDGE.RAW to answer this question. The data set includes monthly observations on vacancy rates and unemployment rates for the U.S. from December 2000 through February 2012. (i) Find the correlation beween <i>urate </i>and <i>urate</i>_1. Would you say the correlation points more toward a unit root process or a weakly dependent process? (ii) Repeat part (i) but with the vacancy rate, <i>vrate</i>. (iii) The Beveridge Curve relates the unemployment rate to the vacancy rate, with the simplest relationship being linear <i> </i> where <i> </i>is expected. Estimate <i> </i>by OLS and report the results in the usual form. Do you find a negative relationship? (iv) Explain why you cannot trust the confidence interval for <i> </i> reported by the OLS output in part (iii). [The tools needed to study regressions of this type are presented in Chapter18.] (v) If you difference <i>urate </i>and <i>vrate </i>before running the regression, how does the estimated slope coefficient compare with part (iii)? Is it statistically different from zero? [This example shows that differencing before running an OLS regression is not always a sensible strategy. But we cannot say more until Chapter 18.]](https://d2lvgg3v3hfg70.cloudfront.net/SMCC2709/706db1ca_7b13_4ed0_9b9c_347624f2748f_SMCC2709_11.jpg)
where ![Use the data in BEVERIDGE.RAW to answer this question. The data set includes monthly observations on vacancy rates and unemployment rates for the U.S. from December 2000 through February 2012. (i) Find the correlation beween <i>urate </i>and <i>urate</i>_1. Would you say the correlation points more toward a unit root process or a weakly dependent process? (ii) Repeat part (i) but with the vacancy rate, <i>vrate</i>. (iii) The Beveridge Curve relates the unemployment rate to the vacancy rate, with the simplest relationship being linear <i> </i> where <i> </i>is expected. Estimate <i> </i>by OLS and report the results in the usual form. Do you find a negative relationship? (iv) Explain why you cannot trust the confidence interval for <i> </i> reported by the OLS output in part (iii). [The tools needed to study regressions of this type are presented in Chapter18.] (v) If you difference <i>urate </i>and <i>vrate </i>before running the regression, how does the estimated slope coefficient compare with part (iii)? Is it statistically different from zero? [This example shows that differencing before running an OLS regression is not always a sensible strategy. But we cannot say more until Chapter 18.]](https://d2lvgg3v3hfg70.cloudfront.net/SMCC2709/635e0f9e_d362_4657_98d2_4a42459ed745_SMCC2709_11.jpg) is expected. Estimate
is expected. Estimate ![Use the data in BEVERIDGE.RAW to answer this question. The data set includes monthly observations on vacancy rates and unemployment rates for the U.S. from December 2000 through February 2012. (i) Find the correlation beween <i>urate </i>and <i>urate</i>_1. Would you say the correlation points more toward a unit root process or a weakly dependent process? (ii) Repeat part (i) but with the vacancy rate, <i>vrate</i>. (iii) The Beveridge Curve relates the unemployment rate to the vacancy rate, with the simplest relationship being linear <i> </i> where <i> </i>is expected. Estimate <i> </i>by OLS and report the results in the usual form. Do you find a negative relationship? (iv) Explain why you cannot trust the confidence interval for <i> </i> reported by the OLS output in part (iii). [The tools needed to study regressions of this type are presented in Chapter18.] (v) If you difference <i>urate </i>and <i>vrate </i>before running the regression, how does the estimated slope coefficient compare with part (iii)? Is it statistically different from zero? [This example shows that differencing before running an OLS regression is not always a sensible strategy. But we cannot say more until Chapter 18.]](https://d2lvgg3v3hfg70.cloudfront.net/SMCC2709/5b7162ce_7814_4e6a_a2fd_358ae002042a_SMCC2709_11.jpg) by OLS and report the results in the usual form. Do you find a negative relationship?
by OLS and report the results in the usual form. Do you find a negative relationship?
(iv) Explain why you cannot trust the confidence interval for ![Use the data in BEVERIDGE.RAW to answer this question. The data set includes monthly observations on vacancy rates and unemployment rates for the U.S. from December 2000 through February 2012. (i) Find the correlation beween <i>urate </i>and <i>urate</i>_1. Would you say the correlation points more toward a unit root process or a weakly dependent process? (ii) Repeat part (i) but with the vacancy rate, <i>vrate</i>. (iii) The Beveridge Curve relates the unemployment rate to the vacancy rate, with the simplest relationship being linear <i> </i> where <i> </i>is expected. Estimate <i> </i>by OLS and report the results in the usual form. Do you find a negative relationship? (iv) Explain why you cannot trust the confidence interval for <i> </i> reported by the OLS output in part (iii). [The tools needed to study regressions of this type are presented in Chapter18.] (v) If you difference <i>urate </i>and <i>vrate </i>before running the regression, how does the estimated slope coefficient compare with part (iii)? Is it statistically different from zero? [This example shows that differencing before running an OLS regression is not always a sensible strategy. But we cannot say more until Chapter 18.]](https://d2lvgg3v3hfg70.cloudfront.net/SMCC2709/dabd1557_055d_44c5_a507_93f4be391e6b_SMCC2709_11.jpg) reported by the OLS output in part (iii). [The tools needed to study regressions of this type are presented in Chapter18.]
reported by the OLS output in part (iii). [The tools needed to study regressions of this type are presented in Chapter18.]
(v) If you difference urate and vrate before running the regression, how does the estimated slope coefficient compare with part (iii)? Is it statistically different from zero? [This example shows that differencing before running an OLS regression is not always a sensible strategy. But we cannot say more until Chapter 18.]
Step 1 of 6
(i)
The correlation between  and
and  is given by:
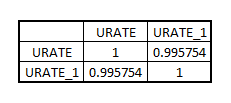
The correlation is 0.995754. The correlation value of 0.995754 is very close to 1, indicating towards a unit root process.
Step 2 of 6
Step 3 of 6
Step 4 of 6
Step 5 of 6
Step 6 of 6
Why don’t you like this exercise?
Other


