
Introductory Econometrics: A Modern Approach 6th Edition by Jeffrey M Wooldridge
Edition 6ISBN: 130527010XIntroductory Econometrics: A Modern Approach 6th Edition by Jeffrey M Wooldridge
Edition 6ISBN: 130527010XUse the data in PHILLIPS.RAW for this exercise, but only through 1996.
(i) In Example 11.5, we assumed that the natural rate of unemployment is constant. An alternative form of the expectations augmented Phillips curve allows the natural rate of unemployment to depend on past levels of unemployment. In the simplest case, the natural rate at time t equals unemt-1. If we assume adaptive expectations, we obtain a Phillips curve where inflation and unemployment are in first differences: ?inf = ?0 + ?1?unem + u. Estimate this model, report the results in the usual form, and discuss the sign, size, and statistical significance of
.
(ii) Which model fits the data better, or the model from part (i)? Explain.
Step 1 of 2
The Phillips curve in which the inflation and unemployment rate are in the first difference is given by:

Where,

The result is as follows:
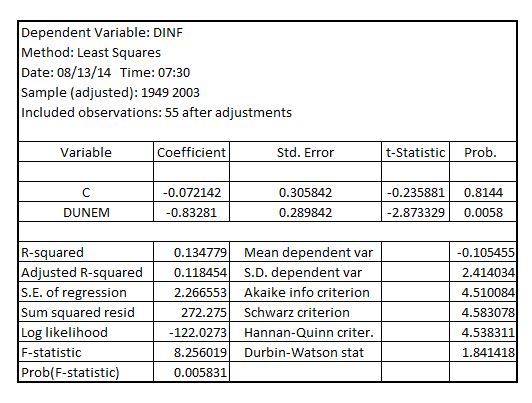
Hence, in the standard form, the Phillips curve is represented by:

The sign of  is negative, indicating the existence of trade-off between inflation rate and unemployment rate. The value of
  is -0.83281, which is statistically significant at 5% level of significance, because, its p-value is 0.0058 which is less than critical p-value of 0.05 at 5% level of significance.
Step 2 of 2
Why don’t you like this exercise?
Other


