
Introductory Econometrics: A Modern Approach 6th Edition by Jeffrey M Wooldridge
Edition 6ISBN: 130527010XIntroductory Econometrics: A Modern Approach 6th Edition by Jeffrey M Wooldridge
Edition 6ISBN: 130527010XUse the data set CONSUMP.RAW for this exercise.
(i) Estimate a simple regression model relating the growth in real per capita consumption (of nondurables and services) to the growth in real per capita disposable income. Use the change in the logarithms in both cases. Report the results in the usual form. Interpret the equation and discuss statistical significance.
(ii) Add a lag of the growth in real per capita disposable income to the equation from part (i). What do you conclude about adjustment lags in consumption growth?
(iii) Add the real interest rate to the equation in part (i). Does it affect consumption growth .
Step 1 of 4
(i)
Estimate the simple regression model relating the growth in real per capita consumption of nondurables and services ( ) to growth in real per capita disposable Income (
 ). The result is:
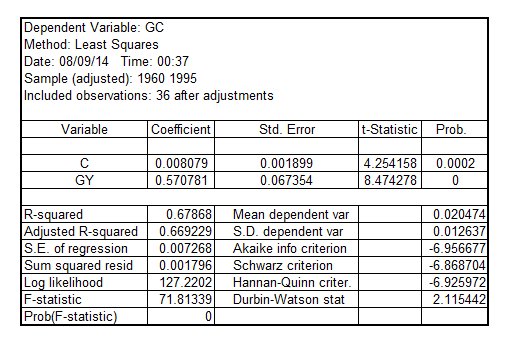
Hence, the regression model is:


From this regression model, it can be interpreted that if the income growth increases by 1%, the consumption growth increases by 0.57%
The coefficient of  is 0.570781 with the p-value 0.0000 which is less than the critical p-value of 0.05 at 5% level of significance. This indicates that the coefficient of
  is statistically significant at 5% level of significance.
Step 2 of 4
Step 3 of 4
Step 4 of 4
Why don’t you like this exercise?
Other


