expand icon
book Introductory Econometrics: A Modern Approach 6th Edition by Jeffrey M Wooldridge cover

Introductory Econometrics: A Modern Approach 6th Edition by Jeffrey M Wooldridge

Edition 6ISBN: 130527010X
book Introductory Econometrics: A Modern Approach 6th Edition by Jeffrey M Wooldridge cover

Introductory Econometrics: A Modern Approach 6th Edition by Jeffrey M Wooldridge

Edition 6ISBN: 130527010X
Exercise 19

Use the data in HTV.RAW to answer this question. The data set includes information on wages, education, parents’ education, and several other variables for 1,230 working men in 1991.

(i) What is the range of the educ variable in the sample? What percentage of men completed 12th grade but no higher grade? Do the men or their parents have, on average, higher levels of education?

(ii) Estimate the regression model

 Use the data in HTV.RAW to answer this question. The data set includes information on wages, education, parents’ education, and several other variables for 1,230 working men in 1991. (i) What is the range of the <i>educ </i>variable in the sample? What percentage of men completed 12th grade but no higher grade? Do the men or their parents have, on average, higher levels of education? (ii) Estimate the regression model <i>   </i> by OLS and report the results in the usual form. How much sample variation in <i>educ </i>is explained by parents’ education? Interpret the coefficient on <i>motheduc</i>. (iii) Add the variable <i>abil </i>(a measure of cognitive ability) to the regression from part (ii), and report the results in equation form. Does “ability” help to explainvariations in education, even after controlling for parents’ education? Explain. (iv) (Requires calculus) Now estimate an equation where <i>abil </i>appears in quadratic form: <i>   </i> Using the estimates <i>   </i>use calculus to find the value of <i>abil</i>, call it <i>abil</i><sup>*</sup>, where <i>educ </i>is minimized. (The other coefficients and values of parents’ education variables have no effect; we are holding parents’ education fixed.) Notice that <i>abil</i> is measured so that negative values are permissible. You might also verify that the second derivative is positive so that you do indeed have a minimum. (v) Argue that only a small fraction of men in the sample have “ability” less than the value calculated in part (iv). Why is this important? (vi) If you have access to a statistical program that includes graphing capabilities, use the estimates in part (iv) to graph the relationship beween the predicted education and <i>abil</i>. Let <i>motheduc </i>and <i>fatheduc </i>have their average values in the sample, 12.18 and 12.45, respectively.

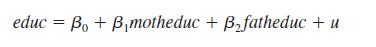
by OLS and report the results in the usual form. How much sample variation in educ is explained by parents’ education? Interpret the coefficient on motheduc.

(iii) Add the variable abil (a measure of cognitive ability) to the regression from part (ii), and report the results in equation form. Does “ability” help to explainvariations in education, even after controlling for parents’ education? Explain.

(iv) (Requires calculus) Now estimate an equation where abil appears in quadratic form:

 Use the data in HTV.RAW to answer this question. The data set includes information on wages, education, parents’ education, and several other variables for 1,230 working men in 1991. (i) What is the range of the <i>educ </i>variable in the sample? What percentage of men completed 12th grade but no higher grade? Do the men or their parents have, on average, higher levels of education? (ii) Estimate the regression model <i>   </i> by OLS and report the results in the usual form. How much sample variation in <i>educ </i>is explained by parents’ education? Interpret the coefficient on <i>motheduc</i>. (iii) Add the variable <i>abil </i>(a measure of cognitive ability) to the regression from part (ii), and report the results in equation form. Does “ability” help to explainvariations in education, even after controlling for parents’ education? Explain. (iv) (Requires calculus) Now estimate an equation where <i>abil </i>appears in quadratic form: <i>   </i> Using the estimates <i>   </i>use calculus to find the value of <i>abil</i>, call it <i>abil</i><sup>*</sup>, where <i>educ </i>is minimized. (The other coefficients and values of parents’ education variables have no effect; we are holding parents’ education fixed.) Notice that <i>abil</i> is measured so that negative values are permissible. You might also verify that the second derivative is positive so that you do indeed have a minimum. (v) Argue that only a small fraction of men in the sample have “ability” less than the value calculated in part (iv). Why is this important? (vi) If you have access to a statistical program that includes graphing capabilities, use the estimates in part (iv) to graph the relationship beween the predicted education and <i>abil</i>. Let <i>motheduc </i>and <i>fatheduc </i>have their average values in the sample, 12.18 and 12.45, respectively.

Using the estimates  Use the data in HTV.RAW to answer this question. The data set includes information on wages, education, parents’ education, and several other variables for 1,230 working men in 1991. (i) What is the range of the <i>educ </i>variable in the sample? What percentage of men completed 12th grade but no higher grade? Do the men or their parents have, on average, higher levels of education? (ii) Estimate the regression model <i>   </i> by OLS and report the results in the usual form. How much sample variation in <i>educ </i>is explained by parents’ education? Interpret the coefficient on <i>motheduc</i>. (iii) Add the variable <i>abil </i>(a measure of cognitive ability) to the regression from part (ii), and report the results in equation form. Does “ability” help to explainvariations in education, even after controlling for parents’ education? Explain. (iv) (Requires calculus) Now estimate an equation where <i>abil </i>appears in quadratic form: <i>   </i> Using the estimates <i>   </i>use calculus to find the value of <i>abil</i>, call it <i>abil</i><sup>*</sup>, where <i>educ </i>is minimized. (The other coefficients and values of parents’ education variables have no effect; we are holding parents’ education fixed.) Notice that <i>abil</i> is measured so that negative values are permissible. You might also verify that the second derivative is positive so that you do indeed have a minimum. (v) Argue that only a small fraction of men in the sample have “ability” less than the value calculated in part (iv). Why is this important? (vi) If you have access to a statistical program that includes graphing capabilities, use the estimates in part (iv) to graph the relationship beween the predicted education and <i>abil</i>. Let <i>motheduc </i>and <i>fatheduc </i>have their average values in the sample, 12.18 and 12.45, respectively. use calculus to find the value of abil, call it abil*, where educ is minimized. (The other coefficients and values of parents’ education variables have no effect; we are holding parents’ education fixed.) Notice that abil is measured so that negative values are permissible. You might also verify that the second derivative is positive so that you do indeed have a minimum.

(v) Argue that only a small fraction of men in the sample have “ability” less than the value calculated in part (iv). Why is this important?

(vi) If you have access to a statistical program that includes graphing capabilities, use the estimates in part (iv) to graph the relationship beween the predicted education and abil. Let motheduc and fatheduc have their average values in the sample, 12.18 and 12.45, respectively.

Step-by-step solution
Verified
like image
like image

Step 1 of 9

(i)

The range of the     <div class=answer> (i) The range of the   variable is given by the difference between the maximum and minimum value of   The maximum value of   is 20 and the minimum value of   is 6 Hence, the range of   is 14 As given there are 1230 working men in 1991 Since, the variable   is the measure of highest grade completed by 1991 So, in order to find the percentage of men completed 12<sup>th</sup> grade but no higher grade, apply the filter   in the dataset to get the count of the men with highest grade being 12<sup>th</sup> grade and express it as the percentage of total men in the sample It has been observed that there are 698 men with the highest grade being 12<sup>th</sup> grade. Hence, 56.7479% of total men completed 12<sup>th</sup> grade but no higher grade The average level of education of all 1230 men is 13.048 This is given by:   Whereas, the averaged level of education of the parents of 1230 men in the sample is given by:   Hence, the men have higher levels of education on an average variable is given by the difference between the maximum and minimum value of    <div class=answer> (i) The range of the   variable is given by the difference between the maximum and minimum value of   The maximum value of   is 20 and the minimum value of   is 6 Hence, the range of   is 14 As given there are 1230 working men in 1991 Since, the variable   is the measure of highest grade completed by 1991 So, in order to find the percentage of men completed 12<sup>th</sup> grade but no higher grade, apply the filter   in the dataset to get the count of the men with highest grade being 12<sup>th</sup> grade and express it as the percentage of total men in the sample It has been observed that there are 698 men with the highest grade being 12<sup>th</sup> grade. Hence, 56.7479% of total men completed 12<sup>th</sup> grade but no higher grade The average level of education of all 1230 men is 13.048 This is given by:   Whereas, the averaged level of education of the parents of 1230 men in the sample is given by:   Hence, the men have higher levels of education on an average

The maximum value of    <div class=answer> (i) The range of the   variable is given by the difference between the maximum and minimum value of   The maximum value of   is 20 and the minimum value of   is 6 Hence, the range of   is 14 As given there are 1230 working men in 1991 Since, the variable   is the measure of highest grade completed by 1991 So, in order to find the percentage of men completed 12<sup>th</sup> grade but no higher grade, apply the filter   in the dataset to get the count of the men with highest grade being 12<sup>th</sup> grade and express it as the percentage of total men in the sample It has been observed that there are 698 men with the highest grade being 12<sup>th</sup> grade. Hence, 56.7479% of total men completed 12<sup>th</sup> grade but no higher grade The average level of education of all 1230 men is 13.048 This is given by:   Whereas, the averaged level of education of the parents of 1230 men in the sample is given by:   Hence, the men have higher levels of education on an average is 20 and the minimum value of    <div class=answer> (i) The range of the   variable is given by the difference between the maximum and minimum value of   The maximum value of   is 20 and the minimum value of   is 6 Hence, the range of   is 14 As given there are 1230 working men in 1991 Since, the variable   is the measure of highest grade completed by 1991 So, in order to find the percentage of men completed 12<sup>th</sup> grade but no higher grade, apply the filter   in the dataset to get the count of the men with highest grade being 12<sup>th</sup> grade and express it as the percentage of total men in the sample It has been observed that there are 698 men with the highest grade being 12<sup>th</sup> grade. Hence, 56.7479% of total men completed 12<sup>th</sup> grade but no higher grade The average level of education of all 1230 men is 13.048 This is given by:   Whereas, the averaged level of education of the parents of 1230 men in the sample is given by:   Hence, the men have higher levels of education on an average is 6

Hence, the range of    <div class=answer> (i) The range of the   variable is given by the difference between the maximum and minimum value of   The maximum value of   is 20 and the minimum value of   is 6 Hence, the range of   is 14 As given there are 1230 working men in 1991 Since, the variable   is the measure of highest grade completed by 1991 So, in order to find the percentage of men completed 12<sup>th</sup> grade but no higher grade, apply the filter   in the dataset to get the count of the men with highest grade being 12<sup>th</sup> grade and express it as the percentage of total men in the sample It has been observed that there are 698 men with the highest grade being 12<sup>th</sup> grade. Hence, 56.7479% of total men completed 12<sup>th</sup> grade but no higher grade The average level of education of all 1230 men is 13.048 This is given by:   Whereas, the averaged level of education of the parents of 1230 men in the sample is given by:   Hence, the men have higher levels of education on an average is 14

As given there are 1230 working men in 1991

Since, the variable    <div class=answer> (i) The range of the   variable is given by the difference between the maximum and minimum value of   The maximum value of   is 20 and the minimum value of   is 6 Hence, the range of   is 14 As given there are 1230 working men in 1991 Since, the variable   is the measure of highest grade completed by 1991 So, in order to find the percentage of men completed 12<sup>th</sup> grade but no higher grade, apply the filter   in the dataset to get the count of the men with highest grade being 12<sup>th</sup> grade and express it as the percentage of total men in the sample It has been observed that there are 698 men with the highest grade being 12<sup>th</sup> grade. Hence, 56.7479% of total men completed 12<sup>th</sup> grade but no higher grade The average level of education of all 1230 men is 13.048 This is given by:   Whereas, the averaged level of education of the parents of 1230 men in the sample is given by:   Hence, the men have higher levels of education on an average is the measure of highest grade completed by 1991

So, in order to find the percentage of men completed 12th grade but no higher grade, apply the filter     <div class=answer> (i) The range of the   variable is given by the difference between the maximum and minimum value of   The maximum value of   is 20 and the minimum value of   is 6 Hence, the range of   is 14 As given there are 1230 working men in 1991 Since, the variable   is the measure of highest grade completed by 1991 So, in order to find the percentage of men completed 12<sup>th</sup> grade but no higher grade, apply the filter   in the dataset to get the count of the men with highest grade being 12<sup>th</sup> grade and express it as the percentage of total men in the sample It has been observed that there are 698 men with the highest grade being 12<sup>th</sup> grade. Hence, 56.7479% of total men completed 12<sup>th</sup> grade but no higher grade The average level of education of all 1230 men is 13.048 This is given by:   Whereas, the averaged level of education of the parents of 1230 men in the sample is given by:   Hence, the men have higher levels of education on an average in the dataset to get the count of the men with highest grade being 12th grade and express it as the percentage of total men in the sample

It has been observed that there are 698 men with the highest grade being 12th grade.

Hence, 56.7479% of total men completed 12th grade but no higher grade

The average level of education of all 1230 men is 13.048

This is given by:

    <div class=answer> (i) The range of the   variable is given by the difference between the maximum and minimum value of   The maximum value of   is 20 and the minimum value of   is 6 Hence, the range of   is 14 As given there are 1230 working men in 1991 Since, the variable   is the measure of highest grade completed by 1991 So, in order to find the percentage of men completed 12<sup>th</sup> grade but no higher grade, apply the filter   in the dataset to get the count of the men with highest grade being 12<sup>th</sup> grade and express it as the percentage of total men in the sample It has been observed that there are 698 men with the highest grade being 12<sup>th</sup> grade. Hence, 56.7479% of total men completed 12<sup>th</sup> grade but no higher grade The average level of education of all 1230 men is 13.048 This is given by:   Whereas, the averaged level of education of the parents of 1230 men in the sample is given by:   Hence, the men have higher levels of education on an average

Whereas, the averaged level of education of the parents of 1230 men in the sample is given by:

    <div class=answer> (i) The range of the   variable is given by the difference between the maximum and minimum value of   The maximum value of   is 20 and the minimum value of   is 6 Hence, the range of   is 14 As given there are 1230 working men in 1991 Since, the variable   is the measure of highest grade completed by 1991 So, in order to find the percentage of men completed 12<sup>th</sup> grade but no higher grade, apply the filter   in the dataset to get the count of the men with highest grade being 12<sup>th</sup> grade and express it as the percentage of total men in the sample It has been observed that there are 698 men with the highest grade being 12<sup>th</sup> grade. Hence, 56.7479% of total men completed 12<sup>th</sup> grade but no higher grade The average level of education of all 1230 men is 13.048 This is given by:   Whereas, the averaged level of education of the parents of 1230 men in the sample is given by:   Hence, the men have higher levels of education on an average

Hence, the men have higher levels of education on an average


Step 2 of 9


Step 3 of 9


Step 4 of 9


Step 5 of 9


Step 6 of 9


Step 7 of 9


Step 8 of 9


Step 9 of 9

close menu
Introductory Econometrics: A Modern Approach 6th Edition by Jeffrey M Wooldridge
cross icon