
Fundamentals of Cost Accounting 3rd Edition by William N. Lanen, Shannon W. Anderson, Michael Maher
Edition 3ISBN: 0073527114Fundamentals of Cost Accounting 3rd Edition by William N. Lanen, Shannon W. Anderson, Michael Maher
Edition 3ISBN: 0073527114Interpretation of Regression Results: Simple Regression
Your company provides a variety of delivery services. Management wants to know the volume of a particular delivery that would generate $10,000 per month in operating profits before taxes. The company charges $20 per delivery.
The controller’s office has estimated overhead costs at $9,000 per month for fixed costs and $12 per delivery for variable costs. You believe that the company should use regression analysis. Your analysis shows the results to be:
Monthly overhead = $26,501 + $10.70 per delivery
Your estimate was based on the following data:
Month | Overhead Costs | Number of Deliveries |
1 | $142,860 | 11,430 |
2 | 151,890 | 12,180 |
3 | 192,600 | 15,660 |
4 | 141,030 | 11,250 |
5 | 203,490 | 12,780 |
6 | 180,630 | 14,730 |
7 | 159,630 | 12,510 |
8 | 183,990 | 15,060 |
9 | 194,430 | 15,450 |
10 | 150,120 | 11,970 |
11 | 154,080 | 12,630 |
12 | 184,800 | 15,300 |
13 | 183,120 | 14,580 |
The company controller is somewhat surprised that the cost estimates are so different. You have been asked to recheck your work and see if you can figure out the difference between your results and the controller’s results.
Required
a. Analyze the data and your results and state your reasons for supporting or rejecting your cost equation.
b. Write a report that informs management about the correct volume that will generate $10,000 per month in operating profits before taxes.
Step 1 of 2
a.?The first step in understanding the difference is to prepare a scattergraph of the data:
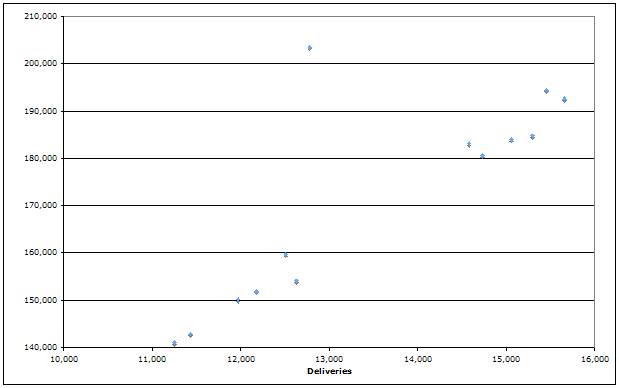
?Notice the one observation that appears to be unusual. (This is observation 5.) Without knowing more about the reasons for the high cost, we might want to treat it as an “outlier” meaning we would estimate the regression without this observation. The results of that regression are:
Regression Statistics | |
Multiple R | 0.9921 |
R Square | 0.9843 |
Adjusted R Square | 0.9827 |
Standard Error | 2635.7 |
Observations | 12 |
| Coefficients |
Intercept | $9776.56 |
Number of deliveries | $11.69 |
?These results are much closer to the controller’s estimates.
Step 2 of 2
Why don’t you like this exercise?
Other


