
Fundamentals of Cost Accounting 3rd Edition by William N. Lanen, Shannon W. Anderson, Michael Maher
Edition 3ISBN: 0073527114Fundamentals of Cost Accounting 3rd Edition by William N. Lanen, Shannon W. Anderson, Michael Maher
Edition 3ISBN: 0073527114Interpretation of Regression Results: Multiple Choice
The Business School at Eastern College is collecting data as a first step in the preparation of next year’s budget. One cost that is being looked at closely is administrative staff as a function of student credit hours. Data on administrative costs and credit hours for the most recent 13 months follow:
Month | Administrative Costs | Credit Hours |
July | $ 543,064 | 525 |
August | 346,975 | 242 |
September | 960,036 | 2,923 |
October | 908,855 | 2,100 |
November | 1,084,705 | 2,749 |
December | 774,686 | 2,335 |
January | 920,375 | 2,812 |
February | 1,029,000 | 2,883 |
March | 880,496 | 2,234 |
April | 806,085 | 2,358 |
May | 1,049,908 | 2,856 |
June | 715,756 | 882 |
July | 538,301 | 662 |
Total | $10,558,242 | 25,561 |
Average | $ 812,172 | 1,966 |
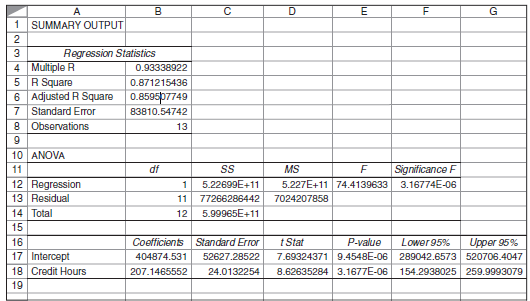
The controller’s office has analyzed the data and given you the results from the regression analysis:
Required
a. In the standard regression equation y = a + bx, the letter b is best described as the
(1) Independent variable.
(2) Dependent variable.
(3) Constant coefficient.
(4) Correlation coefficient.
(5) Variable cost coefficient.
b. In the standard regression equation y = a + bx, the letter y is best described as the
(1) Independent variable.
(2) Correlation coefficient.
(3) Constant coefficient.
(4) Variable cost coefficient.
(5) Dependent variable.
c. In the standard regression equation y = a + bx, the letter x is best described as the
(1) Independent variable.
(2) Dependent variable.
(3) Constant coefficient.
(4) Variable cost coefficient.
(5) Correlation coefficient.
d. If the controller uses the high-low method to estimate costs, the cost equation for administrative costs is (numbers are rounded to the nearest dollar)
(1) Cost = $291,637 + 229 × Credit hours.
(2) Cost = $233,571 + 101 × Credit hours.
(3) Cost = $229.50 × Credit hours.
(4) Cost = $404,874.
(5) Some other equation.
e. Based on the results of the controller’s regression analysis, the estimate of administrative costs in a month with 2,100 credit hours would be
(1) $834,993.
(2) $844,200.
(3) $404,917.
(4) $839,575.
(5) Some other amount.
f. The correlation coefficient (rounded) for the regression equation for administrative costs is
(1) 0.871.
(2) 0.933.
(3) 0.859.
(4) 
(5) Some other amount.
g. The percent of the total variance (rounded) that can be explained by the regression is
(1) 85.9.
(2) 87.1.
(3) 93.3.
(4) 96.6.
(5) Some other amount.
Step 1 of 19
a.
In the regression equation, the term b is not a constant value it changes. The value of b is not dependent on any other value. the value of b is neither a relation nor the Independent.
Step 2 of 19
Step 3 of 19
Step 4 of 19
Step 5 of 19
Step 6 of 19
Step 7 of 19
Step 8 of 19
Step 9 of 19
Step 10 of 19
Step 11 of 19
Step 12 of 19
Step 13 of 19
Step 14 of 19
Step 15 of 19
Step 16 of 19
Step 17 of 19
Step 18 of 19
Step 19 of 19
Why don’t you like this exercise?
Other


