
College Algebra in Context with Applications for the Managerial, Life, and Social Sciences 3rd Edition by Ronald J Harshbarger, Lisa Yocco
Edition 3ISBN: 032157060XCollege Algebra in Context with Applications for the Managerial, Life, and Social Sciences 3rd Edition by Ronald J Harshbarger, Lisa Yocco
Edition 3ISBN: 032157060X Exercise 54
Step-by-step solution Verified
Step 1 of 4
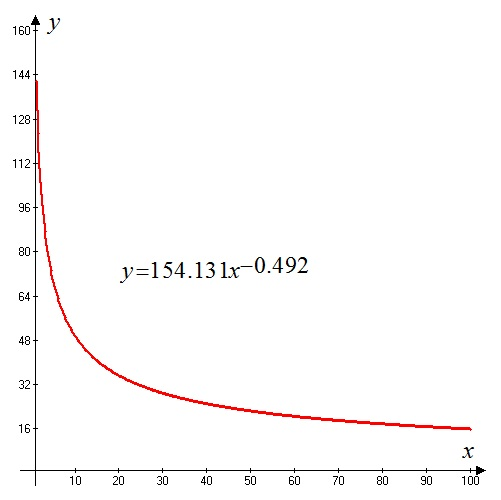
Consider the power model:

Where, denote the percent of people who say that they trust the government in
Washington always or most of the time and  denote the number of years after 1960
respectively.
(a)
Need to graph the function in the viewing window
Steps to plot the graph:
1. Set the window of the graph on
2. Sketch the graph of 
The graph of the function  in
in is shown below:
Step 2 of 4
Step 3 of 4
Step 4 of 4
College Algebra in Context with Applications for the Managerial, Life, and Social Sciences 3rd Edition by Ronald J Harshbarger, Lisa Yocco
Why don’t you like this exercise?
Other Minimum 8 character and maximum 255 character
Character 255


