
College Algebra in Context with Applications for the Managerial, Life, and Social Sciences 3rd Edition by Ronald J Harshbarger, Lisa Yocco
Edition 3ISBN: 032157060XCollege Algebra in Context with Applications for the Managerial, Life, and Social Sciences 3rd Edition by Ronald J Harshbarger, Lisa Yocco
Edition 3ISBN: 032157060X Exercise 51
Step-by-step solution Verified
Step 1 of 2
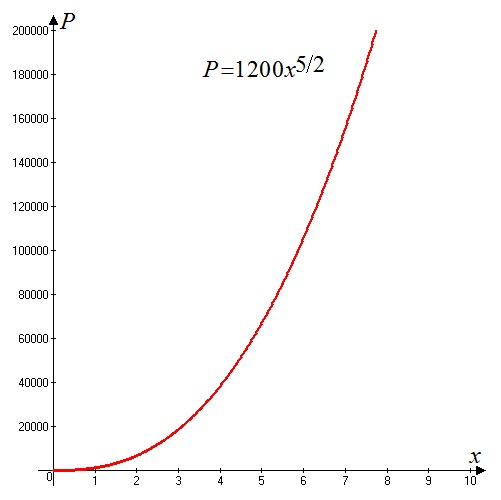
Consider the power model:

Where,  denote the monthly output of a product in units and
  denote the capital investment in thousands of dollars respectively
(a)
Need to plot the graph of  in the interval
 from
from and
and  from
from

Steps to plot the graph:
1. Set the window of the graph on
2. Sketch the graph of 
The graph of  is shown below:
Step 2 of 2
College Algebra in Context with Applications for the Managerial, Life, and Social Sciences 3rd Edition by Ronald J Harshbarger, Lisa Yocco
Why don’t you like this exercise?
Other Minimum 8 character and maximum 255 character
Character 255


