
College Algebra in Context with Applications for the Managerial, Life, and Social Sciences 3rd Edition by Ronald J Harshbarger, Lisa Yocco
Edition 3ISBN: 032157060XCollege Algebra in Context with Applications for the Managerial, Life, and Social Sciences 3rd Edition by Ronald J Harshbarger, Lisa Yocco
Edition 3ISBN: 032157060X Exercise 60
Step-by-step solution Verified
Step 1 of 7
(a)
Consider the table showing the years and the prices as the U.S consumer price index of dollars from 1985 to 2005
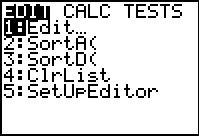
Press stat to view the statistics calculation options.
Press stat to view the statistics calculation options.
First press and select the
 option by pressing 1 from the displayed menu.
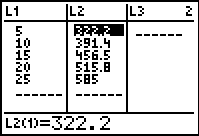
Next, enter the each y value in L1 followed by pressing the enter key and enter the corresponding x value in L2 followed by pressing the enter key.
The output will be displayed as shown:
Press 2nd graph to view the table
Step 2 of 7
Step 3 of 7
Step 4 of 7
Step 5 of 7
Step 6 of 7
Step 7 of 7
College Algebra in Context with Applications for the Managerial, Life, and Social Sciences 3rd Edition by Ronald J Harshbarger, Lisa Yocco
Why don’t you like this exercise?
Other Minimum 8 character and maximum 255 character
Character 255


