
College Algebra in Context with Applications for the Managerial, Life, and Social Sciences 3rd Edition by Ronald J Harshbarger, Lisa Yocco
Edition 3ISBN: 032157060XCollege Algebra in Context with Applications for the Managerial, Life, and Social Sciences 3rd Edition by Ronald J Harshbarger, Lisa Yocco
Edition 3ISBN: 032157060X Exercise 60
Step-by-step solution Verified
Step 1 of 4
Consider that the supply function and the demand function for a product are linear and are determined by the table that follows.
| Supply Price | Function Quantity | Demand Price | Function Quantity |
| 200 | 400 | 400 | 400 |
| 400 | 800 | 200 | 800 |
| 600 | 1200 | 0 | 1200 |
Let us create the supply and demand function and find the price that gives the market equilibrium.
First we create the supply function.
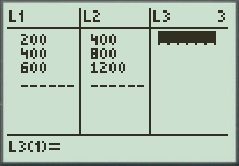
For this, enter the data of supply price and function quantity from the above table in the lists of a graphing utility.
The figure below shows a partial list of the data points.
The supply function, found using linear regression with a graphing calculator.
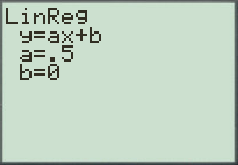
 Thus, the supply function is
 .
. Step 2 of 4
Step 3 of 4
Step 4 of 4
College Algebra in Context with Applications for the Managerial, Life, and Social Sciences 3rd Edition by Ronald J Harshbarger, Lisa Yocco
Why don’t you like this exercise?
Other Minimum 8 character and maximum 255 character
Character 255


