
College Algebra in Context with Applications for the Managerial, Life, and Social Sciences 3rd Edition by Ronald J Harshbarger, Lisa Yocco
Edition 3ISBN: 032157060XCollege Algebra in Context with Applications for the Managerial, Life, and Social Sciences 3rd Edition by Ronald J Harshbarger, Lisa Yocco
Edition 3ISBN: 032157060X Exercise 13
Step-by-step solution Verified
Step 1 of 5
Consider the table.
| Year x | 1996 | 1997 | 1998 | 1999 | 2000 | 2001 | 2003 |
| Percent y | 8.5 | 14.3 | 26.2 | 28.6 | 41.5 | 50.5 | 52.4 |
(a)
To find the linear model enter the data in graphing calculator as follows.
Use TI – 84 graphing calculator to find the linear regression curve.
Enter the table of values first.
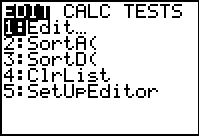
Step 1: First press and select the
 option by pressing 1 from the displayed menu.
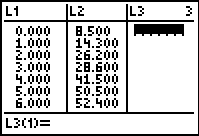
Next, enter the each t value in L1 followed by pressing the enter key and enter the corresponding  value in L2 followed by pressing the enter key.
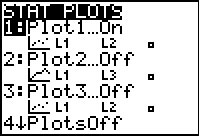
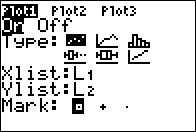
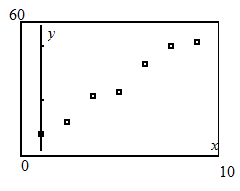
Press , then a STATPLOT screen will be displayed. Use the arrow keys and set the Plot 1 option on. Then press graph key. The output will be displayed as shown:
Step 2 of 5
Step 3 of 5
Step 4 of 5
Step 5 of 5
College Algebra in Context with Applications for the Managerial, Life, and Social Sciences 3rd Edition by Ronald J Harshbarger, Lisa Yocco
Why don’t you like this exercise?
Other Minimum 8 character and maximum 255 character
Character 255


