
College Algebra in Context with Applications for the Managerial, Life, and Social Sciences 3rd Edition by Ronald J Harshbarger, Lisa Yocco
Edition 3ISBN: 032157060XCollege Algebra in Context with Applications for the Managerial, Life, and Social Sciences 3rd Edition by Ronald J Harshbarger, Lisa Yocco
Edition 3ISBN: 032157060XStep 1 of 12
Consider the table. The table represents the prison time by multiplying the probabilities of being arrested.
| Year x | Expected prison time (days) y |
| 1970 | 10.1 |
| 1980 | 10.6 |
| 1985 | 13.2 |
| 1990 | 18.0 |
| 1992 | 18.5 |
| 1993 | 17.2 |
| 1994 | 19.5 |
| 1995 | 20.2 |
| 1996 | 21.7 |
(a)
Let represents the 1960,
  represents 1970and so on.
To find the linear model enter the data in graphing calculator as follows.
Use TI – 84 graphing calculator to find the linear regression curve.
Enter the table of values first.
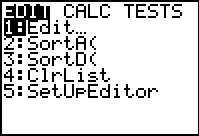
Step 1: First press and select the
 option by pressing 1 from the displayed menu.
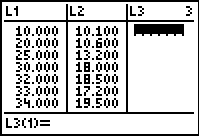
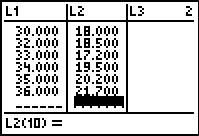
Next, enter the each value in L1 followed by pressing the enter key and enter the corresponding x value in L2 followed by pressing the enter key.
The output will be displayed as shown:
Step 2 of 12
Step 3 of 12
Step 4 of 12
Step 5 of 12
Step 6 of 12
Step 7 of 12
Step 8 of 12
Step 9 of 12
Step 10 of 12
Step 11 of 12
Step 12 of 12
Why don’t you like this exercise?
Other


