
College Algebra in Context with Applications for the Managerial, Life, and Social Sciences 3rd Edition by Ronald J Harshbarger, Lisa Yocco
Edition 3ISBN: 032157060XCollege Algebra in Context with Applications for the Managerial, Life, and Social Sciences 3rd Edition by Ronald J Harshbarger, Lisa Yocco
Edition 3ISBN: 032157060X Exercise 39
Step-by-step solution Verified
Step 1 of 5
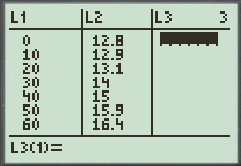
Convert the data from the chart into the table as follows:
| Year | Years past 65 Men |
| 1950 | 12.8 |
| 1960 | 12.9 |
| 1970 | 13.1 |
| 1980 | 14 |
| 1990 | 15 |
| 2000 | 15.9 |
| 2010 | 16.4 |
| 2020 | 16.9 |
| 2030 | 17.5 |
(a) Let us find a linear function that models the data, with x equal to the number of years after 1950 and y equal to the number of years the average 65-year-old man is estimated to live beyond age 65.
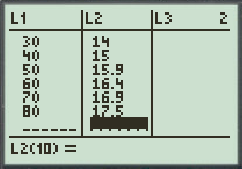
Enter the data from the above table in the lists of a graphing utility.
The figure below shows a partial list of the data points.
The equation that fits the data, found using linear regression with a graphing calculator.
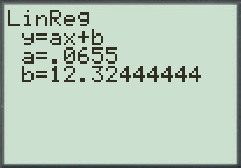
 that models the data, rounded to three decimals is
 .
. Step 2 of 5
Step 3 of 5
Step 4 of 5
Step 5 of 5
College Algebra in Context with Applications for the Managerial, Life, and Social Sciences 3rd Edition by Ronald J Harshbarger, Lisa Yocco
Why don’t you like this exercise?
Other Minimum 8 character and maximum 255 character
Character 255


