
Introduction to Epidemiology 6th Edition by Ray M Merrill
Edition 6ISBN: 1449645186Introduction to Epidemiology 6th Edition by Ray M Merrill
Edition 6ISBN: 1449645186What are the time factors and implications for this case? Explain the time lag from attacks in Figure 1 to deaths in Figure 2.
Figure 1 The dates and numbers of attacks of cholera in the Broad Street pump cholera epidemic, London.
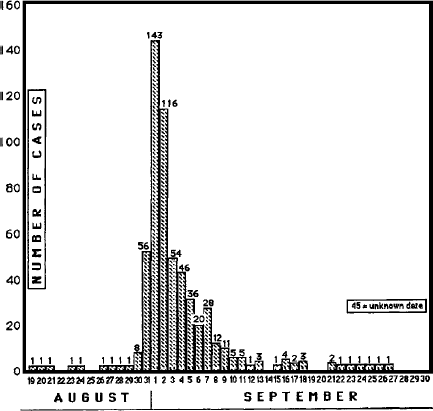
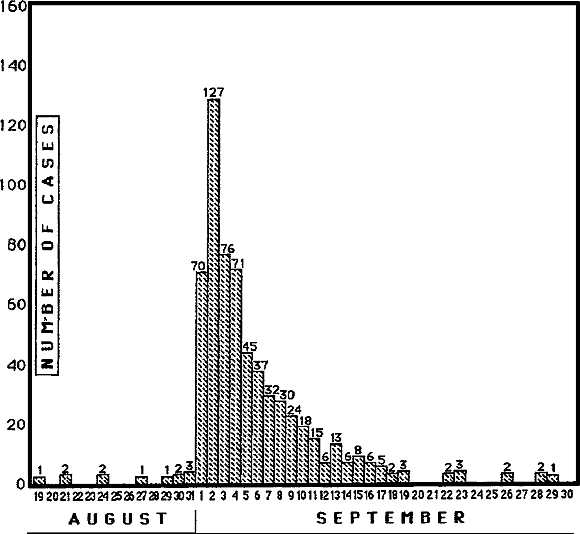
Figure 2 The dates and numbers of deaths from cholera in the Broad Street pump cholera epidemic, London.
Step 1 of 3
Cholera causes thousands of deaths per year and affects millions of people, worldwide. Most dreadful outbreak of this disease occurred in Broad Street, Golden Square. Its adjoining areas were also affected. People who drank water from the pump located at Broad Street were attacked by the disease, followed by their deaths.
Some people who resided in the nearby but safe regions were also affected. This was due to fact, that they were consuming contaminated water unknowingly. For example, three of the children, inhabitants of different region, consumed water in Broad Street during their school hours. Cafes located at Broad Street served contaminated water to their customers. One of such cafe even admitted death of its 9 customers after serving them with sherbet (effervescing drink). Similarly, a lady residing in safe area had the habit of drinking water which was transported from Broad Street.
Step 2 of 3
A violent outbreak of cholera that has never been occurred in history of mankind occurred in Broad Street of Golden Square. 500 people were attacked by cholera in 10 days. The outbreak took place between 31st August and 1st September. Number of deaths registered during that week was 89. Out of these, 6 deaths occurred in first four days, 4 were reported on 31stAugust, and the remaining on 1st and 2nd September.
On the following day, flocculent particles were observed in the water of pump, frequently used by deceased persons. After this observation was made, removal of the pump was requested and the action was implemented on 8th of September. On this day only 12 attacks were reported, 11 and 5 deaths were reported on the successive 4 days.
Step 3 of 3
It is clear from the given figure that after the removal of pump at Broad Street that is on 8th September number of attacks reduced on each successive days. This indicates that pump was contaminated with organic material that contained inoculums of cholera causing bacteria. Before 31st August, organic matter was present only in small quantities.
On 1st September, the bacterial inoculums proliferated, hence the chances of getting disease also increased. The number of attacks suddenly increased on 2nd September. On subsequent days, number of attacks decreased because of consumption of whole organic matter by bacteria. This was the reason that water appeared clear at the end of September but still rare attacks occurred.
Why don’t you like this exercise?
Other


