
Accounting: What the Numbers Mean 9th Edition by Wayne W McManus, Daniel F Viele, David H Marshall
Edition 9ISBN: 0073527068Accounting: What the Numbers Mean 9th Edition by Wayne W McManus, Daniel F Viele, David H Marshall
Edition 9ISBN: 0073527068Break-even analysis, CVP application using Internet tools You have recently been engaged by Dominic’s Italian Cafe to evaluate the financial impact of adding gourmet pizza items to the menu. A survey of the clientele indicates that demand for the product exists at an average selling price of $18 per pizza. Fixed costs related to new equipment would be $12,000 per month. Variable costs for ingredients,labor, and electricity for the oven would average $6 per pizza. You decide that a good starting point is to conduct an initial break-even analysis on the new project.
Knowing that many commercial Internet companies provide free downloads or online demos of their products for your evaluation and testing pleasure, you decide to conduct the break-even analysis using break-even calculators that have been located at several Web sites.
Required:
a.Calculate the break-even point in pizzas per month and print your results using the online break-even analysis tools at each of the following Web sites:
1. www.entrepreneur.com/calculators/breakeven.html
2. www.steinermarketing.com/calc_break_even.htm
3. www.anz.com/aus/Small-Business/Tools-Forms-And-Guides/Benchmark- Your-Business/Breakeven-Analyser/default.asp
b. Calculate the break-even point in pizzas per month and print your results using the break-even chart analysis spreadsheet available at the following Web site:
1. Go to www.jaxworks.com, the Small Business Spreadsheet Factory.
2. Click on the “Downloads” link to access the list of free spreadsheets and other files.
3. Scroll down the file list and open the file “Breakeven Simple Chart Analysis” for Excel.
c. Write a comparative analysis of each of the four tools that you used to calculate the break-even point. You might discuss strengths, weaknesses, usefulness, and user interaction for each tool.
d. Dominic’s now is interested in the amount of operating income available from the gourmet pizza operation if sales are initially expected to be 2,000 pizzas each month. Calculate the operating income and print your results using the Excel file “Contribution Income Analysis” available at www.jaxworks.com.
e. Dominic’s now would like to understand the effect on operating income if certain changes in costs or volume occur. Use the “Contribution Income Analysis” Excel spreadsheet to evaluate each of the following independent cases assuming sales are initially expected to be 2,000 pizzas each month:
1. Selling price is decreased by 10%, and pizza sales are expected to increase by 5%.
2. Selling price is increased to $20, and pizza sales are expected to decrease by 20%.
3. Higher-quality ingredients are used at a cost increase of $2 to $8 per pizza, and pizza sales are expected to increase to 2,200 pizzas per month.
4. A more efficient pizza oven is available that would reduce the electricity used in baking each pizza. Variable costs would be reduced to $5 per pizza. The more efficient oven would increase the fixed costs to $15,000 per month.
f. Write a memo to Dominic’s explaining the results of your analysis.
Step 1 of 6
| Note to instructor: The purpose of this case is to illustrate some of the problem solving tools available over the Internet for certain applications like breakeven analysis. At the time we were preparing this 9th Edition of What the Numbers Mean, several examples were available on web sites as identified in the problem requirements below. Our hope is that these illustrative tools will remain available for use by your students but we certainly do not control their availability as time marches on. This solution will use screen captures of the tools as they existed in June 2009. | ||
|
| ||
| Step 1: Calculate the contribution margin for Dominic's Italian Cafe: | ||
|
| Per Unit | Percentage |
| Sales | $ 18 | 100% |
| Variable expenses | 6 | 33% |
| Contribution margin | $ 12 | 67% |
|
|
|
|
| Step 2: Calculate the breakeven point: |
|
|
| Breakeven point = Fixed costs / contribution margin | ||
| Breakeven point = $12,000 / 12 = 1,000 units | ||
|
| ||
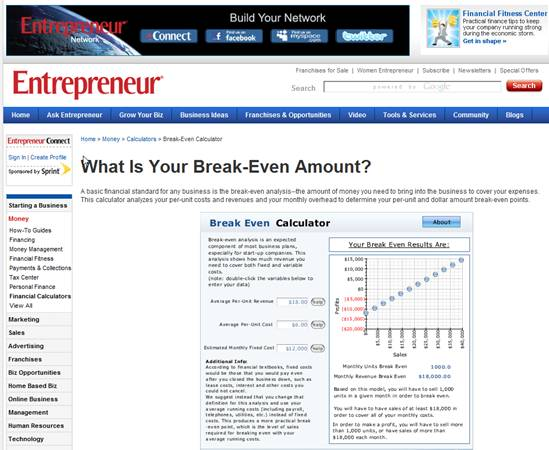
a. | 1. The following solution screen is from the entrepreneur.com site: | ||
|
| ||
|
| ||
|
| ||
|
| ||
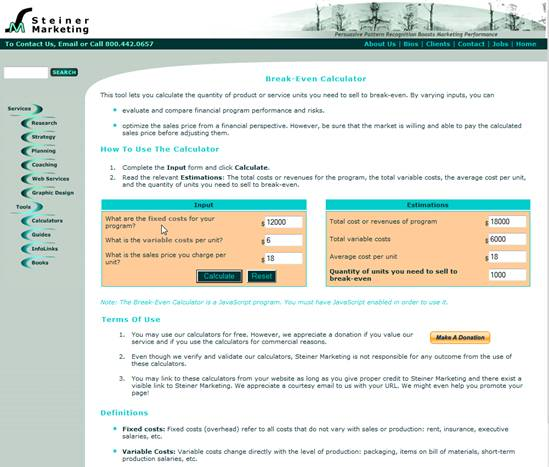
| 2. The following solution screen is from the steinermarketing.com site: | ||
|
| ||
|
| ||
|
| ||
|
|
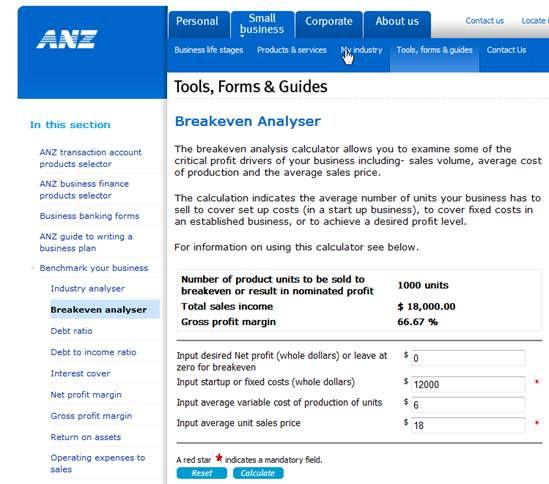
| 3. The following solution screen is from the anz.com site: |
|
|
|
|
|
Step 2 of 6
Step 3 of 6
Step 4 of 6
Step 5 of 6
Step 6 of 6
Why don’t you like this exercise?
Other


