
Cornerstones of Cost Management 2nd Edition by Don Hansen ,Maryanne Mowen
Edition 2ISBN: 978-1111824402Cornerstones of Cost Management 2nd Edition by Don Hansen ,Maryanne Mowen
Edition 2ISBN: 978-1111824402 Exercise 23
Scatterplot, High-Low Method, Regression
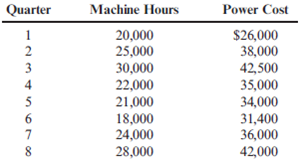
The management of Wheeler Company has decided to develop cost formulas for its major overhead activities. Wheeler uses a highly automated manufacturing process, and power costs are a significant manufacturing cost. Cost analysts have decided that power costs are mixed; thus, they must be broken into their fixed and variable elements so that the cost behavior of the power usage activity can be properly described. Machine hours have been selected as the activity driver for power costs. The following data for the past eight quarters have been collected:
Required:
1. Prepare a scattergraph by plotting power costs against machine hours. Does the scatter- graph show a linear relationship between machine hours and power cost?
2. Using the high and low points, compute a power cost formula.
3. Use the method of least squares to compute a power cost formula. Evaluate the coefficient of determination.
4. Rerun the regression and drop the point (20,000; $26,000) as an outlier. Compare the results from this regression to those for the regression in Requirement 3. Which is better?
Explanation Verified
Cornerstones of Cost Management 2nd Edition by Don Hansen ,Maryanne Mowen
Why don’t you like this exercise?
Other Minimum 8 character and maximum 255 character
Character 255


