Deck 14: Logistic Regression
Full screen (f)
Question
Myopia (i.e. ,nearsightedness)is a result of environmental and genetic factors.In Singapore,the percent of military personnel having myopia increased dramatically over a 20-year period.Based on this fact,researchers wondered if the effect of the environment might be stronger and the genetic effect much less pronounced than previously thought.To study this issue,data from a random sample of 429 men,ages nineteen to twenty-five,in the Singapore military were obtained.Among other things,the men in the study were classified as to whether or not they had myopia and whether at least one of their parents had myopia.The results are presented in the table below.  Let x be the indicator variable
  We wish to fit a logistic regression model,
  ,where p is the binomial probability that a man in the Singapore military has myopia and log is the natural logarithm. What is the odds ratio?
A)0.57
B)1.75
C)5.53
D)9.70
Let x be the indicator variable We wish to fit a logistic regression model, ,where p is the binomial probability that a man in the Singapore military has myopia and log is the natural logarithm. What is the odds ratio?A)0.57
B)1.75
C)5.53
D)9.70
Question
Do women and men treat female and male children differently? An observational study was conducted near the primate exhibit at the Sacramento Zoo on weekends in 1988.The data are from 37 groups of three-one adult female,one adult male,and one toddler-in which the toddler was being carried.Recorded in the table below are the gender of the adult who was carrying the toddler and the gender of the toddler:  What proportion of the male adults was carrying a girl?
A)0.46
B)0.50
C)0.68
D)0.74
What proportion of the male adults was carrying a girl?A)0.46
B)0.50
C)0.68
D)0.74
Question
Question
Myopia (i.e. ,nearsightedness)is a result of environmental and genetic factors.In Singapore,the percent of military personnel having myopia increased dramatically over a 20-year period.Based on this fact,researchers wondered if the effect of the environment might be stronger and the genetic effect much less pronounced than previously thought.To study this issue,data from a random sample of 429 men,ages nineteen to twenty-five,in the Singapore military were obtained.Among other things,the men in the study were classified as to whether or not they had myopia and whether at least one of their parents had myopia.The results are presented in the table below.  Of those men with myopia,what proportion had at least one parent with myopia?
A)0.410
B)0.590
C)0.881
D)0.907
Of those men with myopia,what proportion had at least one parent with myopia?A)0.410
B)0.590
C)0.881
D)0.907
Question
Question
Question
Question
Do women and men treat female and male children differently? An observational study was conducted near the primate exhibit at the Sacramento Zoo on weekends in 1988.The data are from 37 groups of three-one adult female,one adult male,and one toddler-in which the toddler was being carried.Recorded in the table below are the gender of the adult who was carrying the toddler and the gender of the toddler:  What are the odds that a female adult was carrying a girl?
A)0.35
B)0.50
C)1.00
D)2.13
What are the odds that a female adult was carrying a girl?A)0.35
B)0.50
C)1.00
D)2.13
Question
Question
Which of the following statements about logistic regression is/are TRUE?
A)The variable we are trying to model is categorical and has only two possible values (i.e. ,success or failure).
B)The explanatory variables can be either categorical or quantitative.
C)Logistic regression makes use of the odds of the binomial outcome success, .
.
D)The statistical model is given by .
.
E)All of the above are true.
A)The variable we are trying to model is categorical and has only two possible values (i.e. ,success or failure).
B)The explanatory variables can be either categorical or quantitative.
C)Logistic regression makes use of the odds of the binomial outcome success,
.D)The statistical model is given by
.E)All of the above are true.
Question
Myopia (i.e. ,nearsightedness)is a result of environmental and genetic factors.In Singapore,the percent of military personnel having myopia increased dramatically over a 20-year period.Based on this fact,researchers wondered if the effect of the environment might be stronger and the genetic effect much less pronounced than previously thought.To study this issue,data from a random sample of 429 men,ages nineteen to twenty-five,in the Singapore military were obtained.Among other things,the men in the study were classified as to whether or not they had myopia and whether at least one of their parents had myopia.The results are presented in the table below.  What are the odds that a man with at least one parent with myopia also has myopia? (Note: Use three significant digits for the calculation. )
A)0.590
B)0.907
C)1.439
D)9.753
What are the odds that a man with at least one parent with myopia also has myopia? (Note: Use three significant digits for the calculation. )A)0.590
B)0.907
C)1.439
D)9.753
Question
Question
Do women and men treat female and male children differently? An observational study was conducted near the primate exhibit at the Sacramento Zoo on weekends in 1988.The data are from 37 groups of three-one adult female,one adult male,and one toddler-in which the toddler was being carried.Recorded in the table below are the gender of the adult who was carrying the toddler and the gender of the toddler:  What are the odds that an adult carrying a girl was female?
A)0.35
B)0.50
C)1.00
D)2.13
What are the odds that an adult carrying a girl was female?A)0.35
B)0.50
C)1.00
D)2.13
Question
Question
Babies who are born prematurely are susceptible to the development of a lung condition known as bronchopulmonary dysplasia (BPD).A sample of babies who weighed less than 1750 grams at birth,and who required intubation during the first few hours of life,was followed to determine the probability that the child develops BPD later in life.To model the probability that a child develops BPD as a function of the baby's birth weight x,a logistic regression was fitted.The fitted equation was found to be  = 4.0343 - 0.0042x. From this equation,what would be the estimated probability that a child who weighed 1100 grams at birth develops BPD?
A)0.009
B)0.557
C)0.499
D)0.358
E)Not within ± 0.01 of any of the above
= 4.0343 - 0.0042x. From this equation,what would be the estimated probability that a child who weighed 1100 grams at birth develops BPD?A)0.009
B)0.557
C)0.499
D)0.358
E)Not within ± 0.01 of any of the above
Question
Myopia (i.e. ,nearsightedness)is a result of environmental and genetic factors.In Singapore,the percent of military personnel having myopia increased dramatically over a 20-year period.Based on this fact,researchers wondered if the effect of the environment might be stronger and the genetic effect much less pronounced than previously thought.To study this issue,data from a random sample of 429 men,ages nineteen to twenty-five,in the Singapore military were obtained.Among other things,the men in the study were classified as to whether or not they had myopia and whether at least one of their parents had myopia.The results are presented in the table below.  What are the odds that a man with myopia has at least one parent with myopia?
A)0.590
B)0.907
C)1.439
D)9.696
What are the odds that a man with myopia has at least one parent with myopia?A)0.590
B)0.907
C)1.439
D)9.696
Question
Question
Myopia (i.e. ,nearsightedness)is a result of environmental and genetic factors.In Singapore,the percent of military personnel having myopia increased dramatically over a 20-year period .Based on this fact,researchers wondered if the effect of the environment might be stronger and the genetic effect much less pronounced than previously thought.To study this issue,data from a random sample of 429 men,ages nineteen to twenty-five,in the Singapore military were obtained.Among other things,the men in the study were classified as to whether or not they had myopia and whether at least one of their parents had myopia.The results are presented in the table below.  Let x be the indicator variable
  We wish to fit a logistic regression model,
  ,where p is the binomial probability that a man in the Singapore military has myopia and log is the natural logarithm. Based on the data in the table,what is the estimate b0 of 0?
A)0.561
B)1.711
C)2.272
D)5.536
Let x be the indicator variable We wish to fit a logistic regression model, ,where p is the binomial probability that a man in the Singapore military has myopia and log is the natural logarithm. Based on the data in the table,what is the estimate b0 of 0?A)0.561
B)1.711
C)2.272
D)5.536
Question
Myopia (i.e. ,nearsightedness)is a result of environmental and genetic factors.In Singapore,the percent of military personnel having myopia increased dramatically over a 20-year period.Based on this fact,researchers wondered if the effect of the environment might be stronger and the genetic effect much less pronounced than previously thought.To study this issue,data from a random sample of 429 men,ages nineteen to twenty-five,in the Singapore military were obtained.Among other things,the men in the study were classified as to whether or not they had myopia and whether at least one of their parents had myopia.The results are presented in the table below.  Let x be the indicator variable
  We wish to fit a logistic regression model,
  ,where p is the binomial probability that a man in the Singapore military has myopia and log is the natural logarithm. Based on the data in the table,what is the estimate b1 of 1?
A)0.561
B)1.711
C)2.272
D)5.536
Let x be the indicator variable We wish to fit a logistic regression model, ,where p is the binomial probability that a man in the Singapore military has myopia and log is the natural logarithm. Based on the data in the table,what is the estimate b1 of 1?A)0.561
B)1.711
C)2.272
D)5.536
Question
Question
Question
Question
Using logistic regression,you are going to test the null hypothesis  against the alternative hypothesis
  .Suppose b1 = .8 and the standard error is .2.What is the value of the chi-square test statistic?
A)2
B)4
C)16
D)None of the above
against the alternative hypothesis .Suppose b1 = .8 and the standard error is .2.What is the value of the chi-square test statistic?A)2
B)4
C)16
D)None of the above
Question
Question
Do women and men treat female and male children differently? An observational study was conducted near the primate exhibit at the Sacramento Zoo on weekends in 1988.The data are from 37 groups of three-one adult female,one adult male,and one toddler-in which the toddler was being carried.Recorded in the table below are the gender of the adult who was carrying the toddler and the gender of the toddler:  Let x be the indicator variable
  We wish to fit a logistic regression model,
 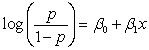 ,where p is the binomial probability that the toddler being carried is a girl and log is the natural logarithm.The following (partial)SPSS output is available. Variables in the Equation
  Based on the data in the table,what is the estimate b0 of 0?
A)0.000
B)0.577
C)0.754
D)1.000
Let x be the indicator variable We wish to fit a logistic regression model, ,where p is the binomial probability that the toddler being carried is a girl and log is the natural logarithm.The following (partial)SPSS output is available. Variables in the Equation Based on the data in the table,what is the estimate b0 of 0?A)0.000
B)0.577
C)0.754
D)1.000
Question
A study was undertaken to assess the quality of cheese as determined by a panel of taste testers.The tasters rated samples of cheese as being acceptable or not acceptable.Those same samples of cheese were analyzed with respect to several variables,one of which was the untransformed concentration of lactic acid,designated as Lactic.A logistic regression was fitted relating the log odds that the cheese was acceptable to the explanatory variable Lactic.The following partial computer output is provided. 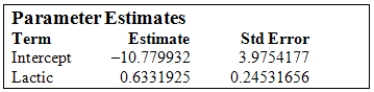 What is the approximate 90% confidence interval estimate for the true slope of the logistic regression model?
A)(0.152,1.014)
B)(1.259,2.821)
C)(-0.222,3.982)
D)(0.230,1.037)
E)This cannot be determined without knowing the degrees of freedom.
What is the approximate 90% confidence interval estimate for the true slope of the logistic regression model?A)(0.152,1.014)
B)(1.259,2.821)
C)(-0.222,3.982)
D)(0.230,1.037)
E)This cannot be determined without knowing the degrees of freedom.
Question
A study was undertaken to assess the quality of cheese as determined by a panel of taste testers.The tasters rated samples of cheese as being acceptable or not acceptable.Those same samples of cheese were analyzed with respect to several variables,one of which was the untransformed concentration of lactic acid,designated as Lactic.A logistic regression was fitted relating the log odds that the cheese was acceptable to the explanatory variable Lactic.The following partial computer output is provided.  What is the meaning of the entry 0.6332 in the above table under Estimate for the variable Lactic?
A)The odds ratio for the acceptability of the cheese is 1.88.
B)A one-unit increase in the variable Lactic results in a change in the odds that the cheese is acceptable by a factor of 0.6332.
C)The odds ratio for the acceptability of the cheese is 0.6332.
D)A one-unit increase in the variable Lactic results in a change in the odds that the cheese is acceptable by a factor of 1.88.
E)Both A and D are correct.
What is the meaning of the entry 0.6332 in the above table under Estimate for the variable Lactic?A)The odds ratio for the acceptability of the cheese is 1.88.
B)A one-unit increase in the variable Lactic results in a change in the odds that the cheese is acceptable by a factor of 0.6332.
C)The odds ratio for the acceptability of the cheese is 0.6332.
D)A one-unit increase in the variable Lactic results in a change in the odds that the cheese is acceptable by a factor of 1.88.
E)Both A and D are correct.
Question
Question
Do women and men treat female and male children differently? An observational study was conducted near the primate exhibit at the Sacramento Zoo on weekends in 1988.The data are from 37 groups of three-one adult female,one adult male,and one toddler-in which the toddler was being carried.Recorded in the table below are the gender of the adult who was carrying the toddler and the gender of the toddler:  Let x be the indicator variable
  We wish to fit a logistic regression model,
  ,where p is the binomial probability that the toddler being carried is a girl and log is the natural logarithm.The following (partial)SPSS output is available. Variables in the Equation
  What is a 90% confidence interval for the intercept 0?
A)0 ± 0.949
B)0 ± 1.131
C)0.754 ± 1.183
D)0.754 ± 1.409
Let x be the indicator variable We wish to fit a logistic regression model, ,where p is the binomial probability that the toddler being carried is a girl and log is the natural logarithm.The following (partial)SPSS output is available. Variables in the Equation What is a 90% confidence interval for the intercept 0?A)0 ± 0.949
B)0 ± 1.131
C)0.754 ± 1.183
D)0.754 ± 1.409
Question
What is the null hypothesis being tested when analyzing data using multiple logistic regression with three explanatory variables?
A)
B)
C)
D)None of the above
A)
B)
C)
D)None of the above
Question
Question
Question
Question
What is the alternative hypothesis being tested when analyzing data using multiple logistic regression with three explanatory variables?
A)
B)
C)
D)None of the above
A)
B)
C)
D)None of the above
Question
Question
Question
A study was undertaken to assess the quality of cheese as determined by a panel of taste testers.The tasters rated samples of cheese as being acceptable or not acceptable.Those same samples of cheese were analyzed with respect to several variables,one of which was the untransformed concentration of lactic acid,designated as Lactic.A logistic regression was fitted relating the log odds that the cheese was acceptable to the explanatory variable Lactic.The following partial computer output is provided.  A sample of cheese was analyzed and the variable Lactic was found to have the value 16.5.At this level of concentration of lactic acid,what are the odds that the cheese will be deemed to be acceptable?
A)2.80
B)-0.332
C)0.717
D)0.633
E)None of the above
A sample of cheese was analyzed and the variable Lactic was found to have the value 16.5.At this level of concentration of lactic acid,what are the odds that the cheese will be deemed to be acceptable?A)2.80
B)-0.332
C)0.717
D)0.633
E)None of the above
Question
Do women and men treat female and male children differently? An observational study was conducted near the primate exhibit at the Sacramento Zoo on weekends in 1988.The data are from 37 groups of three-one adult female,one adult male,and one toddler-in which the toddler was being carried.Recorded in the table below are the gender of the adult who was carrying the toddler and the gender of the toddler:  Let x be the indicator variable
  We wish to fit a logistic regression model,
  ,where p is the binomial probability that the toddler being carried is a girl and log is the natural logarithm.The following (partial)SPSS output is available. Variables in the Equation
  What is a 95% confidence interval for the odds ratio?
A)(0.323,3.099)
B)(0.387,2.583)
C)(0.519,8.697)
D)(0.651,6.938)
Let x be the indicator variable We wish to fit a logistic regression model, ,where p is the binomial probability that the toddler being carried is a girl and log is the natural logarithm.The following (partial)SPSS output is available. Variables in the Equation What is a 95% confidence interval for the odds ratio?A)(0.323,3.099)
B)(0.387,2.583)
C)(0.519,8.697)
D)(0.651,6.938)
Question
Do women and men treat female and male children differently? An observational study was conducted near the primate exhibit at the Sacramento Zoo on weekends in 1988.The data are from 37 groups of three-one adult female,one adult male,and one toddler-in which the toddler was being carried.Recorded in the table below are the gender of the adult who was carrying the toddler and the gender of the toddler:  Let x be the indicator variable
  We wish to fit a logistic regression model,
  ,where p is the binomial probability that the toddler being carried is a girl and log is the natural logarithm.The following (partial)SPSS output is available. Variables in the Equation
  What is the value of the X2 statistic for testing the hypotheses H0: 1 = 0 vs.Ha: 1 0?
A)0.295
B)1.00
C)1.049
D)1.100
Let x be the indicator variable We wish to fit a logistic regression model, ,where p is the binomial probability that the toddler being carried is a girl and log is the natural logarithm.The following (partial)SPSS output is available. Variables in the Equation What is the value of the X2 statistic for testing the hypotheses H0: 1 = 0 vs.Ha: 1 0?A)0.295
B)1.00
C)1.049
D)1.100
Question
A study was undertaken to assess the quality of cheese as determined by a panel of taste testers.The tasters rated samples of cheese as being acceptable or not acceptable.Those same samples of cheese were analyzed with respect to several variables,one of which was the untransformed concentration of lactic acid,designated as Lactic.A logistic regression was fitted relating the log odds that the cheese was acceptable to the explanatory variable Lactic.The following partial computer output is provided.  What is the value of the test statistic and the P-value for the test of the hypotheses H0:
  = 0 against Ha:
  0?
0?
A)z = -2.71;P-value = 0.0034
B)z = 2.58;P-value = 0.0049
C)z = 2.58;P-value = 0.0098
D)z = -2.71;P-value = 0.0068
E)z = 1.47;P-value = 0.1416
What is the value of the test statistic and the P-value for the test of the hypotheses H0: = 0 against Ha: 0?A)z = -2.71;P-value = 0.0034
B)z = 2.58;P-value = 0.0049
C)z = 2.58;P-value = 0.0098
D)z = -2.71;P-value = 0.0068
E)z = 1.47;P-value = 0.1416
Question
Question
Question
How do men and women compare on a trip to the grocery store? A certain grocery list with a variety of items on it was given to 90 people with a family (who are used to shopping for more than one person).The total bill should be about $250.Each of the 90 people was sent to their grocery store of choice and their bill was categorized as either paying too much or not paying too much (e.g. ,a bill of $250 or less).The results,by gender,are shown below. 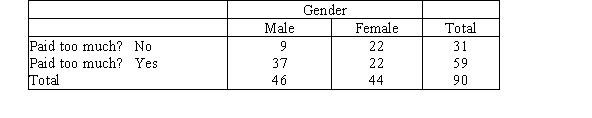 Let x be the indicator variable
  We wish to fit a logistic regression model,
  ,where p is the binomial probability that the person paid too much for the groceries on the list.
The following SPSS output is available.
Variables in the Equation What is the equation of the estimated log odds?
Let x be the indicator variable We wish to fit a logistic regression model, ,where p is the binomial probability that the person paid too much for the groceries on the list.The following SPSS output is available.
Variables in the Equation
What is the equation of the estimated log odds? Question
In a recent study,over 33,000 women were asked,"Did you have a mammogram within the last 2 years?" Despite the benefits of screening,about 30% of respondents indicated that they had not had a recent mammogram.The dependent/outcome variable was the proportion of women who reported a recent mammogram.In addition,the following information was collected on each individual: age (40-49,50-64,65-74,75-84),race/ethnicity (Latina,Non-Latina African American,Non-Latina Asian/Pacific Islander,Non-Latina White,and Non-Latina other race/ethnicity),marital status (married or living with partner vs.not currently married),history of breast cancer (yes vs.no),self-rated health (excellent,very good,good,fair,poor),currently with health insurance (yes vs.no),and having a usual source of care (yes vs.no).All variables were treated as categorical (e.g. ,coded as 1 or 0 for each category).A multiple logistic regression model was fitted to the data to predict the probability a woman had a recent mammogram.Software output from SAS is shown below.  What is the sample proportion of women who did have a mammogram within the last 2 years?
A)0.30
B)0.70
C)0.50
D)1
What is the sample proportion of women who did have a mammogram within the last 2 years?A)0.30
B)0.70
C)0.50
D)1
Question
In a recent study,over 33,000 women were asked,"Did you have a mammogram within the last 2 years?" Despite the benefits of screening,about 30% of respondents indicated that they had not had a recent mammogram.The dependent/outcome variable was the proportion of women who reported a recent mammogram.In addition,the following information was collected on each individual: age (40-49,50-64,65-74,75-84),race/ethnicity (Latina,Non-Latina African American,Non-Latina Asian/Pacific Islander,Non-Latina White,and Non-Latina other race/ethnicity),marital status (married or living with partner vs.not currently married),history of breast cancer (yes vs.no),self-rated health (excellent,very good,good,fair,poor),currently with health insurance (yes vs.no),and having a usual source of care (yes vs.no).All variables were treated as categorical (e.g. ,coded as 1 or 0 for each category).A multiple logistic regression model was fitted to the data to predict the probability a woman had a recent mammogram.Software output from SAS is shown below.  What is the equation for the estimated odds that a fifty-year-old,single,black woman who has no history of breast cancer and is in good health had a recent mammogram?
A)Log(odds)= 0.28 Age + 0.22 Race + 0 Marital + 0 History + 0.17 Health
B)Log(odds)= -0.55 Age + 0.11 Race + 0.21 Marital + 0.41 History + 0.14 Health
C)Log (odds)= 0 Age + 0 Race + 0 Marital + 0 History + 0.17 Health
D)None of the above
What is the equation for the estimated odds that a fifty-year-old,single,black woman who has no history of breast cancer and is in good health had a recent mammogram?A)Log(odds)= 0.28 Age + 0.22 Race + 0 Marital + 0 History + 0.17 Health
B)Log(odds)= -0.55 Age + 0.11 Race + 0.21 Marital + 0.41 History + 0.14 Health
C)Log (odds)= 0 Age + 0 Race + 0 Marital + 0 History + 0.17 Health
D)None of the above
Question
In a recent study,over 33,000 women were asked,"Did you have a mammogram within the last 2 years?" Despite the benefits of screening,about 30% of respondents indicated that they had not had a recent mammogram.The dependent/outcome variable was the proportion of women who reported a recent mammogram.In addition,the following information was collected on each individual: age (40-49,50-64,65-74,75-84),race/ethnicity (Latina,Non-Latina African American,Non-Latina Asian/Pacific Islander,Non-Latina White,and Non-Latina other race/ethnicity),marital status (married or living with partner vs.not currently married),history of breast cancer (yes vs.no),self-rated health (excellent,very good,good,fair,poor),currently with health insurance (yes vs.no),and having a usual source of care (yes vs.no).All variables were treated as categorical (e.g. ,coded as 1 or 0 for each category).A multiple logistic regression model was fitted to the data to predict the probability a woman had a recent mammogram.Software output from SAS is shown below.  What is the equation for the estimated odds that a forty-year-old,married,Latina woman who has a history of breast cancer and is in excellent health had a recent mammogram?
A)Log(odds)= 0.28 Age + 0.22 Race + 0 Marital + 0 History + 0.17 Health
B)Log(odds)= -0.55 Age + 0.11 Race + 0.21 Marital + 0.41 History + 0.14 Health
C)Log (odds)= 0 Age + 0 Race + 0 Marital + 0 History + 0.17 Health
D)None of the above
What is the equation for the estimated odds that a forty-year-old,married,Latina woman who has a history of breast cancer and is in excellent health had a recent mammogram?A)Log(odds)= 0.28 Age + 0.22 Race + 0 Marital + 0 History + 0.17 Health
B)Log(odds)= -0.55 Age + 0.11 Race + 0.21 Marital + 0.41 History + 0.14 Health
C)Log (odds)= 0 Age + 0 Race + 0 Marital + 0 History + 0.17 Health
D)None of the above
Question
In a recent study,over 33,000 women were asked,"Did you have a mammogram within the last 2 years?" Despite the benefits of screening,about 30% of respondents indicated that they had not had a recent mammogram.The dependent/outcome variable was the proportion of women who reported a recent mammogram.In addition,the following information was collected on each individual: age (40-49,50-64,65-74,75-84),race/ethnicity (Latina,Non-Latina African American,Non-Latina Asian/Pacific Islander,Non-Latina White,and Non-Latina other race/ethnicity),marital status (married or living with partner vs.not currently married),history of breast cancer (yes vs.no),self-rated health (excellent,very good,good,fair,poor),currently with health insurance (yes vs.no),and having a usual source of care (yes vs.no).All variables were treated as categorical (e.g. ,coded as 1 or 0 for each category).A multiple logistic regression model was fitted to the data to predict the probability a woman had a recent mammogram.Software output from SAS is shown below. 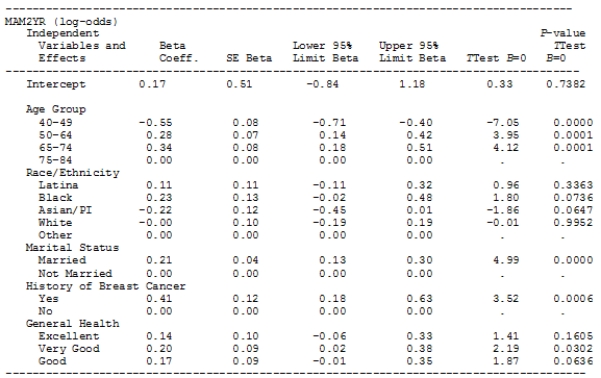 Is age a significant predictor of having had a recent mammogram? (Assume = 0.05. )
A)Yes
B)No
Is age a significant predictor of having had a recent mammogram? (Assume = 0.05. )A)Yes
B)No
Question
Question
In a recent study,over 33,000 women were asked,"Did you have a mammogram within the last 2 years?" Despite the benefits of screening,about 30% of respondents indicated that they had not had a recent mammogram.The dependent/outcome variable was the proportion of women who reported a recent mammogram.In addition,the following information was collected on each individual: age (40-49,50-64,65-74,75-84),race/ethnicity (Latina,Non-Latina African American,Non-Latina Asian/Pacific Islander,Non-Latina White,and Non-Latina other race/ethnicity),marital status (married or living with partner vs.not currently married),history of breast cancer (yes vs.no),self-rated health (excellent,very good,good,fair,poor),currently with health insurance (yes vs.no),and having a usual source of care (yes vs.no).All variables were treated as categorical (e.g. ,coded as 1 or 0 for each category).A multiple logistic regression model was fitted to the data to predict the probability a woman had a recent mammogram.Software output from SAS is shown below.  What category of general health is a significant predictor of having had a recent mammogram? (Assume = 0.05. )
A)Excellent
B)Very good
C)Good
D)None of the above
What category of general health is a significant predictor of having had a recent mammogram? (Assume = 0.05. )A)Excellent
B)Very good
C)Good
D)None of the above
Question
In a recent study,over 33,000 women were asked,"Did you have a mammogram within the last 2 years?" Despite the benefits of screening,about 30% of respondents indicated that they had not had a recent mammogram.The dependent/outcome variable was the proportion of women who reported a recent mammogram.In addition,the following information was collected on each individual: age (40-49,50-64,65-74,75-84),race/ethnicity (Latina,Non-Latina African American,Non-Latina Asian/Pacific Islander,Non-Latina White,and Non-Latina other race/ethnicity),marital status (married or living with partner vs.not currently married),history of breast cancer (yes vs.no),self-rated health (excellent,very good,good,fair,poor),currently with health insurance (yes vs.no),and having a usual source of care (yes vs.no).All variables were treated as categorical (e.g. ,coded as 1 or 0 for each category).A multiple logistic regression model was fitted to the data to predict the probability a woman had a recent mammogram.Software output from SAS is shown below.  What is the sample proportion of women who did not have a mammogram within the last 2 years?
A)0.30
B)0.70
C)0.50
D)1
What is the sample proportion of women who did not have a mammogram within the last 2 years?A)0.30
B)0.70
C)0.50
D)1
Question
In a recent study,over 33,000 women were asked,"Did you have a mammogram within the last 2 years?" Despite the benefits of screening,about 30% of respondents indicated that they had not had a recent mammogram.The dependent/outcome variable was the proportion of women who reported a recent mammogram.In addition,the following information was collected on each individual: age (40-49,50-64,65-74,75-84),race/ethnicity (Latina,Non-Latina African American,Non-Latina Asian/Pacific Islander,Non-Latina White,and Non-Latina other race/ethnicity),marital status (married or living with partner vs.not currently married),history of breast cancer (yes vs.no),self-rated health (excellent,very good,good,fair,poor),currently with health insurance (yes vs.no),and having a usual source of care (yes vs.no).All variables were treated as categorical (e.g. ,coded as 1 or 0 for each category).A multiple logistic regression model was fitted to the data to predict the probability a woman had a recent mammogram.Software output from SAS is shown below.  What are the odds that a woman did have a mammogram within the last 2 years?
A)2.33
B)0.428
C)0.3
D)0.7
What are the odds that a woman did have a mammogram within the last 2 years?A)2.33
B)0.428
C)0.3
D)0.7
Question
In a recent study,over 33,000 women were asked,"Did you have a mammogram within the last 2 years?" Despite the benefits of screening,about 30% of respondents indicated that they had not had a recent mammogram.The dependent/outcome variable was the proportion of women who reported a recent mammogram.In addition,the following information was collected on each individual: age (40-49,50-64,65-74,75-84),race/ethnicity (Latina,Non-Latina African American,Non-Latina Asian/Pacific Islander,Non-Latina White,and Non-Latina other race/ethnicity),marital status (married or living with partner vs.not currently married),history of breast cancer (yes vs.no),self-rated health (excellent,very good,good,fair,poor),currently with health insurance (yes vs.no),and having a usual source of care (yes vs.no).All variables were treated as categorical (e.g. ,coded as 1 or 0 for each category).A multiple logistic regression model was fitted to the data to predict the probability a woman had a recent mammogram.Software output from SAS is shown below.  What are the odds that a woman did not have a mammogram within the last 2 years?
A)2.33
B)0.428
C)0.3
D)0.7
What are the odds that a woman did not have a mammogram within the last 2 years?A)2.33
B)0.428
C)0.3
D)0.7
Question

Unlock Deck
Sign up to unlock the cards in this deck!
Unlock Deck
Unlock Deck
1/53
Play
Full screen (f)
Deck 14: Logistic Regression
1
Myopia (i.e. ,nearsightedness)is a result of environmental and genetic factors.In Singapore,the percent of military personnel having myopia increased dramatically over a 20-year period.Based on this fact,researchers wondered if the effect of the environment might be stronger and the genetic effect much less pronounced than previously thought.To study this issue,data from a random sample of 429 men,ages nineteen to twenty-five,in the Singapore military were obtained.Among other things,the men in the study were classified as to whether or not they had myopia and whether at least one of their parents had myopia.The results are presented in the table below. Let x be the indicator variable We wish to fit a logistic regression model, ,where p is the binomial probability that a man in the Singapore military has myopia and log is the natural logarithm. What is the odds ratio?
A)0.57
B)1.75
C)5.53
D)9.70
Let x be the indicator variable We wish to fit a logistic regression model, ,where p is the binomial probability that a man in the Singapore military has myopia and log is the natural logarithm. What is the odds ratio?A)0.57
B)1.75
C)5.53
D)9.70
1.75
2
Do women and men treat female and male children differently? An observational study was conducted near the primate exhibit at the Sacramento Zoo on weekends in 1988.The data are from 37 groups of three-one adult female,one adult male,and one toddler-in which the toddler was being carried.Recorded in the table below are the gender of the adult who was carrying the toddler and the gender of the toddler: What proportion of the male adults was carrying a girl?
A)0.46
B)0.50
C)0.68
D)0.74
What proportion of the male adults was carrying a girl?A)0.46
B)0.50
C)0.68
D)0.74
0.68
3
A student survey reveals that only 564 of 1200 students surveyed voted in the past student government elections.What are the log odds that a student voted in the past student elections?
A)-0.120
B)-0.052
C)0.47
D)0.887
A)-0.120
B)-0.052
C)0.47
D)0.887
-0.120
4
Myopia (i.e. ,nearsightedness)is a result of environmental and genetic factors.In Singapore,the percent of military personnel having myopia increased dramatically over a 20-year period.Based on this fact,researchers wondered if the effect of the environment might be stronger and the genetic effect much less pronounced than previously thought.To study this issue,data from a random sample of 429 men,ages nineteen to twenty-five,in the Singapore military were obtained.Among other things,the men in the study were classified as to whether or not they had myopia and whether at least one of their parents had myopia.The results are presented in the table below. Of those men with myopia,what proportion had at least one parent with myopia?
A)0.410
B)0.590
C)0.881
D)0.907
Of those men with myopia,what proportion had at least one parent with myopia?A)0.410
B)0.590
C)0.881
D)0.907
Unlock Deck
Unlock for access to all 53 flashcards in this deck.
Unlock Deck
k this deck
5
A variable that takes on the values of only 1 and 0 is often called a(n)_________ variable.
A)response
B)indicator
C)explanatory
D)categorical
A)response
B)indicator
C)explanatory
D)categorical
Unlock Deck
Unlock for access to all 53 flashcards in this deck.
Unlock Deck
k this deck
6
What function can undo the natural log transformation?
A)Multiplicative
B)Square root
C)Exponential
D)None of the above
A)Multiplicative
B)Square root
C)Exponential
D)None of the above
Unlock Deck
Unlock for access to all 53 flashcards in this deck.
Unlock Deck
k this deck
7
A student survey reveals that only 564 of 1200 students surveyed voted in the past student government elections.After closer inspection,it is discovered that 226 female students voted and 338 male students voted.Of the 1200 students participating in the survey,710 were female and 490 were male.What is the odds ratio of a male student voting in the past student elections to a female student voting in the past student elections?
A)0.21
B)0.94
C)1.06
D)4.76
A)0.21
B)0.94
C)1.06
D)4.76
Unlock Deck
Unlock for access to all 53 flashcards in this deck.
Unlock Deck
k this deck
8
Do women and men treat female and male children differently? An observational study was conducted near the primate exhibit at the Sacramento Zoo on weekends in 1988.The data are from 37 groups of three-one adult female,one adult male,and one toddler-in which the toddler was being carried.Recorded in the table below are the gender of the adult who was carrying the toddler and the gender of the toddler: What are the odds that a female adult was carrying a girl?
A)0.35
B)0.50
C)1.00
D)2.13
What are the odds that a female adult was carrying a girl?A)0.35
B)0.50
C)1.00
D)2.13
Unlock Deck
Unlock for access to all 53 flashcards in this deck.
Unlock Deck
k this deck
9
In logistic regression,the log of the odds is applied to which variable?
A)Response
B)Explanatory
C)Categorical
D)Indicator
A)Response
B)Explanatory
C)Categorical
D)Indicator
Unlock Deck
Unlock for access to all 53 flashcards in this deck.
Unlock Deck
k this deck
10
Which of the following statements about logistic regression is/are TRUE?
A)The variable we are trying to model is categorical and has only two possible values (i.e. ,success or failure).
B)The explanatory variables can be either categorical or quantitative.
C)Logistic regression makes use of the odds of the binomial outcome success, .
D)The statistical model is given by .
E)All of the above are true.
A)The variable we are trying to model is categorical and has only two possible values (i.e. ,success or failure).
B)The explanatory variables can be either categorical or quantitative.
C)Logistic regression makes use of the odds of the binomial outcome success,
.D)The statistical model is given by
.E)All of the above are true.
Unlock Deck
Unlock for access to all 53 flashcards in this deck.
Unlock Deck
k this deck
11
Myopia (i.e. ,nearsightedness)is a result of environmental and genetic factors.In Singapore,the percent of military personnel having myopia increased dramatically over a 20-year period.Based on this fact,researchers wondered if the effect of the environment might be stronger and the genetic effect much less pronounced than previously thought.To study this issue,data from a random sample of 429 men,ages nineteen to twenty-five,in the Singapore military were obtained.Among other things,the men in the study were classified as to whether or not they had myopia and whether at least one of their parents had myopia.The results are presented in the table below. What are the odds that a man with at least one parent with myopia also has myopia? (Note: Use three significant digits for the calculation. )
A)0.590
B)0.907
C)1.439
D)9.753
What are the odds that a man with at least one parent with myopia also has myopia? (Note: Use three significant digits for the calculation. )A)0.590
B)0.907
C)1.439
D)9.753
Unlock Deck
Unlock for access to all 53 flashcards in this deck.
Unlock Deck
k this deck
12
In a small college town,many apartments and student houses are claimed to be in good condition by their owners and landlords.A formal inspection of 350 of these student apartments and houses reveals that 212 of them do not pass the regulation guidelines.What are the odds that a student apartment or house does pass the regulation guidelines?
A)0.606
B)0.651
C)1.536
D)1.651
A)0.606
B)0.651
C)1.536
D)1.651
Unlock Deck
Unlock for access to all 53 flashcards in this deck.
Unlock Deck
k this deck
13
Do women and men treat female and male children differently? An observational study was conducted near the primate exhibit at the Sacramento Zoo on weekends in 1988.The data are from 37 groups of three-one adult female,one adult male,and one toddler-in which the toddler was being carried.Recorded in the table below are the gender of the adult who was carrying the toddler and the gender of the toddler: What are the odds that an adult carrying a girl was female?
A)0.35
B)0.50
C)1.00
D)2.13
What are the odds that an adult carrying a girl was female?A)0.35
B)0.50
C)1.00
D)2.13
Unlock Deck
Unlock for access to all 53 flashcards in this deck.
Unlock Deck
k this deck
14
In a simple random sample,320 stay-at-home mothers are interviewed.The questions are all about their hobbies outside of raising their children.The number of mothers in the sample who enjoy scrapbooking in their spare time is 223.What are the odds that a stay-at-home mother enjoys scrapbooking?
A)0.303
B)0.435
C)0.697
D)2.3
A)0.303
B)0.435
C)0.697
D)2.3
Unlock Deck
Unlock for access to all 53 flashcards in this deck.
Unlock Deck
k this deck
15
Babies who are born prematurely are susceptible to the development of a lung condition known as bronchopulmonary dysplasia (BPD).A sample of babies who weighed less than 1750 grams at birth,and who required intubation during the first few hours of life,was followed to determine the probability that the child develops BPD later in life.To model the probability that a child develops BPD as a function of the baby's birth weight x,a logistic regression was fitted.The fitted equation was found to be = 4.0343 - 0.0042x. From this equation,what would be the estimated probability that a child who weighed 1100 grams at birth develops BPD?
A)0.009
B)0.557
C)0.499
D)0.358
E)Not within ± 0.01 of any of the above
= 4.0343 - 0.0042x. From this equation,what would be the estimated probability that a child who weighed 1100 grams at birth develops BPD?A)0.009
B)0.557
C)0.499
D)0.358
E)Not within ± 0.01 of any of the above
Unlock Deck
Unlock for access to all 53 flashcards in this deck.
Unlock Deck
k this deck
16
Myopia (i.e. ,nearsightedness)is a result of environmental and genetic factors.In Singapore,the percent of military personnel having myopia increased dramatically over a 20-year period.Based on this fact,researchers wondered if the effect of the environment might be stronger and the genetic effect much less pronounced than previously thought.To study this issue,data from a random sample of 429 men,ages nineteen to twenty-five,in the Singapore military were obtained.Among other things,the men in the study were classified as to whether or not they had myopia and whether at least one of their parents had myopia.The results are presented in the table below. What are the odds that a man with myopia has at least one parent with myopia?
A)0.590
B)0.907
C)1.439
D)9.696
What are the odds that a man with myopia has at least one parent with myopia?A)0.590
B)0.907
C)1.439
D)9.696
Unlock Deck
Unlock for access to all 53 flashcards in this deck.
Unlock Deck
k this deck
17
What information is needed to compute odds?
A)Sample mean
B)Sample proportion
C)Sample variance
D)Sample median
A)Sample mean
B)Sample proportion
C)Sample variance
D)Sample median
Unlock Deck
Unlock for access to all 53 flashcards in this deck.
Unlock Deck
k this deck
18
Myopia (i.e. ,nearsightedness)is a result of environmental and genetic factors.In Singapore,the percent of military personnel having myopia increased dramatically over a 20-year period .Based on this fact,researchers wondered if the effect of the environment might be stronger and the genetic effect much less pronounced than previously thought.To study this issue,data from a random sample of 429 men,ages nineteen to twenty-five,in the Singapore military were obtained.Among other things,the men in the study were classified as to whether or not they had myopia and whether at least one of their parents had myopia.The results are presented in the table below. Let x be the indicator variable We wish to fit a logistic regression model, ,where p is the binomial probability that a man in the Singapore military has myopia and log is the natural logarithm. Based on the data in the table,what is the estimate b0 of 0?
A)0.561
B)1.711
C)2.272
D)5.536
Let x be the indicator variable We wish to fit a logistic regression model, ,where p is the binomial probability that a man in the Singapore military has myopia and log is the natural logarithm. Based on the data in the table,what is the estimate b0 of 0?A)0.561
B)1.711
C)2.272
D)5.536
Unlock Deck
Unlock for access to all 53 flashcards in this deck.
Unlock Deck
k this deck
19
Myopia (i.e. ,nearsightedness)is a result of environmental and genetic factors.In Singapore,the percent of military personnel having myopia increased dramatically over a 20-year period.Based on this fact,researchers wondered if the effect of the environment might be stronger and the genetic effect much less pronounced than previously thought.To study this issue,data from a random sample of 429 men,ages nineteen to twenty-five,in the Singapore military were obtained.Among other things,the men in the study were classified as to whether or not they had myopia and whether at least one of their parents had myopia.The results are presented in the table below. Let x be the indicator variable We wish to fit a logistic regression model, ,where p is the binomial probability that a man in the Singapore military has myopia and log is the natural logarithm. Based on the data in the table,what is the estimate b1 of 1?
A)0.561
B)1.711
C)2.272
D)5.536
Let x be the indicator variable We wish to fit a logistic regression model, ,where p is the binomial probability that a man in the Singapore military has myopia and log is the natural logarithm. Based on the data in the table,what is the estimate b1 of 1?A)0.561
B)1.711
C)2.272
D)5.536
Unlock Deck
Unlock for access to all 53 flashcards in this deck.
Unlock Deck
k this deck
20
Suppose the odds of being "unfriended" on Facebook by one of your friends is 2 to 3.What is the probability of being unfriended?
A).61
B).39
C)1
D)None of the above
A).61
B).39
C)1
D)None of the above
Unlock Deck
Unlock for access to all 53 flashcards in this deck.
Unlock Deck
k this deck
21
In logistic regression with one explanatory variable,what is the P-value when the X2 test statistic has a value of 5.35?
A).02
B).98
C)1
D)None of the above
A).02
B).98
C)1
D)None of the above
Unlock Deck
Unlock for access to all 53 flashcards in this deck.
Unlock Deck
k this deck
22
Suppose the proportion of students in a simple random sample who own a tablet computer is .80 and the proportion of students that do not own a tablet is .20.What are the odds that a student owns a tablet?
A)4
B).25
C)1
D)None of the above
A)4
B).25
C)1
D)None of the above
Unlock Deck
Unlock for access to all 53 flashcards in this deck.
Unlock Deck
k this deck
23
Using logistic regression,you are going to test the null hypothesis against the alternative hypothesis .Suppose b1 = .8 and the standard error is .2.What is the value of the chi-square test statistic?
A)2
B)4
C)16
D)None of the above
against the alternative hypothesis .Suppose b1 = .8 and the standard error is .2.What is the value of the chi-square test statistic?A)2
B)4
C)16
D)None of the above
Unlock Deck
Unlock for access to all 53 flashcards in this deck.
Unlock Deck
k this deck
24
In logistic regression with one explanatory variable,what is the value of the X2 test statistic when the P-value is .05?
A)0
B).45
C)3.84
D)None of the above
A)0
B).45
C)3.84
D)None of the above
Unlock Deck
Unlock for access to all 53 flashcards in this deck.
Unlock Deck
k this deck
25
Do women and men treat female and male children differently? An observational study was conducted near the primate exhibit at the Sacramento Zoo on weekends in 1988.The data are from 37 groups of three-one adult female,one adult male,and one toddler-in which the toddler was being carried.Recorded in the table below are the gender of the adult who was carrying the toddler and the gender of the toddler: Let x be the indicator variable We wish to fit a logistic regression model, ,where p is the binomial probability that the toddler being carried is a girl and log is the natural logarithm.The following (partial)SPSS output is available. Variables in the Equation Based on the data in the table,what is the estimate b0 of 0?
A)0.000
B)0.577
C)0.754
D)1.000
Let x be the indicator variable We wish to fit a logistic regression model, ,where p is the binomial probability that the toddler being carried is a girl and log is the natural logarithm.The following (partial)SPSS output is available. Variables in the Equation Based on the data in the table,what is the estimate b0 of 0?A)0.000
B)0.577
C)0.754
D)1.000
Unlock Deck
Unlock for access to all 53 flashcards in this deck.
Unlock Deck
k this deck
26
A study was undertaken to assess the quality of cheese as determined by a panel of taste testers.The tasters rated samples of cheese as being acceptable or not acceptable.Those same samples of cheese were analyzed with respect to several variables,one of which was the untransformed concentration of lactic acid,designated as Lactic.A logistic regression was fitted relating the log odds that the cheese was acceptable to the explanatory variable Lactic.The following partial computer output is provided. What is the approximate 90% confidence interval estimate for the true slope of the logistic regression model?
A)(0.152,1.014)
B)(1.259,2.821)
C)(-0.222,3.982)
D)(0.230,1.037)
E)This cannot be determined without knowing the degrees of freedom.
What is the approximate 90% confidence interval estimate for the true slope of the logistic regression model?A)(0.152,1.014)
B)(1.259,2.821)
C)(-0.222,3.982)
D)(0.230,1.037)
E)This cannot be determined without knowing the degrees of freedom.
Unlock Deck
Unlock for access to all 53 flashcards in this deck.
Unlock Deck
k this deck
27
A study was undertaken to assess the quality of cheese as determined by a panel of taste testers.The tasters rated samples of cheese as being acceptable or not acceptable.Those same samples of cheese were analyzed with respect to several variables,one of which was the untransformed concentration of lactic acid,designated as Lactic.A logistic regression was fitted relating the log odds that the cheese was acceptable to the explanatory variable Lactic.The following partial computer output is provided. What is the meaning of the entry 0.6332 in the above table under Estimate for the variable Lactic?
A)The odds ratio for the acceptability of the cheese is 1.88.
B)A one-unit increase in the variable Lactic results in a change in the odds that the cheese is acceptable by a factor of 0.6332.
C)The odds ratio for the acceptability of the cheese is 0.6332.
D)A one-unit increase in the variable Lactic results in a change in the odds that the cheese is acceptable by a factor of 1.88.
E)Both A and D are correct.
What is the meaning of the entry 0.6332 in the above table under Estimate for the variable Lactic?A)The odds ratio for the acceptability of the cheese is 1.88.
B)A one-unit increase in the variable Lactic results in a change in the odds that the cheese is acceptable by a factor of 0.6332.
C)The odds ratio for the acceptability of the cheese is 0.6332.
D)A one-unit increase in the variable Lactic results in a change in the odds that the cheese is acceptable by a factor of 1.88.
E)Both A and D are correct.
Unlock Deck
Unlock for access to all 53 flashcards in this deck.
Unlock Deck
k this deck
28
What are the degrees of freedom of the test used when analyzing data using multiple logistic regression with three explanatory variables?
A)1
B)1 and 3
C)3
D)None of the above
A)1
B)1 and 3
C)3
D)None of the above
Unlock Deck
Unlock for access to all 53 flashcards in this deck.
Unlock Deck
k this deck
29
Do women and men treat female and male children differently? An observational study was conducted near the primate exhibit at the Sacramento Zoo on weekends in 1988.The data are from 37 groups of three-one adult female,one adult male,and one toddler-in which the toddler was being carried.Recorded in the table below are the gender of the adult who was carrying the toddler and the gender of the toddler: Let x be the indicator variable We wish to fit a logistic regression model, ,where p is the binomial probability that the toddler being carried is a girl and log is the natural logarithm.The following (partial)SPSS output is available. Variables in the Equation What is a 90% confidence interval for the intercept 0?
A)0 ± 0.949
B)0 ± 1.131
C)0.754 ± 1.183
D)0.754 ± 1.409
Let x be the indicator variable We wish to fit a logistic regression model, ,where p is the binomial probability that the toddler being carried is a girl and log is the natural logarithm.The following (partial)SPSS output is available. Variables in the Equation What is a 90% confidence interval for the intercept 0?A)0 ± 0.949
B)0 ± 1.131
C)0.754 ± 1.183
D)0.754 ± 1.409
Unlock Deck
Unlock for access to all 53 flashcards in this deck.
Unlock Deck
k this deck
30
What is the null hypothesis being tested when analyzing data using multiple logistic regression with three explanatory variables?
A)
B)
C)
D)None of the above
A)
B)
C)
D)None of the above
Unlock Deck
Unlock for access to all 53 flashcards in this deck.
Unlock Deck
k this deck
31
Suppose the odds of there being a major traffic jam on the highway on your way to campus is 5 to 1.What is the probability that there is a traffic jam?
A).83
B).17
C)1
D)None of the above
A).83
B).17
C)1
D)None of the above
Unlock Deck
Unlock for access to all 53 flashcards in this deck.
Unlock Deck
k this deck
32
In logistic regression,what statistic is used for statistical inference when you have one explanatory variable?
A)z statistic
B)X2statistic
C)All of the above
D)None of the above
A)z statistic
B)X2statistic
C)All of the above
D)None of the above
Unlock Deck
Unlock for access to all 53 flashcards in this deck.
Unlock Deck
k this deck
33
What is the distribution of the test statistic when analyzing data using multiple logistic regression with three explanatory variables?
A) 2 distribution
B)t distribution
C)Normal distribution
D)F distribution
A) 2 distribution
B)t distribution
C)Normal distribution
D)F distribution
Unlock Deck
Unlock for access to all 53 flashcards in this deck.
Unlock Deck
k this deck
34
What is the alternative hypothesis being tested when analyzing data using multiple logistic regression with three explanatory variables?
A)
B)
C)
D)None of the above
A)
B)
C)
D)None of the above
Unlock Deck
Unlock for access to all 53 flashcards in this deck.
Unlock Deck
k this deck
35
Suppose the proportion of students in a simple random sample who own a tablet computer is .80 and the proportion of students that do not own a tablet is .20.What are the odds that a student does not own a tablet?
A)4
B).25
C)1
D)None of the above
A)4
B).25
C)1
D)None of the above
Unlock Deck
Unlock for access to all 53 flashcards in this deck.
Unlock Deck
k this deck
36
In logistic regression,the test statistic used to test the null hypothesis that 1 = 0 is sometimes called a(n)_______.
A)Wald statistic
B)uniform statistic
C)indicator function
D)None of the above
A)Wald statistic
B)uniform statistic
C)indicator function
D)None of the above
Unlock Deck
Unlock for access to all 53 flashcards in this deck.
Unlock Deck
k this deck
37
A study was undertaken to assess the quality of cheese as determined by a panel of taste testers.The tasters rated samples of cheese as being acceptable or not acceptable.Those same samples of cheese were analyzed with respect to several variables,one of which was the untransformed concentration of lactic acid,designated as Lactic.A logistic regression was fitted relating the log odds that the cheese was acceptable to the explanatory variable Lactic.The following partial computer output is provided. A sample of cheese was analyzed and the variable Lactic was found to have the value 16.5.At this level of concentration of lactic acid,what are the odds that the cheese will be deemed to be acceptable?
A)2.80
B)-0.332
C)0.717
D)0.633
E)None of the above
A sample of cheese was analyzed and the variable Lactic was found to have the value 16.5.At this level of concentration of lactic acid,what are the odds that the cheese will be deemed to be acceptable?A)2.80
B)-0.332
C)0.717
D)0.633
E)None of the above
Unlock Deck
Unlock for access to all 53 flashcards in this deck.
Unlock Deck
k this deck
38
Do women and men treat female and male children differently? An observational study was conducted near the primate exhibit at the Sacramento Zoo on weekends in 1988.The data are from 37 groups of three-one adult female,one adult male,and one toddler-in which the toddler was being carried.Recorded in the table below are the gender of the adult who was carrying the toddler and the gender of the toddler: Let x be the indicator variable We wish to fit a logistic regression model, ,where p is the binomial probability that the toddler being carried is a girl and log is the natural logarithm.The following (partial)SPSS output is available. Variables in the Equation What is a 95% confidence interval for the odds ratio?
A)(0.323,3.099)
B)(0.387,2.583)
C)(0.519,8.697)
D)(0.651,6.938)
Let x be the indicator variable We wish to fit a logistic regression model, ,where p is the binomial probability that the toddler being carried is a girl and log is the natural logarithm.The following (partial)SPSS output is available. Variables in the Equation What is a 95% confidence interval for the odds ratio?A)(0.323,3.099)
B)(0.387,2.583)
C)(0.519,8.697)
D)(0.651,6.938)
Unlock Deck
Unlock for access to all 53 flashcards in this deck.
Unlock Deck
k this deck
39
Do women and men treat female and male children differently? An observational study was conducted near the primate exhibit at the Sacramento Zoo on weekends in 1988.The data are from 37 groups of three-one adult female,one adult male,and one toddler-in which the toddler was being carried.Recorded in the table below are the gender of the adult who was carrying the toddler and the gender of the toddler: Let x be the indicator variable We wish to fit a logistic regression model, ,where p is the binomial probability that the toddler being carried is a girl and log is the natural logarithm.The following (partial)SPSS output is available. Variables in the Equation What is the value of the X2 statistic for testing the hypotheses H0: 1 = 0 vs.Ha: 1 0?
A)0.295
B)1.00
C)1.049
D)1.100
Let x be the indicator variable We wish to fit a logistic regression model, ,where p is the binomial probability that the toddler being carried is a girl and log is the natural logarithm.The following (partial)SPSS output is available. Variables in the Equation What is the value of the X2 statistic for testing the hypotheses H0: 1 = 0 vs.Ha: 1 0?A)0.295
B)1.00
C)1.049
D)1.100
Unlock Deck
Unlock for access to all 53 flashcards in this deck.
Unlock Deck
k this deck
40
A study was undertaken to assess the quality of cheese as determined by a panel of taste testers.The tasters rated samples of cheese as being acceptable or not acceptable.Those same samples of cheese were analyzed with respect to several variables,one of which was the untransformed concentration of lactic acid,designated as Lactic.A logistic regression was fitted relating the log odds that the cheese was acceptable to the explanatory variable Lactic.The following partial computer output is provided. What is the value of the test statistic and the P-value for the test of the hypotheses H0: = 0 against Ha: 0?
A)z = -2.71;P-value = 0.0034
B)z = 2.58;P-value = 0.0049
C)z = 2.58;P-value = 0.0098
D)z = -2.71;P-value = 0.0068
E)z = 1.47;P-value = 0.1416
What is the value of the test statistic and the P-value for the test of the hypotheses H0: = 0 against Ha: 0?A)z = -2.71;P-value = 0.0034
B)z = 2.58;P-value = 0.0049
C)z = 2.58;P-value = 0.0098
D)z = -2.71;P-value = 0.0068
E)z = 1.47;P-value = 0.1416
Unlock Deck
Unlock for access to all 53 flashcards in this deck.
Unlock Deck
k this deck
41
In multiple logistic regression,there can be _____ explanatory variable(s).
A)one
B)two
C)three
D)many
A)one
B)two
C)three
D)many
Unlock Deck
Unlock for access to all 53 flashcards in this deck.
Unlock Deck
k this deck
42
In logistic regression,there can be _____ explanatory variable(s).
A)one
B)two
C)three
D)many
A)one
B)two
C)three
D)many
Unlock Deck
Unlock for access to all 53 flashcards in this deck.
Unlock Deck
k this deck
43
How do men and women compare on a trip to the grocery store? A certain grocery list with a variety of items on it was given to 90 people with a family (who are used to shopping for more than one person).The total bill should be about $250.Each of the 90 people was sent to their grocery store of choice and their bill was categorized as either paying too much or not paying too much (e.g. ,a bill of $250 or less).The results,by gender,are shown below. Let x be the indicator variable We wish to fit a logistic regression model, ,where p is the binomial probability that the person paid too much for the groceries on the list.
The following SPSS output is available.
Variables in the Equation What is the equation of the estimated log odds?
Let x be the indicator variable We wish to fit a logistic regression model, ,where p is the binomial probability that the person paid too much for the groceries on the list.The following SPSS output is available.
Variables in the Equation
What is the equation of the estimated log odds? Unlock Deck
Unlock for access to all 53 flashcards in this deck.
Unlock Deck
k this deck
44
In a recent study,over 33,000 women were asked,"Did you have a mammogram within the last 2 years?" Despite the benefits of screening,about 30% of respondents indicated that they had not had a recent mammogram.The dependent/outcome variable was the proportion of women who reported a recent mammogram.In addition,the following information was collected on each individual: age (40-49,50-64,65-74,75-84),race/ethnicity (Latina,Non-Latina African American,Non-Latina Asian/Pacific Islander,Non-Latina White,and Non-Latina other race/ethnicity),marital status (married or living with partner vs.not currently married),history of breast cancer (yes vs.no),self-rated health (excellent,very good,good,fair,poor),currently with health insurance (yes vs.no),and having a usual source of care (yes vs.no).All variables were treated as categorical (e.g. ,coded as 1 or 0 for each category).A multiple logistic regression model was fitted to the data to predict the probability a woman had a recent mammogram.Software output from SAS is shown below. What is the sample proportion of women who did have a mammogram within the last 2 years?
A)0.30
B)0.70
C)0.50
D)1
What is the sample proportion of women who did have a mammogram within the last 2 years?A)0.30
B)0.70
C)0.50
D)1
Unlock Deck
Unlock for access to all 53 flashcards in this deck.
Unlock Deck
k this deck
45
In a recent study,over 33,000 women were asked,"Did you have a mammogram within the last 2 years?" Despite the benefits of screening,about 30% of respondents indicated that they had not had a recent mammogram.The dependent/outcome variable was the proportion of women who reported a recent mammogram.In addition,the following information was collected on each individual: age (40-49,50-64,65-74,75-84),race/ethnicity (Latina,Non-Latina African American,Non-Latina Asian/Pacific Islander,Non-Latina White,and Non-Latina other race/ethnicity),marital status (married or living with partner vs.not currently married),history of breast cancer (yes vs.no),self-rated health (excellent,very good,good,fair,poor),currently with health insurance (yes vs.no),and having a usual source of care (yes vs.no).All variables were treated as categorical (e.g. ,coded as 1 or 0 for each category).A multiple logistic regression model was fitted to the data to predict the probability a woman had a recent mammogram.Software output from SAS is shown below. What is the equation for the estimated odds that a fifty-year-old,single,black woman who has no history of breast cancer and is in good health had a recent mammogram?
A)Log(odds)= 0.28 Age + 0.22 Race + 0 Marital + 0 History + 0.17 Health
B)Log(odds)= -0.55 Age + 0.11 Race + 0.21 Marital + 0.41 History + 0.14 Health
C)Log (odds)= 0 Age + 0 Race + 0 Marital + 0 History + 0.17 Health
D)None of the above
What is the equation for the estimated odds that a fifty-year-old,single,black woman who has no history of breast cancer and is in good health had a recent mammogram?A)Log(odds)= 0.28 Age + 0.22 Race + 0 Marital + 0 History + 0.17 Health
B)Log(odds)= -0.55 Age + 0.11 Race + 0.21 Marital + 0.41 History + 0.14 Health
C)Log (odds)= 0 Age + 0 Race + 0 Marital + 0 History + 0.17 Health
D)None of the above
Unlock Deck
Unlock for access to all 53 flashcards in this deck.
Unlock Deck
k this deck
46
In a recent study,over 33,000 women were asked,"Did you have a mammogram within the last 2 years?" Despite the benefits of screening,about 30% of respondents indicated that they had not had a recent mammogram.The dependent/outcome variable was the proportion of women who reported a recent mammogram.In addition,the following information was collected on each individual: age (40-49,50-64,65-74,75-84),race/ethnicity (Latina,Non-Latina African American,Non-Latina Asian/Pacific Islander,Non-Latina White,and Non-Latina other race/ethnicity),marital status (married or living with partner vs.not currently married),history of breast cancer (yes vs.no),self-rated health (excellent,very good,good,fair,poor),currently with health insurance (yes vs.no),and having a usual source of care (yes vs.no).All variables were treated as categorical (e.g. ,coded as 1 or 0 for each category).A multiple logistic regression model was fitted to the data to predict the probability a woman had a recent mammogram.Software output from SAS is shown below. What is the equation for the estimated odds that a forty-year-old,married,Latina woman who has a history of breast cancer and is in excellent health had a recent mammogram?
A)Log(odds)= 0.28 Age + 0.22 Race + 0 Marital + 0 History + 0.17 Health
B)Log(odds)= -0.55 Age + 0.11 Race + 0.21 Marital + 0.41 History + 0.14 Health
C)Log (odds)= 0 Age + 0 Race + 0 Marital + 0 History + 0.17 Health
D)None of the above
What is the equation for the estimated odds that a forty-year-old,married,Latina woman who has a history of breast cancer and is in excellent health had a recent mammogram?A)Log(odds)= 0.28 Age + 0.22 Race + 0 Marital + 0 History + 0.17 Health
B)Log(odds)= -0.55 Age + 0.11 Race + 0.21 Marital + 0.41 History + 0.14 Health
C)Log (odds)= 0 Age + 0 Race + 0 Marital + 0 History + 0.17 Health
D)None of the above
Unlock Deck
Unlock for access to all 53 flashcards in this deck.
Unlock Deck
k this deck
47
In a recent study,over 33,000 women were asked,"Did you have a mammogram within the last 2 years?" Despite the benefits of screening,about 30% of respondents indicated that they had not had a recent mammogram.The dependent/outcome variable was the proportion of women who reported a recent mammogram.In addition,the following information was collected on each individual: age (40-49,50-64,65-74,75-84),race/ethnicity (Latina,Non-Latina African American,Non-Latina Asian/Pacific Islander,Non-Latina White,and Non-Latina other race/ethnicity),marital status (married or living with partner vs.not currently married),history of breast cancer (yes vs.no),self-rated health (excellent,very good,good,fair,poor),currently with health insurance (yes vs.no),and having a usual source of care (yes vs.no).All variables were treated as categorical (e.g. ,coded as 1 or 0 for each category).A multiple logistic regression model was fitted to the data to predict the probability a woman had a recent mammogram.Software output from SAS is shown below. Is age a significant predictor of having had a recent mammogram? (Assume = 0.05. )
A)Yes
B)No
Is age a significant predictor of having had a recent mammogram? (Assume = 0.05. )A)Yes
B)No
Unlock Deck
Unlock for access to all 53 flashcards in this deck.
Unlock Deck
k this deck
48
In multiple logistic regression,the response variable takes on _____ possible value(s).
A)one
B)two
C)three
D)many
A)one
B)two
C)three
D)many
Unlock Deck
Unlock for access to all 53 flashcards in this deck.
Unlock Deck
k this deck
49
In a recent study,over 33,000 women were asked,"Did you have a mammogram within the last 2 years?" Despite the benefits of screening,about 30% of respondents indicated that they had not had a recent mammogram.The dependent/outcome variable was the proportion of women who reported a recent mammogram.In addition,the following information was collected on each individual: age (40-49,50-64,65-74,75-84),race/ethnicity (Latina,Non-Latina African American,Non-Latina Asian/Pacific Islander,Non-Latina White,and Non-Latina other race/ethnicity),marital status (married or living with partner vs.not currently married),history of breast cancer (yes vs.no),self-rated health (excellent,very good,good,fair,poor),currently with health insurance (yes vs.no),and having a usual source of care (yes vs.no).All variables were treated as categorical (e.g. ,coded as 1 or 0 for each category).A multiple logistic regression model was fitted to the data to predict the probability a woman had a recent mammogram.Software output from SAS is shown below. What category of general health is a significant predictor of having had a recent mammogram? (Assume = 0.05. )
A)Excellent
B)Very good
C)Good
D)None of the above
What category of general health is a significant predictor of having had a recent mammogram? (Assume = 0.05. )A)Excellent
B)Very good
C)Good
D)None of the above
Unlock Deck
Unlock for access to all 53 flashcards in this deck.
Unlock Deck
k this deck
50
In a recent study,over 33,000 women were asked,"Did you have a mammogram within the last 2 years?" Despite the benefits of screening,about 30% of respondents indicated that they had not had a recent mammogram.The dependent/outcome variable was the proportion of women who reported a recent mammogram.In addition,the following information was collected on each individual: age (40-49,50-64,65-74,75-84),race/ethnicity (Latina,Non-Latina African American,Non-Latina Asian/Pacific Islander,Non-Latina White,and Non-Latina other race/ethnicity),marital status (married or living with partner vs.not currently married),history of breast cancer (yes vs.no),self-rated health (excellent,very good,good,fair,poor),currently with health insurance (yes vs.no),and having a usual source of care (yes vs.no).All variables were treated as categorical (e.g. ,coded as 1 or 0 for each category).A multiple logistic regression model was fitted to the data to predict the probability a woman had a recent mammogram.Software output from SAS is shown below. What is the sample proportion of women who did not have a mammogram within the last 2 years?
A)0.30
B)0.70
C)0.50
D)1
What is the sample proportion of women who did not have a mammogram within the last 2 years?A)0.30
B)0.70
C)0.50
D)1
Unlock Deck
Unlock for access to all 53 flashcards in this deck.
Unlock Deck
k this deck
51
In a recent study,over 33,000 women were asked,"Did you have a mammogram within the last 2 years?" Despite the benefits of screening,about 30% of respondents indicated that they had not had a recent mammogram.The dependent/outcome variable was the proportion of women who reported a recent mammogram.In addition,the following information was collected on each individual: age (40-49,50-64,65-74,75-84),race/ethnicity (Latina,Non-Latina African American,Non-Latina Asian/Pacific Islander,Non-Latina White,and Non-Latina other race/ethnicity),marital status (married or living with partner vs.not currently married),history of breast cancer (yes vs.no),self-rated health (excellent,very good,good,fair,poor),currently with health insurance (yes vs.no),and having a usual source of care (yes vs.no).All variables were treated as categorical (e.g. ,coded as 1 or 0 for each category).A multiple logistic regression model was fitted to the data to predict the probability a woman had a recent mammogram.Software output from SAS is shown below. What are the odds that a woman did have a mammogram within the last 2 years?
A)2.33
B)0.428
C)0.3
D)0.7
What are the odds that a woman did have a mammogram within the last 2 years?A)2.33
B)0.428
C)0.3
D)0.7
Unlock Deck
Unlock for access to all 53 flashcards in this deck.
Unlock Deck
k this deck
52
In a recent study,over 33,000 women were asked,"Did you have a mammogram within the last 2 years?" Despite the benefits of screening,about 30% of respondents indicated that they had not had a recent mammogram.The dependent/outcome variable was the proportion of women who reported a recent mammogram.In addition,the following information was collected on each individual: age (40-49,50-64,65-74,75-84),race/ethnicity (Latina,Non-Latina African American,Non-Latina Asian/Pacific Islander,Non-Latina White,and Non-Latina other race/ethnicity),marital status (married or living with partner vs.not currently married),history of breast cancer (yes vs.no),self-rated health (excellent,very good,good,fair,poor),currently with health insurance (yes vs.no),and having a usual source of care (yes vs.no).All variables were treated as categorical (e.g. ,coded as 1 or 0 for each category).A multiple logistic regression model was fitted to the data to predict the probability a woman had a recent mammogram.Software output from SAS is shown below. What are the odds that a woman did not have a mammogram within the last 2 years?
A)2.33
B)0.428
C)0.3
D)0.7
What are the odds that a woman did not have a mammogram within the last 2 years?A)2.33
B)0.428
C)0.3
D)0.7
Unlock Deck
Unlock for access to all 53 flashcards in this deck.
Unlock Deck
k this deck
53
Logistic regression is based on ________.
A)variances
B)proportions
C)odds
D)None of the above
A)variances
B)proportions
C)odds
D)None of the above
Unlock Deck
Unlock for access to all 53 flashcards in this deck.
Unlock Deck
k this deck
Unlock Deck
Unlock for access to all 53 flashcards in this deck.


