Deck 11: Analysis of Variance
Full screen (f)
Question
Question
Question
Question
Question
Question
Question
Question
Question
Question
Question
Question
Question
Question
Question
Question
Question
Question
Question
Question
Question
Question
Question
Question
Question
Question
Question
Question
Question
Question
Question
Question
Question
Question
Question
Question
Question
Question
Question
Question
Question
Refer to the following partial ANOVA results from Excel (some information is missing).  The F-test statistic is:
A) 2.84.
B) 3.56.
C) 2.80.
D) 2.79.
The F-test statistic is:A) 2.84.
B) 3.56.
C) 2.80.
D) 2.79.
Question
Question
Refer to the following partial ANOVA results from Excel (some information is missing).  The sample size is:
A) 20.
B) 23.
C) 24.
The sample size is:A) 20.
B) 23.
C) 24.
Question
Question
Question
The Internal Revenue Service wishes to study the time required to process tax returns in three regional centers.A random sample of three tax returns is chosen from each of three centers.The time (in days)required to process each return is recorded as shown below.  The test to use to compare the means for all three groups would require:
A) three-factor ANOVA.
B) one-factor ANOVA.
C) repeated two-sample test of means.
D) two-factor ANOVA with replication.
The test to use to compare the means for all three groups would require:A) three-factor ANOVA.
B) one-factor ANOVA.
C) repeated two-sample test of means.
D) two-factor ANOVA with replication.
Question
The Internal Revenue Service wishes to study the time required to process tax returns in three regional centers.A random sample of three tax returns is chosen from each of three centers.The time (in days)required to process each return is recorded as shown below. 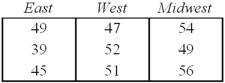 Degrees of freedom for the between-groups sum of squares in the ANOVA would be:
A) 11.
B) 2.
C) 4.
Degrees of freedom for the between-groups sum of squares in the ANOVA would be:A) 11.
B) 2.
C) 4.
Question
Refer to the following partial ANOVA results from Excel (some information is missing).  Degrees of freedom for the F-test are:
A) 5,22.
B) 4,21.
C) 3,20.
D) impossible to determine.
Degrees of freedom for the F-test are:A) 5,22.
B) 4,21.
C) 3,20.
D) impossible to determine.
Question
Systolic blood pressure of randomly selected HMO patients was recorded on a particular Wednesday,with the results shown here:  The appropriate hypothesis test is:
A) one-factor ANOVA.
B) two-factor ANOVA.
C) three-factor ANOVA.
D) four-factor ANOVA.
The appropriate hypothesis test is:A) one-factor ANOVA.
B) two-factor ANOVA.
C) three-factor ANOVA.
D) four-factor ANOVA.
Question
Prof.Gristmill sampled exam scores for five randomly chosen students from each of his two sections of ACC 200.His sample results are shown.  He could test the population means for equality using:
A) a t-test for two means from independent samples.
B) a t-test for two means from paired (related)samples.
C) a one-factor ANOVA.
D) either a one-factor ANOVA or a two-tailed t-test.
He could test the population means for equality using:A) a t-test for two means from independent samples.
B) a t-test for two means from paired (related)samples.
C) a one-factor ANOVA.
D) either a one-factor ANOVA or a two-tailed t-test.
Question
For this one-factor ANOVA (some information is missing),what is the F-test statistic? 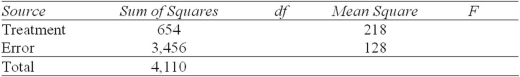
A) 0.159
B) 2.833
C) 1.703
D) Cannot be determined
A) 0.159
B) 2.833
C) 1.703
D) Cannot be determined
Question
Identify the degrees of freedom for the treatment and error in this one-factor ANOVA (blanks indicate missing information). 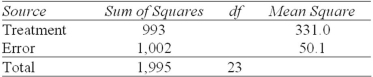
A) 4,24
B) 3,20
C) 5,23
A) 4,24
B) 3,20
C) 5,23
Question
For this one-factor ANOVA (some information is missing),how many treatment groups were there? 
A) Cannot be determined
B) 3
C) 4
D) 2
A) Cannot be determined
B) 3
C) 4
D) 2
Question
Refer to the following partial ANOVA results from Excel (some information is missing).  Degrees of freedom for between groups variation are:
A) 3.
B) 4.
C) 5.
D) Can't tell from given information.
Degrees of freedom for between groups variation are:A) 3.
B) 4.
C) 5.
D) Can't tell from given information.
Question
Refer to the following partial ANOVA results from Excel (some information is missing). 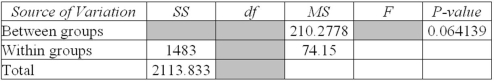 At α = 0.05,the difference between group means is:
A) highly significant.
B) barely significant.
C) not quite significant.
D) clearly insignificant.
At α = 0.05,the difference between group means is:A) highly significant.
B) barely significant.
C) not quite significant.
D) clearly insignificant.
Question
Refer to the following partial ANOVA results from Excel (some information is missing).  SS for between groups variation will be:
A) 129.99.
B) 630.83.
C) 1233.4.
D) Can't tell.
SS for between groups variation will be:A) 129.99.
B) 630.83.
C) 1233.4.
D) Can't tell.
Question
Refer to the following partial ANOVA results from Excel (some information is missing). 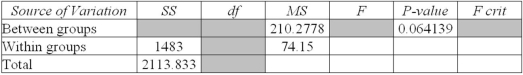 The critical value of F at α = 0.05 is:
A) 1.645.
B) 2.84.
C) 3.10.
D) 4.28.
The critical value of F at α = 0.05 is:A) 1.645.
B) 2.84.
C) 3.10.
D) 4.28.
Question
Refer to the following partial ANOVA results from Excel (some information is missing). 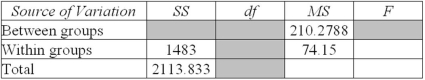 The number of treatment groups is:
A) 4.
B) 3.
C) 2.
D)
The number of treatment groups is:A) 4.
B) 3.
C) 2.
D)
Question
Given the following ANOVA table (some information is missing),find the critical value of F.05. 
A) 3.06
B) 2.90
C) 2.36
D) 3.41
A) 3.06
B) 2.90
C) 2.36
D) 3.41
Question
Given the following ANOVA table (some information is missing),find the F statistic. 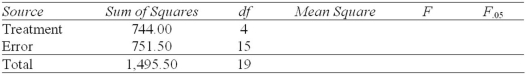
A) 3.71
B) 0.99
C) 0.497
D) 4.02
A) 3.71
B) 0.99
C) 0.497
D) 4.02
Question
Refer to the following partial ANOVA results from Excel (some information is missing). ANOVA Table 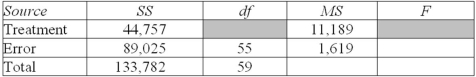 The number of treatment groups is:
A) 5.
B) 4.
C) 3.
D) impossible to ascertain from given.
The number of treatment groups is:A) 5.
B) 4.
C) 3.
D) impossible to ascertain from given.
Question
Refer to the following partial ANOVA results from Excel (some information is missing).  The number of observations in the entire sample is:
A) 20.
B) 19.
C)
The number of observations in the entire sample is:A) 20.
B) 19.
C)
Question
Systolic blood pressure of randomly selected HMO patients was recorded on a particular Wednesday,with the results shown here.An ANOVA test was performed using these data.  What are the degrees of freedom for the error sum of squares?
A) 3
B) 19
C) 16
D) It depends on α.
What are the degrees of freedom for the error sum of squares?A) 3
B) 19
C) 16
D) It depends on α.
Question
Refer to the following partial ANOVA results from Excel (some information is missing). ANOVA Table  The number of observations in the original sample was:
A) 59.
B) 60.
C) 58.
The number of observations in the original sample was:A) 59.
B) 60.
C) 58.
Question
Refer to the following partial ANOVA results from Excel (some information is missing).  The MS (mean square)for the treatments is:
A) 239.13.
B) 106.88.
C) 1,130.8.
D) impossible to ascertain from the information given.
The MS (mean square)for the treatments is:A) 239.13.
B) 106.88.
C) 1,130.8.
D) impossible to ascertain from the information given.
Question
To compare the cost of three shipping methods,a random sample of four shipments is taken for each of three firms.The cost per shipment is shown below.  In a one-factor ANOVA,degrees of freedom for the between-groups sum of squares will be:
A) 11.
B) 3.
C) 2.
In a one-factor ANOVA,degrees of freedom for the between-groups sum of squares will be:A) 11.
B) 3.
C) 2.
Question
Refer to the following partial ANOVA results from Excel (some information is missing). 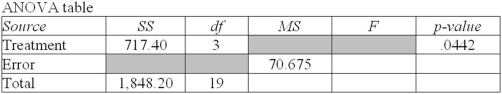 Our decision about the hypothesis of equal treatment means is that the null hypothesis:
A) cannot be rejected at α = .05.
B) can be rejected at α = .05.
C) can be rejected for any typical value of α.
D) cannot be assessed from the given information.
Our decision about the hypothesis of equal treatment means is that the null hypothesis:A) cannot be rejected at α = .05.
B) can be rejected at α = .05.
C) can be rejected for any typical value of α.
D) cannot be assessed from the given information.
Question
Refer to the following partial ANOVA results from Excel (some information is missing).  The F statistic is:
A) 4.87.
B) 3.38.
C) 5.93.
D) 6.91.
The F statistic is:A) 4.87.
B) 3.38.
C) 5.93.
D) 6.91.
Question
Systolic blood pressure of randomly selected HMO patients was recorded on a particular Wednesday,with the results shown here.An ANOVA test was performed using these data. 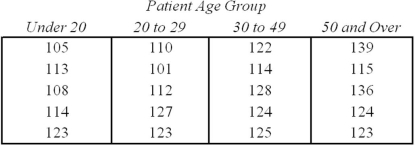 Degrees of freedom for the between-treatments sum of squares would be:
A) 3.
B) 19.
C) 17.
D) depends on α.
Degrees of freedom for the between-treatments sum of squares would be:A) 3.
B) 19.
C) 17.
D) depends on α.
Question
To compare the cost of three shipping methods,a random sample of four shipments is taken for each of three firms.The cost per shipment is shown below.  In a one-factor ANOVA,degrees of freedom for the within-groups sum of squares will be:
A) 11.
B) 3.
C) 9.
In a one-factor ANOVA,degrees of freedom for the within-groups sum of squares will be:A) 11.
B) 3.
C) 9.
Question
Refer to the following partial ANOVA results from Excel (some information is missing). ANOVA Table  The F statistic is:
A) 2.88.
B) 4.87.
C) 5.93.
D) 6.91.
The F statistic is:A) 2.88.
B) 4.87.
C) 5.93.
D) 6.91.
Question
Question
Refer to the following MegaStat output (some information is missing).The sample size was n = 65 in a one-factor ANOVA. 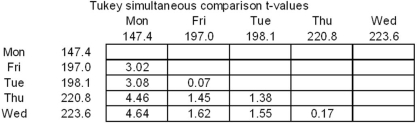 At α = .05,which is the critical value of the test statistic for a two-tailed test for a significant difference in means that are to be compared simultaneously? Note: This question requires a Tukey table.
A) 2.81
B) 2.54
C) 2.33
D) 1.96
At α = .05,which is the critical value of the test statistic for a two-tailed test for a significant difference in means that are to be compared simultaneously? Note: This question requires a Tukey table.A) 2.81
B) 2.54
C) 2.33
D) 1.96
Question
Refer to the following MegaStat output (some information is missing).The sample size was n = 24 in a one-factor ANOVA. 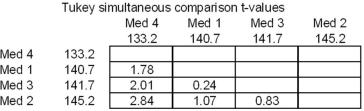 At α = .05,what is the critical value of the Tukey test statistic for a two-tailed test for a significant difference in means that are to be compared simultaneously? Note: This question requires access to a Tukey table.
A) 2.07
B) 2.80
C) 2.76
D) 1.96
At α = .05,what is the critical value of the Tukey test statistic for a two-tailed test for a significant difference in means that are to be compared simultaneously? Note: This question requires access to a Tukey table.A) 2.07
B) 2.80
C) 2.76
D) 1.96
Question
Refer to the following MegaStat output (some information is missing).The sample size was n = 65 in a one-factor ANOVA. 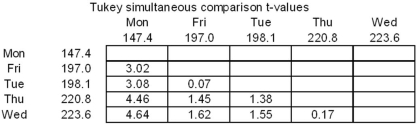 Which pairs of days differ significantly? Note: This question requires access to a Tukey table.
A) (Mon,Thu)and (Mon,Wed)only.
B) (Mon,Wed)only.
C) (Mon,Thu)only.
D) (Mon,Thu)and (Mon,Wed)and (Mon,Fri)and (Mon,Tue).
Which pairs of days differ significantly? Note: This question requires access to a Tukey table.A) (Mon,Thu)and (Mon,Wed)only.
B) (Mon,Wed)only.
C) (Mon,Thu)only.
D) (Mon,Thu)and (Mon,Wed)and (Mon,Fri)and (Mon,Tue).
Question
Question
Sound levels are measured at random moments under typical driving conditions for various full-size truck models.The ANOVA results are shown below.  The test statistic for Hartley's test for homogeneity of variance is:
A) 2.25.
B) 5.04.
C) 4.61.
D) 4.45.
The test statistic for Hartley's test for homogeneity of variance is:A) 2.25.
B) 5.04.
C) 4.61.
D) 4.45.
Question
Refer to the following MegaStat output (some information is missing).The sample size was n = 24 in a one-factor ANOVA.  Which pairs of meds differ at α = .05? Note: This question requires access to a Tukey table.
A) Med 1,Med 2
B) Med 2,Med 4
C) Med 3,Med 4
D) None of them.
Which pairs of meds differ at α = .05? Note: This question requires access to a Tukey table.A) Med 1,Med 2
B) Med 2,Med 4
C) Med 3,Med 4
D) None of them.
Question
Sound levels are measured at random moments under typical driving conditions for various full-size truck models.The Excel ANOVA results are shown below. 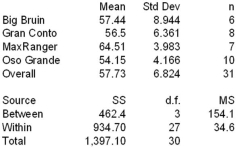 The test statistic to compare the five means simultaneously is:
A) 2.96.
B) 15.8.
C) 5.56.
D) 4.45.
The test statistic to compare the five means simultaneously is:A) 2.96.
B) 15.8.
C) 5.56.
D) 4.45.
Question
To compare the cost of three shipping methods,a random sample of four shipments is taken for each of three firms.The cost per shipment is shown below. 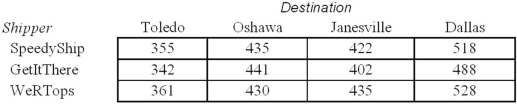 Degrees of freedom for the total sum of squares in a one-factor ANOVA would be:
A) 11.
B) 8.
C) 2.
Degrees of freedom for the total sum of squares in a one-factor ANOVA would be:A) 11.
B) 8.
C) 2.

Unlock Deck
Sign up to unlock the cards in this deck!
Unlock Deck
Unlock Deck
1/141
Play
Full screen (f)
Deck 11: Analysis of Variance
1
Hartley's test measures the equality of the means for several groups.
False
2
Tukey's test is not needed if we have the overall F statistic for the ANOVA.
False
3
Analysis of variance is a procedure intended to compare the means of c samples.
True
4
In a two-factor ANOVA with three columns and four rows,there can be more than two interaction effects.
Unlock Deck
Unlock for access to all 141 flashcards in this deck.
Unlock Deck
k this deck
5
One-factor ANOVA with two groups is equivalent to a two-tailed t-test.
Unlock Deck
Unlock for access to all 141 flashcards in this deck.
Unlock Deck
k this deck
6
Hartley's test is the largest sample mean divided by the smallest sample mean.
Unlock Deck
Unlock for access to all 141 flashcards in this deck.
Unlock Deck
k this deck
7
Three-factor ANOVA is required if we have three treatment groups (i.e. ,three data columns).
Unlock Deck
Unlock for access to all 141 flashcards in this deck.
Unlock Deck
k this deck
8
One factor ANOVA stacked data for five groups will be arranged in five separate columns.
Unlock Deck
Unlock for access to all 141 flashcards in this deck.
Unlock Deck
k this deck
9
Sample sizes must be equal in one-factor ANOVA.
Unlock Deck
Unlock for access to all 141 flashcards in this deck.
Unlock Deck
k this deck
10
ANOVA assumes equal variances within each treatment group.
Unlock Deck
Unlock for access to all 141 flashcards in this deck.
Unlock Deck
k this deck
11
Tukey's test compares pairs of treatment means in an ANOVA.
Unlock Deck
Unlock for access to all 141 flashcards in this deck.
Unlock Deck
k this deck
12
Hartley's test is to check for unequal variances for c groups.
Unlock Deck
Unlock for access to all 141 flashcards in this deck.
Unlock Deck
k this deck
13
ANOVA assumes normal populations.
Unlock Deck
Unlock for access to all 141 flashcards in this deck.
Unlock Deck
k this deck
14
Interaction plots that show crossing lines indicate likely interactions.
Unlock Deck
Unlock for access to all 141 flashcards in this deck.
Unlock Deck
k this deck
15
If you have four factors (call them A,B,C,and D)in an ANOVA experiment with replication,you could have a maximum of four different two-factor interactions.
Unlock Deck
Unlock for access to all 141 flashcards in this deck.
Unlock Deck
k this deck
16
Interaction plots that show parallel lines would suggest interaction effects.
Unlock Deck
Unlock for access to all 141 flashcards in this deck.
Unlock Deck
k this deck
17
One-factor ANOVA is a procedure intended to compare the variances of c samples.
Unlock Deck
Unlock for access to all 141 flashcards in this deck.
Unlock Deck
k this deck
18
Comparison of c means in one-factor ANOVA can equivalently be done by using c individual t-tests on c pairs of means at the same α.
Unlock Deck
Unlock for access to all 141 flashcards in this deck.
Unlock Deck
k this deck
19
In a 3×4 randomized block (two-factor unreplicated)ANOVA,we have 12 treatment groups.
Unlock Deck
Unlock for access to all 141 flashcards in this deck.
Unlock Deck
k this deck
20
Tukey's test is similar to a two-sample t-test except that it pools the variances for all c samples.
Unlock Deck
Unlock for access to all 141 flashcards in this deck.
Unlock Deck
k this deck
21
Which of the following is not a characteristic of the F distribution?
A) It is always right-skewed.
B) It describes the ratio of two variances.
C) It is a family based on two sets of degrees of freedom.
D) It is negative when s12 is smaller than s22.
A) It is always right-skewed.
B) It describes the ratio of two variances.
C) It is a family based on two sets of degrees of freedom.
D) It is negative when s12 is smaller than s22.
Unlock Deck
Unlock for access to all 141 flashcards in this deck.
Unlock Deck
k this deck
22
Analysis of variance is a technique used to test for:
A) equality of two or more variances.
B) equality of two or more means.
C) equality of a population mean and a given value.
D) equality of more than two variances.
A) equality of two or more variances.
B) equality of two or more means.
C) equality of a population mean and a given value.
D) equality of more than two variances.
Unlock Deck
Unlock for access to all 141 flashcards in this deck.
Unlock Deck
k this deck
23
ANOVA is robust to violations of the equal-variance assumption as long as group sizes are equal.
Unlock Deck
Unlock for access to all 141 flashcards in this deck.
Unlock Deck
k this deck
24
Tukey's test for five groups would require 10 comparisons of means.
Unlock Deck
Unlock for access to all 141 flashcards in this deck.
Unlock Deck
k this deck
25
Tukey's test pools all the sample variances.
Unlock Deck
Unlock for access to all 141 flashcards in this deck.
Unlock Deck
k this deck
26
It is desirable,but not necessary,that sample sizes be equal in a one-factor ANOVA.
Unlock Deck
Unlock for access to all 141 flashcards in this deck.
Unlock Deck
k this deck
27
In an ANOVA,when would the F-test statistic be zero?
A) When there is no difference in the variances.
B) When the treatment means are the same.
C) When the observations are normally distributed.
D) The F-test statistic cannot ever be zero.
A) When there is no difference in the variances.
B) When the treatment means are the same.
C) When the observations are normally distributed.
D) The F-test statistic cannot ever be zero.
Unlock Deck
Unlock for access to all 141 flashcards in this deck.
Unlock Deck
k this deck
28
Degrees of freedom for the between-group variation in a one-factor ANOVA with n1 = 8,n2 = 5,n3 = 7,n4 = 9 would be:
A) 28.
B) 3.
C) 29.
A) 28.
B) 3.
C) 29.
Unlock Deck
Unlock for access to all 141 flashcards in this deck.
Unlock Deck
k this deck
29
Levene's test for homogeneity of variance is attractive because it does not depend on the assumption of normality.
Unlock Deck
Unlock for access to all 141 flashcards in this deck.
Unlock Deck
k this deck
30
ANOVA is used to compare:
A) proportions of several groups.
B) variances of several groups.
C) means of several groups.
D) both means and variances.
A) proportions of several groups.
B) variances of several groups.
C) means of several groups.
D) both means and variances.
Unlock Deck
Unlock for access to all 141 flashcards in this deck.
Unlock Deck
k this deck
31
Which is not assumed in ANOVA?
A) Observations are independent.
B) Populations are normally distributed.
C) Variances of all treatment groups are the same.
D) Population variances are known.
A) Observations are independent.
B) Populations are normally distributed.
C) Variances of all treatment groups are the same.
D) Population variances are known.
Unlock Deck
Unlock for access to all 141 flashcards in this deck.
Unlock Deck
k this deck
32
To test the null hypothesis H0: μ1 = μ2 = μ3 using samples from normal populations with unknown but equal variances,we:
A) cannot safely use ANOVA.
B) can safely employ ANOVA.
C) would prefer three separate t-tests.
D) would need three-factor ANOVA.
A) cannot safely use ANOVA.
B) can safely employ ANOVA.
C) would prefer three separate t-tests.
D) would need three-factor ANOVA.
Unlock Deck
Unlock for access to all 141 flashcards in this deck.
Unlock Deck
k this deck
33
In a one-factor ANOVA,the computed value of F will be negative:
A) when there is no difference in the treatment means.
B) when there is no difference within the treatments.
C) when the SST (total)is larger than SSE (error).
D) under no circumstances.
A) when there is no difference in the treatment means.
B) when there is no difference within the treatments.
C) when the SST (total)is larger than SSE (error).
D) under no circumstances.
Unlock Deck
Unlock for access to all 141 flashcards in this deck.
Unlock Deck
k this deck
34
Using one-factor ANOVA with 30 observations we find at α = .05 that we cannot reject the null hypothesis of equal means.We increase the sample size from 30 observations to 60 observations and obtain the same value for the sample F-test statistic.Which is correct?
A) We might now be able to reject the null hypothesis.
B) We surely must reject H0 for 60 observations.
C) We cannot reject H0 since we obtained the same F-value.
D) It is impossible to get the same F-value for n = 60 as for n = 30.
A) We might now be able to reject the null hypothesis.
B) We surely must reject H0 for 60 observations.
C) We cannot reject H0 since we obtained the same F-value.
D) It is impossible to get the same F-value for n = 60 as for n = 30.
Unlock Deck
Unlock for access to all 141 flashcards in this deck.
Unlock Deck
k this deck
35
Which is the Excel function to find the critical value of F for α = .05,df1 = 3,df2 = 25?
A) =F.DIST(.05,2,24)
B) =F.INV.RT(.05,3,25)
C) =F.DIST(.05,3,25)
D) =F.INV(.05,2,24)
A) =F.DIST(.05,2,24)
B) =F.INV.RT(.05,3,25)
C) =F.DIST(.05,3,25)
D) =F.INV(.05,2,24)
Unlock Deck
Unlock for access to all 141 flashcards in this deck.
Unlock Deck
k this deck
36
Tukey's test with seven groups would entail 21 comparisons of means.
Unlock Deck
Unlock for access to all 141 flashcards in this deck.
Unlock Deck
k this deck
37
In an ANOVA,the SSE (error)sum of squares reflects:
A) the effect of the combined factor(s).
B) the overall variation in Y that is to be explained.
C) the variation that is not explained by the factors.
D) the combined effect of treatments and sample size.
A) the effect of the combined factor(s).
B) the overall variation in Y that is to be explained.
C) the variation that is not explained by the factors.
D) the combined effect of treatments and sample size.
Unlock Deck
Unlock for access to all 141 flashcards in this deck.
Unlock Deck
k this deck
38
Which is not an assumption of ANOVA?
A) Normality of the treatment populations.
B) Homogeneous treatment variances.
C) Independent sample observations.
D) Equal population sizes for groups.
A) Normality of the treatment populations.
B) Homogeneous treatment variances.
C) Independent sample observations.
D) Equal population sizes for groups.
Unlock Deck
Unlock for access to all 141 flashcards in this deck.
Unlock Deck
k this deck
39
Which Excel function gives the right-tail p-value for an ANOVA test with a test statistic Fcalc = 4.52,n = 29 observations,and c = 4 groups?
A) =F.DIST.RT(4.52,3,25)
B) =F.INV(4.52,4,28)
C) =F.DIST(4.52,4,28)
D) =F.INV(4.52,3,25)
A) =F.DIST.RT(4.52,3,25)
B) =F.INV(4.52,4,28)
C) =F.DIST(4.52,4,28)
D) =F.INV(4.52,3,25)
Unlock Deck
Unlock for access to all 141 flashcards in this deck.
Unlock Deck
k this deck
40
Variation "within" the ANOVA treatments represents:
A) random variation.
B) differences between group means.
C) differences between group variances.
D) the effect of sample size.
A) random variation.
B) differences between group means.
C) differences between group variances.
D) the effect of sample size.
Unlock Deck
Unlock for access to all 141 flashcards in this deck.
Unlock Deck
k this deck
41
Refer to the following partial ANOVA results from Excel (some information is missing). The F-test statistic is:
A) 2.84.
B) 3.56.
C) 2.80.
D) 2.79.
The F-test statistic is:A) 2.84.
B) 3.56.
C) 2.80.
D) 2.79.
Unlock Deck
Unlock for access to all 141 flashcards in this deck.
Unlock Deck
k this deck
42
One-factor analysis of variance:
A) requires that the number of observations in each group be identical.
B) has less power when the number of observations per group is not identical.
C) is extremely sensitive to slight departures from normality.
D) is a generalization of the t-test for paired observations.
A) requires that the number of observations in each group be identical.
B) has less power when the number of observations per group is not identical.
C) is extremely sensitive to slight departures from normality.
D) is a generalization of the t-test for paired observations.
Unlock Deck
Unlock for access to all 141 flashcards in this deck.
Unlock Deck
k this deck
43
Refer to the following partial ANOVA results from Excel (some information is missing). The sample size is:
A) 20.
B) 23.
C) 24.
The sample size is:A) 20.
B) 23.
C) 24.
Unlock Deck
Unlock for access to all 141 flashcards in this deck.
Unlock Deck
k this deck
44
In a one-factor ANOVA,the total sum of squares is equal to:
A) the sum of squares within groups plus the sum of squares between groups.
B) the sum of squares within groups times the sum of squares between groups.
C) the sum of squares within groups divided by the sum of squares between groups.
D) the means of all the groups squared.
A) the sum of squares within groups plus the sum of squares between groups.
B) the sum of squares within groups times the sum of squares between groups.
C) the sum of squares within groups divided by the sum of squares between groups.
D) the means of all the groups squared.
Unlock Deck
Unlock for access to all 141 flashcards in this deck.
Unlock Deck
k this deck
45
The within-treatment variation reflects:
A) variation among individuals of the same group.
B) variation between individuals in different groups.
C) variation explained by factors included in the ANOVA model.
D) variation that is not part of the ANOVA model.
A) variation among individuals of the same group.
B) variation between individuals in different groups.
C) variation explained by factors included in the ANOVA model.
D) variation that is not part of the ANOVA model.
Unlock Deck
Unlock for access to all 141 flashcards in this deck.
Unlock Deck
k this deck
46
The Internal Revenue Service wishes to study the time required to process tax returns in three regional centers.A random sample of three tax returns is chosen from each of three centers.The time (in days)required to process each return is recorded as shown below. The test to use to compare the means for all three groups would require:
A) three-factor ANOVA.
B) one-factor ANOVA.
C) repeated two-sample test of means.
D) two-factor ANOVA with replication.
The test to use to compare the means for all three groups would require:A) three-factor ANOVA.
B) one-factor ANOVA.
C) repeated two-sample test of means.
D) two-factor ANOVA with replication.
Unlock Deck
Unlock for access to all 141 flashcards in this deck.
Unlock Deck
k this deck
47
The Internal Revenue Service wishes to study the time required to process tax returns in three regional centers.A random sample of three tax returns is chosen from each of three centers.The time (in days)required to process each return is recorded as shown below. Degrees of freedom for the between-groups sum of squares in the ANOVA would be:
A) 11.
B) 2.
C) 4.
Degrees of freedom for the between-groups sum of squares in the ANOVA would be:A) 11.
B) 2.
C) 4.
Unlock Deck
Unlock for access to all 141 flashcards in this deck.
Unlock Deck
k this deck
48
Refer to the following partial ANOVA results from Excel (some information is missing). Degrees of freedom for the F-test are:
A) 5,22.
B) 4,21.
C) 3,20.
D) impossible to determine.
Degrees of freedom for the F-test are:A) 5,22.
B) 4,21.
C) 3,20.
D) impossible to determine.
Unlock Deck
Unlock for access to all 141 flashcards in this deck.
Unlock Deck
k this deck
49
Systolic blood pressure of randomly selected HMO patients was recorded on a particular Wednesday,with the results shown here: The appropriate hypothesis test is:
A) one-factor ANOVA.
B) two-factor ANOVA.
C) three-factor ANOVA.
D) four-factor ANOVA.
The appropriate hypothesis test is:A) one-factor ANOVA.
B) two-factor ANOVA.
C) three-factor ANOVA.
D) four-factor ANOVA.
Unlock Deck
Unlock for access to all 141 flashcards in this deck.
Unlock Deck
k this deck
50
Prof.Gristmill sampled exam scores for five randomly chosen students from each of his two sections of ACC 200.His sample results are shown. He could test the population means for equality using:
A) a t-test for two means from independent samples.
B) a t-test for two means from paired (related)samples.
C) a one-factor ANOVA.
D) either a one-factor ANOVA or a two-tailed t-test.
He could test the population means for equality using:A) a t-test for two means from independent samples.
B) a t-test for two means from paired (related)samples.
C) a one-factor ANOVA.
D) either a one-factor ANOVA or a two-tailed t-test.
Unlock Deck
Unlock for access to all 141 flashcards in this deck.
Unlock Deck
k this deck
51
For this one-factor ANOVA (some information is missing),what is the F-test statistic?
A) 0.159
B) 2.833
C) 1.703
D) Cannot be determined
A) 0.159
B) 2.833
C) 1.703
D) Cannot be determined
Unlock Deck
Unlock for access to all 141 flashcards in this deck.
Unlock Deck
k this deck
52
Identify the degrees of freedom for the treatment and error in this one-factor ANOVA (blanks indicate missing information).
A) 4,24
B) 3,20
C) 5,23
A) 4,24
B) 3,20
C) 5,23
Unlock Deck
Unlock for access to all 141 flashcards in this deck.
Unlock Deck
k this deck
53
For this one-factor ANOVA (some information is missing),how many treatment groups were there?
A) Cannot be determined
B) 3
C) 4
D) 2
A) Cannot be determined
B) 3
C) 4
D) 2
Unlock Deck
Unlock for access to all 141 flashcards in this deck.
Unlock Deck
k this deck
54
Refer to the following partial ANOVA results from Excel (some information is missing). Degrees of freedom for between groups variation are:
A) 3.
B) 4.
C) 5.
D) Can't tell from given information.
Degrees of freedom for between groups variation are:A) 3.
B) 4.
C) 5.
D) Can't tell from given information.
Unlock Deck
Unlock for access to all 141 flashcards in this deck.
Unlock Deck
k this deck
55
Refer to the following partial ANOVA results from Excel (some information is missing). At α = 0.05,the difference between group means is:
A) highly significant.
B) barely significant.
C) not quite significant.
D) clearly insignificant.
At α = 0.05,the difference between group means is:A) highly significant.
B) barely significant.
C) not quite significant.
D) clearly insignificant.
Unlock Deck
Unlock for access to all 141 flashcards in this deck.
Unlock Deck
k this deck
56
Refer to the following partial ANOVA results from Excel (some information is missing). SS for between groups variation will be:
A) 129.99.
B) 630.83.
C) 1233.4.
D) Can't tell.
SS for between groups variation will be:A) 129.99.
B) 630.83.
C) 1233.4.
D) Can't tell.
Unlock Deck
Unlock for access to all 141 flashcards in this deck.
Unlock Deck
k this deck
57
Refer to the following partial ANOVA results from Excel (some information is missing). The critical value of F at α = 0.05 is:
A) 1.645.
B) 2.84.
C) 3.10.
D) 4.28.
The critical value of F at α = 0.05 is:A) 1.645.
B) 2.84.
C) 3.10.
D) 4.28.
Unlock Deck
Unlock for access to all 141 flashcards in this deck.
Unlock Deck
k this deck
58
Refer to the following partial ANOVA results from Excel (some information is missing). The number of treatment groups is:
A) 4.
B) 3.
C) 2.
D)
The number of treatment groups is:A) 4.
B) 3.
C) 2.
D)
Unlock Deck
Unlock for access to all 141 flashcards in this deck.
Unlock Deck
k this deck
59
Given the following ANOVA table (some information is missing),find the critical value of F.05.
A) 3.06
B) 2.90
C) 2.36
D) 3.41
A) 3.06
B) 2.90
C) 2.36
D) 3.41
Unlock Deck
Unlock for access to all 141 flashcards in this deck.
Unlock Deck
k this deck
60
Given the following ANOVA table (some information is missing),find the F statistic.
A) 3.71
B) 0.99
C) 0.497
D) 4.02
A) 3.71
B) 0.99
C) 0.497
D) 4.02
Unlock Deck
Unlock for access to all 141 flashcards in this deck.
Unlock Deck
k this deck
61
Refer to the following partial ANOVA results from Excel (some information is missing). ANOVA Table The number of treatment groups is:
A) 5.
B) 4.
C) 3.
D) impossible to ascertain from given.
The number of treatment groups is:A) 5.
B) 4.
C) 3.
D) impossible to ascertain from given.
Unlock Deck
Unlock for access to all 141 flashcards in this deck.
Unlock Deck
k this deck
62
Refer to the following partial ANOVA results from Excel (some information is missing). The number of observations in the entire sample is:
A) 20.
B) 19.
C)
The number of observations in the entire sample is:A) 20.
B) 19.
C)
Unlock Deck
Unlock for access to all 141 flashcards in this deck.
Unlock Deck
k this deck
63
Systolic blood pressure of randomly selected HMO patients was recorded on a particular Wednesday,with the results shown here.An ANOVA test was performed using these data. What are the degrees of freedom for the error sum of squares?
A) 3
B) 19
C) 16
D) It depends on α.
What are the degrees of freedom for the error sum of squares?A) 3
B) 19
C) 16
D) It depends on α.
Unlock Deck
Unlock for access to all 141 flashcards in this deck.
Unlock Deck
k this deck
64
Refer to the following partial ANOVA results from Excel (some information is missing). ANOVA Table The number of observations in the original sample was:
A) 59.
B) 60.
C) 58.
The number of observations in the original sample was:A) 59.
B) 60.
C) 58.
Unlock Deck
Unlock for access to all 141 flashcards in this deck.
Unlock Deck
k this deck
65
Refer to the following partial ANOVA results from Excel (some information is missing). The MS (mean square)for the treatments is:
A) 239.13.
B) 106.88.
C) 1,130.8.
D) impossible to ascertain from the information given.
The MS (mean square)for the treatments is:A) 239.13.
B) 106.88.
C) 1,130.8.
D) impossible to ascertain from the information given.
Unlock Deck
Unlock for access to all 141 flashcards in this deck.
Unlock Deck
k this deck
66
To compare the cost of three shipping methods,a random sample of four shipments is taken for each of three firms.The cost per shipment is shown below. In a one-factor ANOVA,degrees of freedom for the between-groups sum of squares will be:
A) 11.
B) 3.
C) 2.
In a one-factor ANOVA,degrees of freedom for the between-groups sum of squares will be:A) 11.
B) 3.
C) 2.
Unlock Deck
Unlock for access to all 141 flashcards in this deck.
Unlock Deck
k this deck
67
Refer to the following partial ANOVA results from Excel (some information is missing). Our decision about the hypothesis of equal treatment means is that the null hypothesis:
A) cannot be rejected at α = .05.
B) can be rejected at α = .05.
C) can be rejected for any typical value of α.
D) cannot be assessed from the given information.
Our decision about the hypothesis of equal treatment means is that the null hypothesis:A) cannot be rejected at α = .05.
B) can be rejected at α = .05.
C) can be rejected for any typical value of α.
D) cannot be assessed from the given information.
Unlock Deck
Unlock for access to all 141 flashcards in this deck.
Unlock Deck
k this deck
68
Refer to the following partial ANOVA results from Excel (some information is missing). The F statistic is:
A) 4.87.
B) 3.38.
C) 5.93.
D) 6.91.
The F statistic is:A) 4.87.
B) 3.38.
C) 5.93.
D) 6.91.
Unlock Deck
Unlock for access to all 141 flashcards in this deck.
Unlock Deck
k this deck
69
Systolic blood pressure of randomly selected HMO patients was recorded on a particular Wednesday,with the results shown here.An ANOVA test was performed using these data. Degrees of freedom for the between-treatments sum of squares would be:
A) 3.
B) 19.
C) 17.
D) depends on α.
Degrees of freedom for the between-treatments sum of squares would be:A) 3.
B) 19.
C) 17.
D) depends on α.
Unlock Deck
Unlock for access to all 141 flashcards in this deck.
Unlock Deck
k this deck
70
To compare the cost of three shipping methods,a random sample of four shipments is taken for each of three firms.The cost per shipment is shown below. In a one-factor ANOVA,degrees of freedom for the within-groups sum of squares will be:
A) 11.
B) 3.
C) 9.
In a one-factor ANOVA,degrees of freedom for the within-groups sum of squares will be:A) 11.
B) 3.
C) 9.
Unlock Deck
Unlock for access to all 141 flashcards in this deck.
Unlock Deck
k this deck
71
Refer to the following partial ANOVA results from Excel (some information is missing). ANOVA Table The F statistic is:
A) 2.88.
B) 4.87.
C) 5.93.
D) 6.91.
The F statistic is:A) 2.88.
B) 4.87.
C) 5.93.
D) 6.91.
Unlock Deck
Unlock for access to all 141 flashcards in this deck.
Unlock Deck
k this deck
72
What is the .05 critical value of Tukey's test statistic for a one-factor ANOVA with n1 = 6,n2 = 6,n3 = 6? Note: This question requires access to a Tukey table.
A) 3.67
B) 2.60
C) 3.58
D) 2.75
A) 3.67
B) 2.60
C) 3.58
D) 2.75
Unlock Deck
Unlock for access to all 141 flashcards in this deck.
Unlock Deck
k this deck
73
Refer to the following MegaStat output (some information is missing).The sample size was n = 65 in a one-factor ANOVA. At α = .05,which is the critical value of the test statistic for a two-tailed test for a significant difference in means that are to be compared simultaneously? Note: This question requires a Tukey table.
A) 2.81
B) 2.54
C) 2.33
D) 1.96
At α = .05,which is the critical value of the test statistic for a two-tailed test for a significant difference in means that are to be compared simultaneously? Note: This question requires a Tukey table.A) 2.81
B) 2.54
C) 2.33
D) 1.96
Unlock Deck
Unlock for access to all 141 flashcards in this deck.
Unlock Deck
k this deck
74
Refer to the following MegaStat output (some information is missing).The sample size was n = 24 in a one-factor ANOVA. At α = .05,what is the critical value of the Tukey test statistic for a two-tailed test for a significant difference in means that are to be compared simultaneously? Note: This question requires access to a Tukey table.
A) 2.07
B) 2.80
C) 2.76
D) 1.96
At α = .05,what is the critical value of the Tukey test statistic for a two-tailed test for a significant difference in means that are to be compared simultaneously? Note: This question requires access to a Tukey table.A) 2.07
B) 2.80
C) 2.76
D) 1.96
Unlock Deck
Unlock for access to all 141 flashcards in this deck.
Unlock Deck
k this deck
75
Refer to the following MegaStat output (some information is missing).The sample size was n = 65 in a one-factor ANOVA. Which pairs of days differ significantly? Note: This question requires access to a Tukey table.
A) (Mon,Thu)and (Mon,Wed)only.
B) (Mon,Wed)only.
C) (Mon,Thu)only.
D) (Mon,Thu)and (Mon,Wed)and (Mon,Fri)and (Mon,Tue).
Which pairs of days differ significantly? Note: This question requires access to a Tukey table.A) (Mon,Thu)and (Mon,Wed)only.
B) (Mon,Wed)only.
C) (Mon,Thu)only.
D) (Mon,Thu)and (Mon,Wed)and (Mon,Fri)and (Mon,Tue).
Unlock Deck
Unlock for access to all 141 flashcards in this deck.
Unlock Deck
k this deck
76
What is the .05 critical value of Hartley's test statistic for a one-factor ANOVA with n1 = 5,n2 = 8,n3 = 7,n4 = 8,n5 = 6,n6 = 8? Note: This question requires access to a Hartley table.
A) 10.8
B) 11.8
C) 13.7
D) 15.0
A) 10.8
B) 11.8
C) 13.7
D) 15.0
Unlock Deck
Unlock for access to all 141 flashcards in this deck.
Unlock Deck
k this deck
77
Sound levels are measured at random moments under typical driving conditions for various full-size truck models.The ANOVA results are shown below. The test statistic for Hartley's test for homogeneity of variance is:
A) 2.25.
B) 5.04.
C) 4.61.
D) 4.45.
The test statistic for Hartley's test for homogeneity of variance is:A) 2.25.
B) 5.04.
C) 4.61.
D) 4.45.
Unlock Deck
Unlock for access to all 141 flashcards in this deck.
Unlock Deck
k this deck
78
Refer to the following MegaStat output (some information is missing).The sample size was n = 24 in a one-factor ANOVA. Which pairs of meds differ at α = .05? Note: This question requires access to a Tukey table.
A) Med 1,Med 2
B) Med 2,Med 4
C) Med 3,Med 4
D) None of them.
Which pairs of meds differ at α = .05? Note: This question requires access to a Tukey table.A) Med 1,Med 2
B) Med 2,Med 4
C) Med 3,Med 4
D) None of them.
Unlock Deck
Unlock for access to all 141 flashcards in this deck.
Unlock Deck
k this deck
79
Sound levels are measured at random moments under typical driving conditions for various full-size truck models.The Excel ANOVA results are shown below. The test statistic to compare the five means simultaneously is:
A) 2.96.
B) 15.8.
C) 5.56.
D) 4.45.
The test statistic to compare the five means simultaneously is:A) 2.96.
B) 15.8.
C) 5.56.
D) 4.45.
Unlock Deck
Unlock for access to all 141 flashcards in this deck.
Unlock Deck
k this deck
80
To compare the cost of three shipping methods,a random sample of four shipments is taken for each of three firms.The cost per shipment is shown below. Degrees of freedom for the total sum of squares in a one-factor ANOVA would be:
A) 11.
B) 8.
C) 2.
Degrees of freedom for the total sum of squares in a one-factor ANOVA would be:A) 11.
B) 8.
C) 2.
Unlock Deck
Unlock for access to all 141 flashcards in this deck.
Unlock Deck
k this deck
Unlock Deck
Unlock for access to all 141 flashcards in this deck.


