Deck 10: Two-Sample Hypothesis Tests
Full screen (f)
Question
Question
Question
Question
Question
Question
Question
Question
Question
Question
Question
Question
Question
Question
Question
Question
Question
Question
Question
Question
Question
John wants to compare two means.His sample statistics were ![<strong>John wants to compare two means.His sample statistics were 1 = 22.7,s12 = 5.4,n1 = 9 and 2 = 20.5,s22 = 3.6,n2 = 9.Assuming equal variances,which is the approximate 95 percent confidence interval for the difference of the population means?</strong> A)[2.44,6.19] B)[1.17,5.08] C)[0.08,4.32] D)[−0.09,3.19] <div style=padding-top: 35px>](https://d2lvgg3v3hfg70.cloudfront.net/TB6743/11eaab07_12f2_47ae_acdb_fd73a8797215_TB6743_11.jpg) 1 = 22.7,s12 = 5.4,n1 = 9 and
1 = 22.7,s12 = 5.4,n1 = 9 and ![<strong>John wants to compare two means.His sample statistics were 1 = 22.7,s12 = 5.4,n1 = 9 and 2 = 20.5,s22 = 3.6,n2 = 9.Assuming equal variances,which is the approximate 95 percent confidence interval for the difference of the population means?</strong> A)[2.44,6.19] B)[1.17,5.08] C)[0.08,4.32] D)[−0.09,3.19] <div style=padding-top: 35px>](https://d2lvgg3v3hfg70.cloudfront.net/TB6743/11eaab07_12f2_6ebf_acdb_493a14c1d3f4_TB6743_11.jpg) 2 = 20.5,s22 = 3.6,n2 = 9.Assuming equal variances,which is the approximate 95 percent confidence interval for the difference of the population means?
2 = 20.5,s22 = 3.6,n2 = 9.Assuming equal variances,which is the approximate 95 percent confidence interval for the difference of the population means?
A)[2.44,6.19]
B)[1.17,5.08]
C)[0.08,4.32]
D)[−0.09,3.19]
1 = 22.7,s12 = 5.4,n1 = 9 and 2 = 20.5,s22 = 3.6,n2 = 9.Assuming equal variances,which is the approximate 95 percent confidence interval for the difference of the population means?A)[2.44,6.19]
B)[1.17,5.08]
C)[0.08,4.32]
D)[−0.09,3.19]
Question
Question
Question
Question
Kate wants to compare two means.Her sample statistics were  1 = 22.7,s12 = 5.4,n1 = 9 and
  2 = 20.5,s22 = 3.6,n2 = 9.Assuming equal variances,the degrees of freedom for his test will be
A)16
B)18
C)9
D)8
1 = 22.7,s12 = 5.4,n1 = 9 and 2 = 20.5,s22 = 3.6,n2 = 9.Assuming equal variances,the degrees of freedom for his test will beA)16
B)18
C)9
D)8
Question
Question
Question
Question
Question
Question
Question
Question
Question
Question
Kate wants to compare two means.Her sample statistics were  1 = 22.7,s12 = 5.4,n1 = 9 and
  2 =20.5,s22 = 3.6,n2 = 9 .Assuming equal variances,the pooled variance is
A)4.5
B)4.9
C)5.1
D)3.8
1 = 22.7,s12 = 5.4,n1 = 9 and 2 =20.5,s22 = 3.6,n2 = 9 .Assuming equal variances,the pooled variance isA)4.5
B)4.9
C)5.1
D)3.8
Question
Question
Question
Question
Question
Question
Question
Question
Question
Question
Question
Question
Question
Question
Question
Question
Question
Question
Question
Question
Question
Question
Management of Melodic Kortholt Company compared absenteeism rates in two plants on the third Monday in November.Of Plant A's 800 employees,120 were absent.Of Plant B's 1200 employees,144 were absent.MegaStat's results for a two-tailed test are shown below.  At α = .05,the two-tailed test for a difference in proportions is
A)just barely significant.
B)not quite significant.
C)not feasible due to nonnormality.
At α = .05,the two-tailed test for a difference in proportions isA)just barely significant.
B)not quite significant.
C)not feasible due to nonnormality.
Question
Management of Melodic Kortholt Company compared absenteeism rates in two plants on the third Monday in November.Of Plant A's 800 employees,120 were absent.Of Plant B's 1200 employees,144 were absent.MegaStat's results for a two-tailed test are shown below.  The test statistic (shown as z = x.xx)is approximately
A)2.022
B)1.960
C)1.942
D)1.645
The test statistic (shown as z = x.xx)is approximatelyA)2.022
B)1.960
C)1.942
D)1.645
Question
Question
Question
Question
Question
Question
Question
Mary analyzed occupancy rates at two community hospitals and obtained the following Excel results.  Which conclusion is correct in a two-tailed test at α = .05?
A)There appears to be no difference in the mean occupancy rates.
B)HealthPro has a significantly higher mean occupancy rate.
C)There is a significant difference in the mean occupancy rates.
Which conclusion is correct in a two-tailed test at α = .05?A)There appears to be no difference in the mean occupancy rates.
B)HealthPro has a significantly higher mean occupancy rate.
C)There is a significant difference in the mean occupancy rates.
Question
Question
Nacirema Airlines is buying a fleet of new fuel-efficient planes.The HogJet and the LitheJet both meet their price and performance needs,and both planes meet EPA noise guidelines.However,the quieter plane is preferred.Each plane is flown through a typical takeoff and landing sequence 10 times,while remote sensors at ground level record the noise levels (in decibels).The table below summarizes the sound level tests using Excel's default level of significance (α = .05). 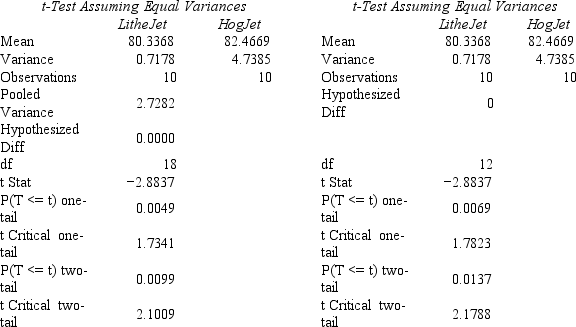 After inspecting this table,we would most likely
A)use the test assuming unequal variances.
B)use the test for equal variances.
C)perform another test to determine if the variances are equal before proceeding.
D)realize that the decision is not affected by our assumptions concerning the variance.
After inspecting this table,we would most likelyA)use the test assuming unequal variances.
B)use the test for equal variances.
C)perform another test to determine if the variances are equal before proceeding.
D)realize that the decision is not affected by our assumptions concerning the variance.
Question
Question
Mary did an analysis of acute care variances in samples of occupancy rates at two community hospitals and obtained the following results:  Can Mary conclude that the variances are unequal at α = 0.05?
A)No,there is not enough evidence to believe the variances are unequal.
B)Yes,the analysis shows that the variances are unequal.
C)You cannot tell without knowing the sample sizes.
Can Mary conclude that the variances are unequal at α = 0.05?A)No,there is not enough evidence to believe the variances are unequal.
B)Yes,the analysis shows that the variances are unequal.
C)You cannot tell without knowing the sample sizes.
Question
Question
Question
Nacirema Airlines is buying a fleet of new fuel-efficient planes.The HogJet and the LitheJet both meet their price and performance needs,and both planes meet EPA noise guidelines.However,the quieter plane is preferred.Each plane is flown through a typical takeoff and landing sequence 10 times,while remote sensors at ground level record the noise levels (in decibels).The table below summarizes the sound level tests using Excel's default level of significance (α = .05).  In a left-tailed test comparing the means at α = .05,we would
A)not reject H0.
B)reject H0.
C)have insufficient information to make a decision.
In a left-tailed test comparing the means at α = .05,we wouldA)not reject H0.
B)reject H0.
C)have insufficient information to make a decision.
Question
Nacirema Airlines is buying a fleet of new fuel-efficient planes.The HogJet and the LitheJet both meet their price and performance needs,and both planes meet EPA noise guidelines.However,the quieter plane is preferred.Each plane is flown through a typical takeoff and landing sequence 10 times,while remote sensors at ground level record the noise levels (in decibels).The table below summarizes the sound level tests using Excel's default level of significance (α = .05). 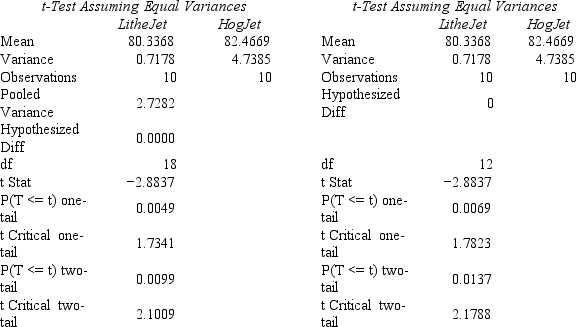 If we switched from α = 0.05 to α = 0.005 in a two-tailed test of means,our assumption about variances (assumed equal or assumed unequal)would
A)affect the decision.
B)not affect the decision.
C)require a new analysis.
If we switched from α = 0.05 to α = 0.005 in a two-tailed test of means,our assumption about variances (assumed equal or assumed unequal)wouldA)affect the decision.
B)not affect the decision.
C)require a new analysis.
Question
A certain psychological theory predicts that men want bigger families than women.Kate asked each student in her psychology class how many children he or she considered ideal for a married couple and obtained the Excel results shown below at α = .05.  What conclusion can you draw in a two-tailed test at α = .05?
A)Men want larger families on average than women.
B)Women want larger families on average than men.
C)We cannot reject the hypothesis of equal population means.
D)The decision depends on whether or not the variances are equal.
What conclusion can you draw in a two-tailed test at α = .05?A)Men want larger families on average than women.
B)Women want larger families on average than men.
C)We cannot reject the hypothesis of equal population means.
D)The decision depends on whether or not the variances are equal.
Question
Randomly chosen MBA students were asked their opinions about the ideal number of children for a married couple.The sample data were entered into MegaStat,and the following results were produced.  What conclusion can you draw from this analysis at α = .05?
A)Men want larger families on average than women.
B)Women want larger families on average than men.
C)This is insufficient evidence to suggest a difference in means.
D)We could conclude that men want larger families if we used a two-tailed test.
What conclusion can you draw from this analysis at α = .05?A)Men want larger families on average than women.
B)Women want larger families on average than men.
C)This is insufficient evidence to suggest a difference in means.
D)We could conclude that men want larger families if we used a two-tailed test.
Question
Question
Question
Litter sizes (number of pups)for randomly chosen dogs from two breeds were compared.The sample data were entered into Excel,and the following results were produced.  What is the p-value for a left-tailed test comparing the means at α = .05?
A)Less than .10
B)More than .10
C)Between .10 and .05
D)Between .05 and .01
What is the p-value for a left-tailed test comparing the means at α = .05?A)Less than .10
B)More than .10
C)Between .10 and .05
D)Between .05 and .01
Question
Randomly chosen MBA students were asked their opinions about the ideal number of children for a married couple.The sample data were entered into MegaStat,and the following results were produced.  To compare the means,would it be appropriate to use a test that assumes equal variances?
A)Yes,because by pooling our variances,we can simplify our calculations.
B)Yes,we should assume equal variances when comparing independent samples.
C)No,because the sample statistics show that the variances are unequal at α = 0.05.
D)No,because the variances will differ because the means differ significantly.
To compare the means,would it be appropriate to use a test that assumes equal variances?A)Yes,because by pooling our variances,we can simplify our calculations.
B)Yes,we should assume equal variances when comparing independent samples.
C)No,because the sample statistics show that the variances are unequal at α = 0.05.
D)No,because the variances will differ because the means differ significantly.
Question
Litter sizes (number of pups)for randomly chosen dogs from two breeds were compared.The sample data were entered into Excel,and the following results were produced.  What is the critical value for a left-tailed test comparing the means at α = 0.05?
A)−1.645
B)−1.721
C)−1.703
D)−1.699
What is the critical value for a left-tailed test comparing the means at α = 0.05?A)−1.645
B)−1.721
C)−1.703
D)−1.699

Unlock Deck
Sign up to unlock the cards in this deck!
Unlock Deck
Unlock Deck
1/116
Play
Full screen (f)
Deck 10: Two-Sample Hypothesis Tests
1
The critical value in an F test for equal variances is the ratio of the sample variances.
False
2
The F distribution is never negative and is always skewed right.
True
3
In comparing the means of two independent samples,if the test statistic indicates a significant difference at α =.05,it will also be significant at α = .10.
True
4
In general,the Welch-Satterthwaite t-test for two means has the same degrees of freedom as the pooled samples t-test for two means.
Unlock Deck
Unlock for access to all 116 flashcards in this deck.
Unlock Deck
k this deck
5
We could use the same data set for two independent samples (i.e. ,two columns of data)either to compare the means (t-test)or to compare the variances (F test).
Unlock Deck
Unlock for access to all 116 flashcards in this deck.
Unlock Deck
k this deck
6
When testing the difference between two population proportions,it is necessary to use the same size sample from each population.
Unlock Deck
Unlock for access to all 116 flashcards in this deck.
Unlock Deck
k this deck
7
When sample data occur in pairs,an advantage of choosing a paired t-test is that it tends to increase the power of a test,as compared to treating each sample independently.
Unlock Deck
Unlock for access to all 116 flashcards in this deck.
Unlock Deck
k this deck
8
The difference between two sample proportions p1 − p2 may be assumed normally distributed if each sample has at least 10 "successes" and 10 "failures."
Unlock Deck
Unlock for access to all 116 flashcards in this deck.
Unlock Deck
k this deck
9
The degrees of freedom for the t-test used to compare two population means (independent samples)with unknown variances (assumed equal)will be n1 + n2 − 2.
Unlock Deck
Unlock for access to all 116 flashcards in this deck.
Unlock Deck
k this deck
10
The t-test for two samples of paired data will use n differences,making it a one-sample t-test.
Unlock Deck
Unlock for access to all 116 flashcards in this deck.
Unlock Deck
k this deck
11
In conducting a paired t-test of the difference between two population means,the usual null hypothesis is that the mean of the population of paired differences is zero.
Unlock Deck
Unlock for access to all 116 flashcards in this deck.
Unlock Deck
k this deck
12
When using independent samples to test the difference between two population means,a pooled variance is used if the population variances are unknown and assumed equal.
Unlock Deck
Unlock for access to all 116 flashcards in this deck.
Unlock Deck
k this deck
13
A paired t-test with two columns of 10 observations in each column would use d.f.= 18.
Unlock Deck
Unlock for access to all 116 flashcards in this deck.
Unlock Deck
k this deck
14
The test statistic in an F test for equal variances is the ratio of the sample variances.
Unlock Deck
Unlock for access to all 116 flashcards in this deck.
Unlock Deck
k this deck
15
In an F test for the ratio of two population variances,the degrees of freedom in both the numerator and the denominator must be equal.
Unlock Deck
Unlock for access to all 116 flashcards in this deck.
Unlock Deck
k this deck
16
The Welch-Satterthwaite test is more conservative than the pooled variance test to compare two population means with unknown variances in independent samples.
Unlock Deck
Unlock for access to all 116 flashcards in this deck.
Unlock Deck
k this deck
17
A pooled proportion is calculated by giving each sample proportion an equal weight.
Unlock Deck
Unlock for access to all 116 flashcards in this deck.
Unlock Deck
k this deck
18
When using independent samples to test the difference between two population means,it is desirable but not necessary for the sample sizes to be the same.
Unlock Deck
Unlock for access to all 116 flashcards in this deck.
Unlock Deck
k this deck
19
The F test is used to test for the equality of two population variances.
Unlock Deck
Unlock for access to all 116 flashcards in this deck.
Unlock Deck
k this deck
20
When the variances are known,a test comparing two independent sample means would use the normal distribution.
Unlock Deck
Unlock for access to all 116 flashcards in this deck.
Unlock Deck
k this deck
21
John wants to compare two means.His sample statistics were 1 = 22.7,s12 = 5.4,n1 = 9 and 2 = 20.5,s22 = 3.6,n2 = 9.Assuming equal variances,which is the approximate 95 percent confidence interval for the difference of the population means?
A)[2.44,6.19]
B)[1.17,5.08]
C)[0.08,4.32]
D)[−0.09,3.19]
1 = 22.7,s12 = 5.4,n1 = 9 and 2 = 20.5,s22 = 3.6,n2 = 9.Assuming equal variances,which is the approximate 95 percent confidence interval for the difference of the population means?A)[2.44,6.19]
B)[1.17,5.08]
C)[0.08,4.32]
D)[−0.09,3.19]
Unlock Deck
Unlock for access to all 116 flashcards in this deck.
Unlock Deck
k this deck
22
In a test for equality of two proportions,the sample proportions were p1 = 12/50 and p2 = 18/50.The test statistic is
A)−1.44
B)−1.31
C)−1.67
D)Impossible to determine without knowing α.
A)−1.44
B)−1.31
C)−1.67
D)Impossible to determine without knowing α.
Unlock Deck
Unlock for access to all 116 flashcards in this deck.
Unlock Deck
k this deck
23
If the sample proportions are p1 = 6/90 and p2 =4/100,normality may be assumed in a test comparing the two population proportions.
Unlock Deck
Unlock for access to all 116 flashcards in this deck.
Unlock Deck
k this deck
24
If the population variances are exactly equal,the sample F test statistic will be zero.
Unlock Deck
Unlock for access to all 116 flashcards in this deck.
Unlock Deck
k this deck
25
Kate wants to compare two means.Her sample statistics were 1 = 22.7,s12 = 5.4,n1 = 9 and 2 = 20.5,s22 = 3.6,n2 = 9.Assuming equal variances,the degrees of freedom for his test will be
A)16
B)18
C)9
D)8
1 = 22.7,s12 = 5.4,n1 = 9 and 2 = 20.5,s22 = 3.6,n2 = 9.Assuming equal variances,the degrees of freedom for his test will beA)16
B)18
C)9
D)8
Unlock Deck
Unlock for access to all 116 flashcards in this deck.
Unlock Deck
k this deck
26
In a right-tailed test comparing two means with known variances,the sample sizes were n1 = 8 and n2 = 12.At α = .05,the critical value would be
A)1.960
B)1.645
C)1.734
D)1.282
A)1.960
B)1.645
C)1.734
D)1.282
Unlock Deck
Unlock for access to all 116 flashcards in this deck.
Unlock Deck
k this deck
27
When the variances are unknown,a test comparing two independent sample means would use the Student's t distribution.
Unlock Deck
Unlock for access to all 116 flashcards in this deck.
Unlock Deck
k this deck
28
If the sample proportions are p1 = 15/60 and p2 = 20/90,normality may be assumed in a test comparing the two population proportions.
Unlock Deck
Unlock for access to all 116 flashcards in this deck.
Unlock Deck
k this deck
29
In a right-tailed test comparing two proportions,the test statistic was zcalc = +1.81.The p-value is
A).9649
B).0351
C).4649
D)Must know n to answer.
A).9649
B).0351
C).4649
D)Must know n to answer.
Unlock Deck
Unlock for access to all 116 flashcards in this deck.
Unlock Deck
k this deck
30
In a left-tailed test comparing two means with variances unknown but assumed to be equal,the sample sizes were n1 = 8 and n2 = 12.At α = .05,the critical value would be
A)−1.960
B)−2.101
C)−1.734
D)−1.645
A)−1.960
B)−2.101
C)−1.734
D)−1.645
Unlock Deck
Unlock for access to all 116 flashcards in this deck.
Unlock Deck
k this deck
31
A paired t-test with two columns of 8 observations in each column would use d.f.= 7.
Unlock Deck
Unlock for access to all 116 flashcards in this deck.
Unlock Deck
k this deck
32
In a random sample of patient records in Cutter Memorial Hospital,six-month postoperative exams were given in 90 out of 200 cases,while in Paymor Hospital such exams were given in 110 out of 200 cases.The pooled proportion is
A).50
B).40
C).30
D).20
A).50
B).40
C).30
D).20
Unlock Deck
Unlock for access to all 116 flashcards in this deck.
Unlock Deck
k this deck
33
In a left-tailed test comparing two means with unknown variances assumed to be equal,the test statistic was t = −1.81 with sample sizes of n1 = 8 and n2 = 12.The p-value would be
A)between .025 and .05.
B)between .01 and .025.
C)between .05 and .10.
D)Must know α to answer.
A)between .025 and .05.
B)between .01 and .025.
C)between .05 and .10.
D)Must know α to answer.
Unlock Deck
Unlock for access to all 116 flashcards in this deck.
Unlock Deck
k this deck
34
In a random sample of patient records in Cutter Memorial Hospital,six-month postoperative exams were given in 90 out of 200 prostatectomy patients,while in Paymor Hospital such exams were given in 110 out of 200 cases.In a left-tailed test for equality of proportions,the p-value is
A).9772
B).0228
C).4772
D).0517
A).9772
B).0228
C).4772
D).0517
Unlock Deck
Unlock for access to all 116 flashcards in this deck.
Unlock Deck
k this deck
35
Kate wants to compare two means.Her sample statistics were 1 = 22.7,s12 = 5.4,n1 = 9 and 2 =20.5,s22 = 3.6,n2 = 9 .Assuming equal variances,the pooled variance is
A)4.5
B)4.9
C)5.1
D)3.8
1 = 22.7,s12 = 5.4,n1 = 9 and 2 =20.5,s22 = 3.6,n2 = 9 .Assuming equal variances,the pooled variance isA)4.5
B)4.9
C)5.1
D)3.8
Unlock Deck
Unlock for access to all 116 flashcards in this deck.
Unlock Deck
k this deck
36
Management of Melodic Kortholt Company compared absenteeism rates in two plants on the third Monday in November.Of Plant A's 800 employees,120 were absent.Of Plant B's 1200 employees,144 were absent.To compare the two proportions,the pooled proportion is
A).130
B).140
C).132
D).135
A).130
B).140
C).132
D).135
Unlock Deck
Unlock for access to all 116 flashcards in this deck.
Unlock Deck
k this deck
37
In a test for equality of two proportions,the sample proportions were p1 = 12/50 and p2 = 18/50.The pooled proportion is
A).20
B).24
C).36
D).30
A).20
B).24
C).36
D).30
Unlock Deck
Unlock for access to all 116 flashcards in this deck.
Unlock Deck
k this deck
38
In a random sample of patient records in Cutter Memorial Hospital,six-month postoperative exams were given in 90 out of 200 prostatectomy patients,while in Paymor Hospital such exams were given in 110 out of 200 cases.In a left-tailed test for equality of proportions,the test statistic is
A)−1.96
B)−2.00
C)−4.00
D)−3.48
A)−1.96
B)−2.00
C)−4.00
D)−3.48
Unlock Deck
Unlock for access to all 116 flashcards in this deck.
Unlock Deck
k this deck
39
If the sample proportions were p1 = 12/50 and p2 = 18/50,what is the approximate 95 percent confidence interval for the difference of the population proportions?
A)[−.144,+.244]
B)[−.120,+.120]
C)[−.298,+.058]
D)[−.011,.214]
A)[−.144,+.244]
B)[−.120,+.120]
C)[−.298,+.058]
D)[−.011,.214]
Unlock Deck
Unlock for access to all 116 flashcards in this deck.
Unlock Deck
k this deck
40
In a random sample of patient records in Cutter Memorial Hospital,six-month postoperative exams were given in 90 out of 200 prostatectomy patients,while in Paymor Hospital such exams were given in 110 out of 200 cases.In comparing these two proportions,normality of the difference may be assumed because
A)the populations are large enough to be assumed normal.
B)the probability of success can reasonably be assumed constant.
C)the samples are random,so the proportions are unbiased estimates.
D)nπ ≥ 10 and n(1 − π)≥ 10 for each sample taken separately.
A)the populations are large enough to be assumed normal.
B)the probability of success can reasonably be assumed constant.
C)the samples are random,so the proportions are unbiased estimates.
D)nπ ≥ 10 and n(1 − π)≥ 10 for each sample taken separately.
Unlock Deck
Unlock for access to all 116 flashcards in this deck.
Unlock Deck
k this deck
41
Two well-known aviation training schools are being compared using random samples of their graduates.It is found that 70 of 140 graduates of Fly-More Academy passed their FAA exams on the first try,compared with 104 of 260 graduates of Blue Yonder Institute.To compare the pass rates,the pooled proportion would be
A).500
B).435
C).400
D).345
A).500
B).435
C).400
D).345
Unlock Deck
Unlock for access to all 116 flashcards in this deck.
Unlock Deck
k this deck
42
Of 200 youthful gamers (under 18)who tried the new Z-Box-Plus game,160 rated it "excellent," compared with only 144 of 200 adult gamers (18 or over).The p-value for a right-tailed test to compare the two proportions would be approximately
A).042
B).031
C).054
D).095
A).042
B).031
C).054
D).095
Unlock Deck
Unlock for access to all 116 flashcards in this deck.
Unlock Deck
k this deck
43
Of 200 youthful gamers (under 18)who tried the new Z-Box-Plus game,160 rated it "excellent," compared with only 144 of 200 adult gamers (18 or over).The test statistic to test the two proportions for equality would be
A)1.645
B)1.960
C)1.873
D)1.448
A)1.645
B)1.960
C)1.873
D)1.448
Unlock Deck
Unlock for access to all 116 flashcards in this deck.
Unlock Deck
k this deck
44
A new policy of "flex hours" is proposed.Random sampling showed that 28 of 50 female workers favored the change,while 22 of 50 male workers favored the change.Management wonders if there is a difference between the two groups.What is the test statistic to test for a zero difference in the population proportions?
A)1.321
B)1.287
C)1.200
D)−1.255
A)1.321
B)1.287
C)1.200
D)−1.255
Unlock Deck
Unlock for access to all 116 flashcards in this deck.
Unlock Deck
k this deck
45
Two well-known aviation training schools are being compared using random samples of their graduates.It is found that 70 of 140 graduates of Fly-More Academy passed their FAA exams on the first try,compared with 104 of 260 graduates of Blue Yonder Institute.To compare the pass rates,find the critical value for a right-tailed test at α = .05.
A)1.960
B)1.645
C)2.326
A)1.960
B)1.645
C)2.326
Unlock Deck
Unlock for access to all 116 flashcards in this deck.
Unlock Deck
k this deck
46
Two well-known aviation training schools are being compared using random samples of their graduates.It is found that 70 of 140 graduates of Fly-More Academy passed their FAA exams on the first try,compared with 104 of 260 graduates of Blue Yonder Institute.To compare the two proportions,the assumption of normality of the test statistic is
A)justified,but it is a borderline case.
B)clearly justified.
C)clearly not justified.
A)justified,but it is a borderline case.
B)clearly justified.
C)clearly not justified.
Unlock Deck
Unlock for access to all 116 flashcards in this deck.
Unlock Deck
k this deck
47
Carver Memorial Hospital's surgeons have a new procedure that they think will decrease the time to perform an appendectomy.A sample of 8 appendectomies using the old method had a mean of 38 minutes with a variance of 36 minutes,while a sample of 10 appendectomies using the experimental method had a mean of 29 minutes with a variance of 16 minutes.For a right-tailed test for equal means (assume equal variances),the critical value at α = .10 is
A)1.746
B)1.337
C)2.120
D)2.754
A)1.746
B)1.337
C)2.120
D)2.754
Unlock Deck
Unlock for access to all 116 flashcards in this deck.
Unlock Deck
k this deck
48
At Huge University,a sample of 200 business school seniors showed that 26 planned to pursue an MBA degree,compared with 120 of 800 arts and sciences seniors.We want to know if the proportion is higher in the arts and sciences group.For this test,the assumption of normality for the difference of proportions is
A)clearly unjustified.
B)clearly justified.
C)a borderline call.
A)clearly unjustified.
B)clearly justified.
C)a borderline call.
Unlock Deck
Unlock for access to all 116 flashcards in this deck.
Unlock Deck
k this deck
49
Two well-known aviation training schools are being compared using random samples of their graduates.It is found that 70 of 140 graduates of Fly-More Academy passed their FAA exams on the first try,compared with 104 of 260 graduates of Blue Yonder Institute.The test statistic to test the pass rates for equality is
A)2.141
B)1.298
C)1.227
D)1.924
A)2.141
B)1.298
C)1.227
D)1.924
Unlock Deck
Unlock for access to all 116 flashcards in this deck.
Unlock Deck
k this deck
50
Of 200 youthful gamers (under 18)who tried the new Z-Box-Plus game,160 rated it "excellent," compared with only 144 of 200 adult gamers (18 or over).The pooled proportion for a test to compare the two proportions would be
A).76
B).72
C).77
D)Must know α to answer.
A).76
B).72
C).77
D)Must know α to answer.
Unlock Deck
Unlock for access to all 116 flashcards in this deck.
Unlock Deck
k this deck
51
Of 200 youthful gamers (under 18)who tried the new Z-Box-Plus game,160 rated it "excellent," compared with only 144 of 200 adult gamers (18 or over).Calculate the 95 percent confidence interval for the difference of proportions.
A)[+.013,+.263]
B)[−.014,+.188]
C)[−.003,+.163]
D)[+.057,+.261]
A)[+.013,+.263]
B)[−.014,+.188]
C)[−.003,+.163]
D)[+.057,+.261]
Unlock Deck
Unlock for access to all 116 flashcards in this deck.
Unlock Deck
k this deck
52
At Huge University,a sample of 200 business school seniors showed that 26 planned to pursue an MBA degree,compared with 120 of 800 arts and sciences seniors.We want to know if the proportion is higher in the arts and sciences group.The p-value for a left-tailed test is approximately
A).38
B).48
C).24
D).51
A).38
B).48
C).24
D).51
Unlock Deck
Unlock for access to all 116 flashcards in this deck.
Unlock Deck
k this deck
53
Two well-known aviation training schools are being compared using random samples of their graduates.It is found that 70 of 140 graduates of Fly-More Academy passed their FAA exams on the first try,compared with 104 of 260 graduates of Blue Yonder Institute.In a right-tailed test,the p-value is .0274,so at α = .025 we should
A)reject the hypothesis of equal proportions.
B)not reject the hypothesis of equal proportions.
C)change the α to .05 to get a rejection.
A)reject the hypothesis of equal proportions.
B)not reject the hypothesis of equal proportions.
C)change the α to .05 to get a rejection.
Unlock Deck
Unlock for access to all 116 flashcards in this deck.
Unlock Deck
k this deck
54
A new policy of "flex hours" is proposed.Random sampling showed that 28 of 50 female workers favored the change,while 22 of 50 male workers favored the change.Management wonders if there is a difference between the two groups.For a test comparing the two proportions,the assumption of normality for the difference of proportions is
A)clearly justified.
B)clearly unjustified.
C)a borderline call.
A)clearly justified.
B)clearly unjustified.
C)a borderline call.
Unlock Deck
Unlock for access to all 116 flashcards in this deck.
Unlock Deck
k this deck
55
A new policy of "flex hours" is proposed.Random sampling showed that 28 of 50 female workers favored the change,while 22 of 50 male workers favored the change.Management wonders if there is a difference between the two groups.What is the p-value for a two-tailed test?
A).3849
B).1151
C).2301
D).3453
A).3849
B).1151
C).2301
D).3453
Unlock Deck
Unlock for access to all 116 flashcards in this deck.
Unlock Deck
k this deck
56
At Huge University,a sample of 200 business school seniors showed that 26 planned to pursue an MBA degree,compared with 120 of 800 arts and sciences seniors.We want to know if the proportion is higher in the arts and sciences group.The pooled proportion for this test is
A).130
B).140
C).145
D).146
A).130
B).140
C).145
D).146
Unlock Deck
Unlock for access to all 116 flashcards in this deck.
Unlock Deck
k this deck
57
Management of Melodic Kortholt Company compared absenteeism rates in two plants on the third Monday in November.Of Plant A's 800 employees,120 were absent.Of Plant B's 1200 employees,144 were absent.MegaStat's results for a two-tailed test are shown below. At α = .05,the two-tailed test for a difference in proportions is
A)just barely significant.
B)not quite significant.
C)not feasible due to nonnormality.
At α = .05,the two-tailed test for a difference in proportions isA)just barely significant.
B)not quite significant.
C)not feasible due to nonnormality.
Unlock Deck
Unlock for access to all 116 flashcards in this deck.
Unlock Deck
k this deck
58
Management of Melodic Kortholt Company compared absenteeism rates in two plants on the third Monday in November.Of Plant A's 800 employees,120 were absent.Of Plant B's 1200 employees,144 were absent.MegaStat's results for a two-tailed test are shown below. The test statistic (shown as z = x.xx)is approximately
A)2.022
B)1.960
C)1.942
D)1.645
The test statistic (shown as z = x.xx)is approximatelyA)2.022
B)1.960
C)1.942
D)1.645
Unlock Deck
Unlock for access to all 116 flashcards in this deck.
Unlock Deck
k this deck
59
Two well-known aviation training schools are being compared using random samples of their graduates.It is found that 70 of 140 graduates of Fly-More Academy passed their FAA exams on the first try,compared with 104 of 260 graduates of Blue Yonder Institute.To compare the pass rates,the p-value for a right-tailed test is approximately
A).054
B).027
C).155
D).013
A).054
B).027
C).155
D).013
Unlock Deck
Unlock for access to all 116 flashcards in this deck.
Unlock Deck
k this deck
60
At Huge University,a sample of 200 business school seniors showed that 26 planned to pursue an MBA degree,compared with 120 of 800 arts and sciences seniors.We want to know if the proportion is higher in the arts and sciences group.What is the z test statistic?
A)−1.322
B)−1.122
C)−0.716
D)We must first know α.
A)−1.322
B)−1.122
C)−0.716
D)We must first know α.
Unlock Deck
Unlock for access to all 116 flashcards in this deck.
Unlock Deck
k this deck
61
A random sample of Ersatz University students revealed that 16 females had a mean of $22.30 in their wallets with a standard deviation of $3.20,while 16 males had a mean of $17.30 with a standard deviation of $9.60.In comparing the population variances at α = .10 in a two-tailed test,we conclude that
A)the variances are equal.
B)the variances are unequal.
C)the variances are incomparable (different sample sizes).
A)the variances are equal.
B)the variances are unequal.
C)the variances are incomparable (different sample sizes).
Unlock Deck
Unlock for access to all 116 flashcards in this deck.
Unlock Deck
k this deck
62
A psychology researcher has a theory that predicts women will tend to carry more cash than men.A random sample of Ersatz University students revealed that 16 females had a mean of $22.30 in their wallets with a standard deviation of $3.20,while 16 males had a mean of $17.30 with a standard deviation of $9.60.The researcher's hypothesis would lead us to perform a
A)right-tailed test.
B)left-tailed test.
C)two-tailed test.
A)right-tailed test.
B)left-tailed test.
C)two-tailed test.
Unlock Deck
Unlock for access to all 116 flashcards in this deck.
Unlock Deck
k this deck
63
A psychology researcher has a theory that predicts women will tend to carry more cash than men.A random sample of Ersatz University students revealed that 16 females had a mean of $22.30 in their wallets with a standard deviation of $3.20,while 16 males had a mean of $17.30 with a standard deviation of $9.60.The test statistic for the researcher's hypothesis is
A)impossible to determine without knowing α.
B)1.250
C)1.504
D)1.976
A)impossible to determine without knowing α.
B)1.250
C)1.504
D)1.976
Unlock Deck
Unlock for access to all 116 flashcards in this deck.
Unlock Deck
k this deck
64
During a test period,an experimental group of 10 vehicles using an 85 percent ethanol-gasoline mixture showed mean CO2 emissions of 667 pounds per 1000 miles,with a standard deviation of 20 pounds.A control group of 14 vehicles using regular gasoline showed mean CO2 emissions of 679 pounds per 1000 miles with a standard deviation of 15 pounds.At α = .05,in a left-tailed test (assuming equal variances)the test statistic is
A)−1.310
B)−2.042
C)−1.645
D)−1.683
A)−1.310
B)−2.042
C)−1.645
D)−1.683
Unlock Deck
Unlock for access to all 116 flashcards in this deck.
Unlock Deck
k this deck
65
Mary analyzed occupancy rates at two community hospitals and obtained the following Excel results. Which conclusion is correct in a two-tailed test at α = .05?
A)There appears to be no difference in the mean occupancy rates.
B)HealthPro has a significantly higher mean occupancy rate.
C)There is a significant difference in the mean occupancy rates.
Which conclusion is correct in a two-tailed test at α = .05?A)There appears to be no difference in the mean occupancy rates.
B)HealthPro has a significantly higher mean occupancy rate.
C)There is a significant difference in the mean occupancy rates.
Unlock Deck
Unlock for access to all 116 flashcards in this deck.
Unlock Deck
k this deck
66
Carver Memorial Hospital's surgeons have a new procedure that they think will decrease the time to perform an appendectomy.A sample of 8 appendectomies using the old method had a mean of 38 minutes with a variance of 36 minutes,while a sample of 10 appendectomies using the experimental method had a mean of 29 minutes with a variance of 16 minutes.For a right-tailed test of equal means (assume equal variances),the pooled variance is
A)14.76
B)26.00
C)24.75
D)27.54
A)14.76
B)26.00
C)24.75
D)27.54
Unlock Deck
Unlock for access to all 116 flashcards in this deck.
Unlock Deck
k this deck
67
Nacirema Airlines is buying a fleet of new fuel-efficient planes.The HogJet and the LitheJet both meet their price and performance needs,and both planes meet EPA noise guidelines.However,the quieter plane is preferred.Each plane is flown through a typical takeoff and landing sequence 10 times,while remote sensors at ground level record the noise levels (in decibels).The table below summarizes the sound level tests using Excel's default level of significance (α = .05). After inspecting this table,we would most likely
A)use the test assuming unequal variances.
B)use the test for equal variances.
C)perform another test to determine if the variances are equal before proceeding.
D)realize that the decision is not affected by our assumptions concerning the variance.
After inspecting this table,we would most likelyA)use the test assuming unequal variances.
B)use the test for equal variances.
C)perform another test to determine if the variances are equal before proceeding.
D)realize that the decision is not affected by our assumptions concerning the variance.
Unlock Deck
Unlock for access to all 116 flashcards in this deck.
Unlock Deck
k this deck
68
Carver Memorial Hospital's surgeons have a new procedure that they think will decrease the time to perform an appendectomy.A sample of 8 appendectomies using the old method had a mean of 38 minutes with a variance of 36 minutes,while a sample of 10 appendectomies using the experimental method had a mean of 29 minutes with a variance of 16 minutes.For a right-tailed test of means (assume equal variances),the test statistic is
A)3.814
B)2.365
C)3.000
D)1.895
A)3.814
B)2.365
C)3.000
D)1.895
Unlock Deck
Unlock for access to all 116 flashcards in this deck.
Unlock Deck
k this deck
69
Mary did an analysis of acute care variances in samples of occupancy rates at two community hospitals and obtained the following results: Can Mary conclude that the variances are unequal at α = 0.05?
A)No,there is not enough evidence to believe the variances are unequal.
B)Yes,the analysis shows that the variances are unequal.
C)You cannot tell without knowing the sample sizes.
Can Mary conclude that the variances are unequal at α = 0.05?A)No,there is not enough evidence to believe the variances are unequal.
B)Yes,the analysis shows that the variances are unequal.
C)You cannot tell without knowing the sample sizes.
Unlock Deck
Unlock for access to all 116 flashcards in this deck.
Unlock Deck
k this deck
70
Based on a random sample of 13 tire changes,the mean time to change a tire on a Boeing 777 has a mean of 59.5 minutes with a standard deviation of 8.4 minutes.For 10 tire changes on a Boeing 787,the mean time was 64.3 minutes with a standard deviation of 12.4 minutes.To test for equal variances in a two-tailed test at α = .10,the critical values are
A)3.73 and 0.228
B)2.51 and 3.67
C)3.07 and 0.398
D)3.07 and 0.357
A)3.73 and 0.228
B)2.51 and 3.67
C)3.07 and 0.398
D)3.07 and 0.357
Unlock Deck
Unlock for access to all 116 flashcards in this deck.
Unlock Deck
k this deck
71
During a test period,an experimental group of 10 vehicles using an 85 percent ethanol-gasoline mixture showed mean CO2 emissions of 240 pounds per 100 miles,with a standard deviation of 20 pounds.A control group of 14 vehicles using regular gasoline showed mean CO2 emissions of 252 pounds per 100 miles with a standard deviation of 15 pounds.A quick comparison of the sample variances suggests that the population variances are
A)probably equal.
B)probably unequal.
C)incomparable.
A)probably equal.
B)probably unequal.
C)incomparable.
Unlock Deck
Unlock for access to all 116 flashcards in this deck.
Unlock Deck
k this deck
72
Nacirema Airlines is buying a fleet of new fuel-efficient planes.The HogJet and the LitheJet both meet their price and performance needs,and both planes meet EPA noise guidelines.However,the quieter plane is preferred.Each plane is flown through a typical takeoff and landing sequence 10 times,while remote sensors at ground level record the noise levels (in decibels).The table below summarizes the sound level tests using Excel's default level of significance (α = .05). In a left-tailed test comparing the means at α = .05,we would
A)not reject H0.
B)reject H0.
C)have insufficient information to make a decision.
In a left-tailed test comparing the means at α = .05,we wouldA)not reject H0.
B)reject H0.
C)have insufficient information to make a decision.
Unlock Deck
Unlock for access to all 116 flashcards in this deck.
Unlock Deck
k this deck
73
Nacirema Airlines is buying a fleet of new fuel-efficient planes.The HogJet and the LitheJet both meet their price and performance needs,and both planes meet EPA noise guidelines.However,the quieter plane is preferred.Each plane is flown through a typical takeoff and landing sequence 10 times,while remote sensors at ground level record the noise levels (in decibels).The table below summarizes the sound level tests using Excel's default level of significance (α = .05). If we switched from α = 0.05 to α = 0.005 in a two-tailed test of means,our assumption about variances (assumed equal or assumed unequal)would
A)affect the decision.
B)not affect the decision.
C)require a new analysis.
If we switched from α = 0.05 to α = 0.005 in a two-tailed test of means,our assumption about variances (assumed equal or assumed unequal)wouldA)affect the decision.
B)not affect the decision.
C)require a new analysis.
Unlock Deck
Unlock for access to all 116 flashcards in this deck.
Unlock Deck
k this deck
74
A certain psychological theory predicts that men want bigger families than women.Kate asked each student in her psychology class how many children he or she considered ideal for a married couple and obtained the Excel results shown below at α = .05. What conclusion can you draw in a two-tailed test at α = .05?
A)Men want larger families on average than women.
B)Women want larger families on average than men.
C)We cannot reject the hypothesis of equal population means.
D)The decision depends on whether or not the variances are equal.
What conclusion can you draw in a two-tailed test at α = .05?A)Men want larger families on average than women.
B)Women want larger families on average than men.
C)We cannot reject the hypothesis of equal population means.
D)The decision depends on whether or not the variances are equal.
Unlock Deck
Unlock for access to all 116 flashcards in this deck.
Unlock Deck
k this deck
75
Randomly chosen MBA students were asked their opinions about the ideal number of children for a married couple.The sample data were entered into MegaStat,and the following results were produced. What conclusion can you draw from this analysis at α = .05?
A)Men want larger families on average than women.
B)Women want larger families on average than men.
C)This is insufficient evidence to suggest a difference in means.
D)We could conclude that men want larger families if we used a two-tailed test.
What conclusion can you draw from this analysis at α = .05?A)Men want larger families on average than women.
B)Women want larger families on average than men.
C)This is insufficient evidence to suggest a difference in means.
D)We could conclude that men want larger families if we used a two-tailed test.
Unlock Deck
Unlock for access to all 116 flashcards in this deck.
Unlock Deck
k this deck
76
During a test period,an experimental group of 10 vehicles using an 85 percent ethanol-gasoline mixture showed mean CO2 emissions of 667 pounds per 1000 miles,with a standard deviation of 20 pounds.A control group of 14 vehicles using regular gasoline showed mean CO2 emissions of 679 pounds per 1000 miles with a standard deviation of 15 pounds.Assuming equal variances,the pooled variance is
A)296.59
B)225.00
C)400.00
D)522.16
A)296.59
B)225.00
C)400.00
D)522.16
Unlock Deck
Unlock for access to all 116 flashcards in this deck.
Unlock Deck
k this deck
77
During a test period,an experimental group of 10 vehicles using an 85 percent ethanol-gasoline mixture showed mean CO2 emissions of 667 pounds per 1000 miles,with a standard deviation of 20 pounds.A control group of 14 vehicles using regular gasoline showed mean CO2 emissions of 679 pounds per 1000 miles with a standard deviation of 15 pounds.At α = .05,in a left-tailed test,the critical value to compare the means (assuming equal variances)is
A)−2.508
B)−2.074
C)−1.321
D)−1.717
A)−2.508
B)−2.074
C)−1.321
D)−1.717
Unlock Deck
Unlock for access to all 116 flashcards in this deck.
Unlock Deck
k this deck
78
Litter sizes (number of pups)for randomly chosen dogs from two breeds were compared.The sample data were entered into Excel,and the following results were produced. What is the p-value for a left-tailed test comparing the means at α = .05?
A)Less than .10
B)More than .10
C)Between .10 and .05
D)Between .05 and .01
What is the p-value for a left-tailed test comparing the means at α = .05?A)Less than .10
B)More than .10
C)Between .10 and .05
D)Between .05 and .01
Unlock Deck
Unlock for access to all 116 flashcards in this deck.
Unlock Deck
k this deck
79
Randomly chosen MBA students were asked their opinions about the ideal number of children for a married couple.The sample data were entered into MegaStat,and the following results were produced. To compare the means,would it be appropriate to use a test that assumes equal variances?
A)Yes,because by pooling our variances,we can simplify our calculations.
B)Yes,we should assume equal variances when comparing independent samples.
C)No,because the sample statistics show that the variances are unequal at α = 0.05.
D)No,because the variances will differ because the means differ significantly.
To compare the means,would it be appropriate to use a test that assumes equal variances?A)Yes,because by pooling our variances,we can simplify our calculations.
B)Yes,we should assume equal variances when comparing independent samples.
C)No,because the sample statistics show that the variances are unequal at α = 0.05.
D)No,because the variances will differ because the means differ significantly.
Unlock Deck
Unlock for access to all 116 flashcards in this deck.
Unlock Deck
k this deck
80
Litter sizes (number of pups)for randomly chosen dogs from two breeds were compared.The sample data were entered into Excel,and the following results were produced. What is the critical value for a left-tailed test comparing the means at α = 0.05?
A)−1.645
B)−1.721
C)−1.703
D)−1.699
What is the critical value for a left-tailed test comparing the means at α = 0.05?A)−1.645
B)−1.721
C)−1.703
D)−1.699
Unlock Deck
Unlock for access to all 116 flashcards in this deck.
Unlock Deck
k this deck
Unlock Deck
Unlock for access to all 116 flashcards in this deck.


