Deck 19: Understanding Regression Residuals
Full screen (f)
Question
Consider the following to answer the question(s) below:
Consider the following scatter diagram for 24 of the top grossing movies of all time. The data include the highest grossing films for which world box office receipts and budgets were available. The top two were Avatar and Titanic.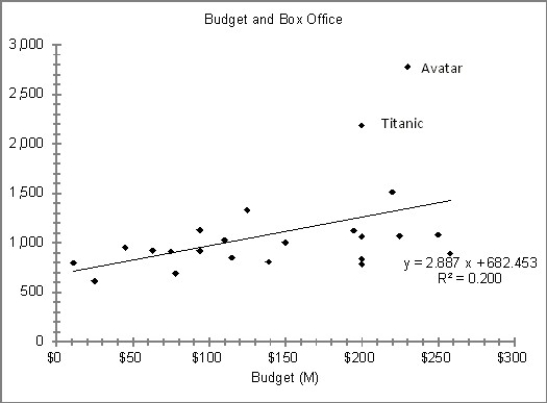
Which statement is true?
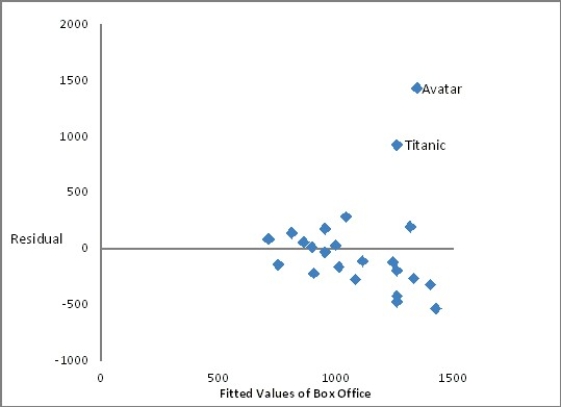
A) The data contain points which are high leverage, influential, and which would have large residuals.
B) The data contain points which are high leverage, not influential, and which would have large residuals.
C) The data contain points which are not high leverage, are influential, and which would have large residuals.
D) The data contain points which are not high leverage, not influential, and which would have large residuals.
E) None of the above statements can be made.
Consider the following scatter diagram for 24 of the top grossing movies of all time. The data include the highest grossing films for which world box office receipts and budgets were available. The top two were Avatar and Titanic.
Which statement is true?
A) The data contain points which are high leverage, influential, and which would have large residuals.
B) The data contain points which are high leverage, not influential, and which would have large residuals.
C) The data contain points which are not high leverage, are influential, and which would have large residuals.
D) The data contain points which are not high leverage, not influential, and which would have large residuals.
E) None of the above statements can be made.
Question
Question
Quarterly sales figures for e-commerce retail sales were obtained from the first quarter of 2003 through the fourth quarter of 2009. A regression model was estimated to describe the trend in e-commerce retail sales over time.
a. Based on the plot of residuals versus predicted values, is the linear model appropriate? Explain. b. The Durbin-Watson statistic for this regression was found to be 1.727. What can you conclude from this statistic at the 0.01 level of significance?
a. Based on the plot of residuals versus predicted values, is the linear model appropriate? Explain.
b. The Durbin-Watson statistic for this regression was found to be 1.727. What can you conclude from this statistic at the 0.01 level of significance? Question
The advertising campaign for a high fibre cereal wants to claim that high fibre cereals are lower in calories. In order to research this claim, they obtain nutritional information for 34 breakfast cereals including the amount of fibre (in grams) and the number of calories per serving. The data resulted in the following scatterplot. 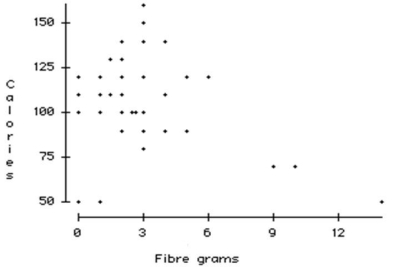 Which statement is true?
A) Some high leverage points are evident.
B) There is a strong positive association between amount of fibre and number of calories per serving.
C) As the amount of fibre increases so does the number of calories per serving.
D) Some high leverage points are evident and there is a moderate positive association between amount of fibre and number of calories per serving.
E) Absolutely no high leverage points are evident.
Which statement is true?A) Some high leverage points are evident.
B) There is a strong positive association between amount of fibre and number of calories per serving.
C) As the amount of fibre increases so does the number of calories per serving.
D) Some high leverage points are evident and there is a moderate positive association between amount of fibre and number of calories per serving.
E) Absolutely no high leverage points are evident.
Question
Data on Internet usage (per 100 inhabitants) and population were collected for a sample of 52 countries (United Nations database). The data resulted in the following scatterplot. 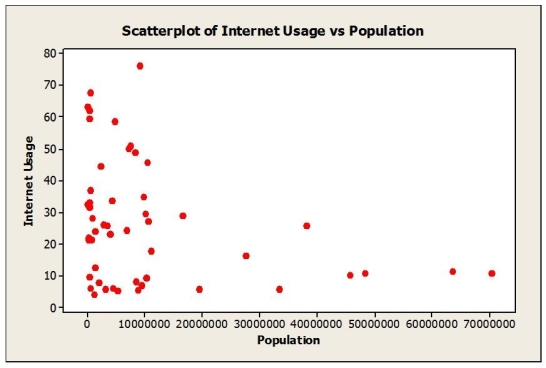 a. Do you think there is a clear pattern? Describe the association between Internet usage and population.
b. Comment on any unusual data point or points in the data set. Explain.
c. Do you think a model could accurately predict the Internet usage in India with a population of 1,153,230,948? Explain.
a. Do you think there is a clear pattern? Describe the association between Internet usage and population.b. Comment on any unusual data point or points in the data set. Explain.
c. Do you think a model could accurately predict the Internet usage in India with a population of 1,153,230,948? Explain.
Question
Consider the following to answer the question(s) below:
A regression model was developed relating average annual pay to the percentage of women employed for a sample of companies. Below is the plot of residuals versus predicted values.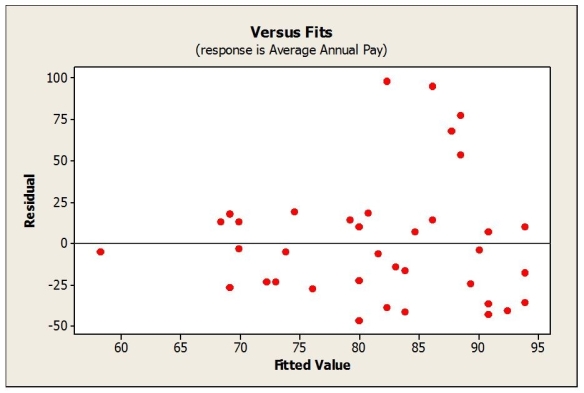
What does the plot of residuals suggest?
A) An outlier is present in the data set.
B) The linearity condition is not satisfied.
C) A high leverage point is present in the data set.
D) The equal spread condition is not satisfied.
E) The data are not normal.
Question
The following scatterplot shows world population (millions) plotted against 5 year intervals from 1950 through 2000.
a. Based on the scatterplot, is the linear model appropriate? Explain.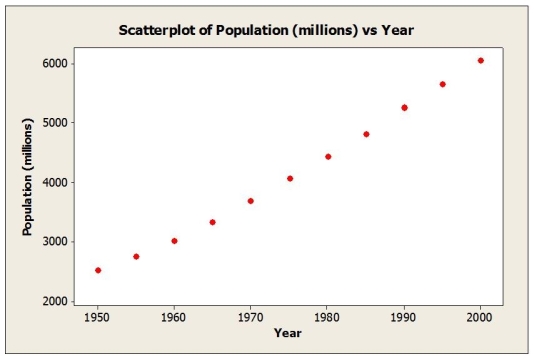 b. A linear regression model was estimated to describe the trend in world population over time. Based on the plot of residuals versus predicted values shown below, would you consider this model appropriate? Explain.
 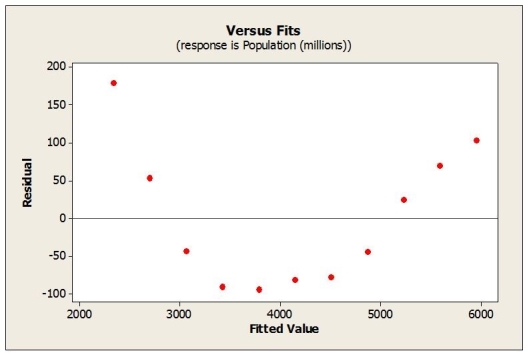 c. Would a re-expression of the data help? If so, what would you recommend?
a. Based on the scatterplot, is the linear model appropriate? Explain.
b. A linear regression model was estimated to describe the trend in world population over time. Based on the plot of residuals versus predicted values shown below, would you consider this model appropriate? Explain. c. Would a re-expression of the data help? If so, what would you recommend? Question
Quarterly figures for e-commerce retail sales were obtained from the first quarter of 2001 through the fourth quarter of 2007. A regression model was estimated to describe the trend in e-commerce retail sales over time. What does the plot of residuals versus predicted values suggest? 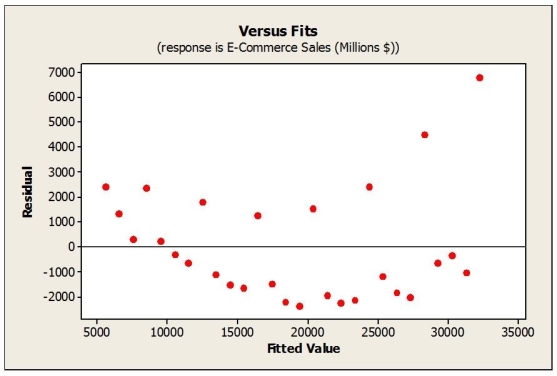
A) The data are not normal.
B) The linearity condition is not satisfied.
C) The equal spread condition is not satisfied.
D) The data are not normal, and the linearity condition is not satisfied.
E) The linearity condition is not satisfied, and the equal spread condition is not satisfied.
A) The data are not normal.
B) The linearity condition is not satisfied.
C) The equal spread condition is not satisfied.
D) The data are not normal, and the linearity condition is not satisfied.
E) The linearity condition is not satisfied, and the equal spread condition is not satisfied.
Question
Consider the following to answer the question(s) below:
A regression model was developed relating average annual pay to the percentage of women employed for a sample of companies. Below is the plot of residuals versus predicted values.
Which of the following re-expressions of the data would be appropriate?
A) Square the data values.
B) Cube the data values.
C) Use a logarithmic transformation.
D) Use a geometric transformation.
E) The data should not be transformed.
Question
Consider the following to answer the question(s) below:
Monthly closing stock prices for a utility company were obtained from January 2007 through August 2008. A regression model was estimated to describe the trend in closing stock prices over time.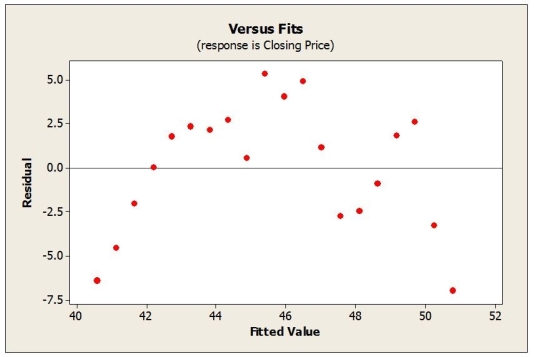
Suppose that for the regression model estimated using the data described, the Durbin-Watson statistic was calculated as 0.5626. Using α = 0.01 we can conclude that
A) There is evidence of positive autocorrelation.
B) There is evidence of negative autocorrelation.
C) There is no evidence of positive or negative autocorrelation.
D) There is evidence of an outlier.
E) The test is inconclusive.
Question
Suppose that data on labour productivity and unit labour costs were obtained for the retail industry from 1990 through 2009. A regression was estimated to describe the linear relationship between the two variables.
a. Based on the plot of residuals versus predicted values, is the linear model appropriate? Explain. b. Would a re-expression of the data help? If so, what would you recommend?
a. Based on the plot of residuals versus predicted values, is the linear model appropriate? Explain.
b. Would a re-expression of the data help? If so, what would you recommend? Question
The advertising campaign for a high fibre cereal wants to claim that high fibre cereals are lower in calories. In order to research this claim, they obtain nutritional information for 34 breakfast cereals including the amount of fibre (in grams) and the number of calories per serving. The data resulted in the following scatterplot.  a. Do you think there is a clear pattern? Describe the association between fibre and calories.
b. Comment on any unusual data point or points in the data set. Explain.
c. Do you think a model could accurately predict the number of calories in a serving of cereal that has 22 grams of fibre? Explain.
a. Do you think there is a clear pattern? Describe the association between fibre and calories.b. Comment on any unusual data point or points in the data set. Explain.
c. Do you think a model could accurately predict the number of calories in a serving of cereal that has 22 grams of fibre? Explain.
Question
Consider the following to answer the question(s) below:
Consider the following scatter diagram for 24 of the top grossing movies of all time. The data include the highest grossing films for which world box office receipts and budgets were available. The top two were Avatar and Titanic.
The effect of including the data for Avatar and Titanic is
A) to make the value of the slope of the regression line larger
B) to make the value of the slope of the regression line smaller
C) to decrease the correlation between the two variables
D) to reduce the residual standard deviation
E) cannot be determined with the information provided
Question
A regression model was developed relating average annual pay to the percentage of women employed for a sample of companies. Below is the plot of residuals versus predicted values.  a. What can you see in the plot of residuals that may not have been clear in the original scatterplot of the data?
b. Would a re-expression of the data help? If so, what would you recommend?
a. What can you see in the plot of residuals that may not have been clear in the original scatterplot of the data?b. Would a re-expression of the data help? If so, what would you recommend?
Question
Data were collected for a sample of companies regarding their investment in quality improvement efforts and cost savings realized as a result (both measured as a percentage of sales revenue). Below is the scatterplot. 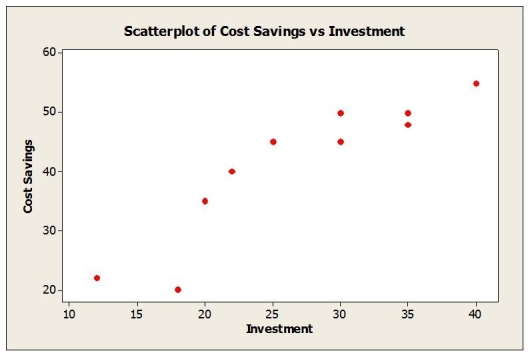 The correlation coefficient for these data is r = 0.913. If data were collected for individual departments within companies rather than at the company level, would you expect the correlation to be weaker, stronger or about the same? Explain.
The correlation coefficient for these data is r = 0.913. If data were collected for individual departments within companies rather than at the company level, would you expect the correlation to be weaker, stronger or about the same? Explain. Question
Monthly closing stock prices for a utility company were obtained from January 2007 through August 2008. A regression model was estimated to describe the trend in closing stock prices over time.
a. Based on the plot of residuals versus predicted values, is the linear model appropriate? Explain. b. The Durbin-Watson statistic for this regression was found to be 0.5626. What can you conclude from this statistic at the 0.01 level of significance?
a. Based on the plot of residuals versus predicted values, is the linear model appropriate? Explain.
b. The Durbin-Watson statistic for this regression was found to be 0.5626. What can you conclude from this statistic at the 0.01 level of significance? Question
Question
Question
Question
Consider the following to answer the question(s) below:
Monthly closing stock prices for a utility company were obtained from January 2007 through August 2008. A regression model was estimated to describe the trend in closing stock prices over time.
What does the plot of residuals below suggest?
A) An outlier is present in the data set.
B) The linearity condition is not satisfied.
C) A high leverage point is present in the data set.
D) The data are not normal.
E) The equal spread condition is not satisfied.
Question
Consider the following to answer the question(s) below:
Suppose that data on labour productivity and unit labour costs were obtained for the retail industry from 1990 through 2009. A regression was estimated to describe the linear relationship between the two variables.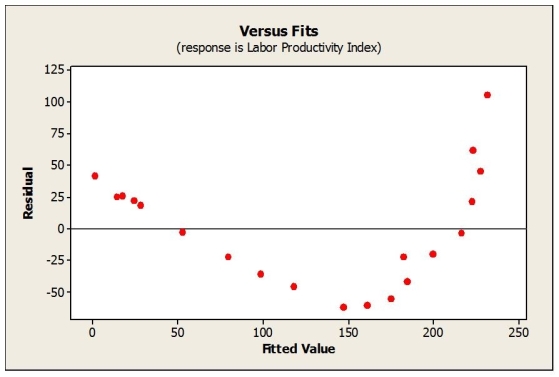
Which of the following re-expressions of the data would be appropriate?
A) Use a logarithmic transformation.
B) Square the data.
C) Use a geometric transformation.
D) Take the square root of the data.
E) Take the reciprocal of the data.
Question
Consider the following to answer the question(s) below:
Suppose that data on labour productivity and unit labour costs were obtained for the retail industry from 1990 through 2009. A regression was estimated to describe the linear relationship between the two variables.
What does the plot of residuals suggest?
A) The linearity condition is not satisfied, and the equal spread condition is not satisfied.
B) The data are not normal.
C) The equal variance condition is not met.
D) The linearity condition is not met.
E) The linearity condition is not met and the data is not normal.
Question
Question
Question
Question
Consider the following to answer the question(s) below:
Suppose that data on labour productivity and unit labour costs were obtained for the retail industry from 1990 through 2009. A regression was estimated to describe the linear relationship between the two variables.
A model of retail sales of furniture and fixtures in Canada as a function of the value of building permits yielded the following equation. log10 Sales = 2.33 + 0.57 log10 Value of permits
What is the predicted value of retail sales if the value of building permits is 700,000?
A) $458,887.14
B) $5.66
C) $2,137.96
D) $3.33
E) $22,060.33
Question
Consider the following to answer the question(s) below:
The average monthly residential mortgage lending rate in Canada is available monthly beginning in 1951. A scatterplot of the residuals against time for 747 months from January 1951 to March 2013 is shown below. The rate peaked in September of 1981 at 21.46%.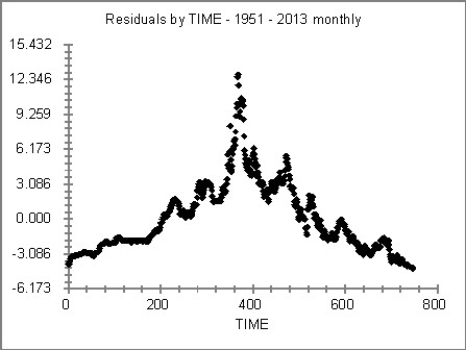 The Durbin-Watson statistic has a value of 0.01.
The critical values for the Durbin-Watson statistic for α = 0.05 and n = 750 are: dL= 1.87736 and dU = 1.88270. What does this tell us about the assumption of the independence of the errors?
A) The assumption of independent errors is violated.
B) The assumption of independent errors is not violated.
C) The errors are not related to one another over time.
D) This test is not valid for time series data.
E) This evidence does not allow us to draw any conclusions in this regard.
The average monthly residential mortgage lending rate in Canada is available monthly beginning in 1951. A scatterplot of the residuals against time for 747 months from January 1951 to March 2013 is shown below. The rate peaked in September of 1981 at 21.46%.
The Durbin-Watson statistic has a value of 0.01.The critical values for the Durbin-Watson statistic for α = 0.05 and n = 750 are: dL= 1.87736 and dU = 1.88270. What does this tell us about the assumption of the independence of the errors?
A) The assumption of independent errors is violated.
B) The assumption of independent errors is not violated.
C) The errors are not related to one another over time.
D) This test is not valid for time series data.
E) This evidence does not allow us to draw any conclusions in this regard.
Question
Consider the following to answer the question(s) below:
The average monthly residential mortgage lending rate in Canada is available monthly beginning in 1951. A scatterplot of the residuals against time for 747 months from January 1951 to March 2013 is shown below. The rate peaked in September of 1981 at 21.46%. The Durbin-Watson statistic has a value of 0.01.
What conclusion about autocorrelation in the model can we draw using the value of the Durbin-Watson statistic and the critical limits, dL=1.87736 and dU=1.88270?
A) There is evidence of positive autocorrelation.
B) There is evidence of negative autocorrelation.
C) There is no evidence of positive autocorrelation.
D) There is no evidence of negative autocorrelation.
E) The test is inconclusive.
The average monthly residential mortgage lending rate in Canada is available monthly beginning in 1951. A scatterplot of the residuals against time for 747 months from January 1951 to March 2013 is shown below. The rate peaked in September of 1981 at 21.46%.
The Durbin-Watson statistic has a value of 0.01.What conclusion about autocorrelation in the model can we draw using the value of the Durbin-Watson statistic and the critical limits, dL=1.87736 and dU=1.88270?
A) There is evidence of positive autocorrelation.
B) There is evidence of negative autocorrelation.
C) There is no evidence of positive autocorrelation.
D) There is no evidence of negative autocorrelation.
E) The test is inconclusive.

Unlock Deck
Sign up to unlock the cards in this deck!
Unlock Deck
Unlock Deck
1/28
Play
Full screen (f)
Deck 19: Understanding Regression Residuals
1
Consider the following to answer the question(s) below:
Consider the following scatter diagram for 24 of the top grossing movies of all time. The data include the highest grossing films for which world box office receipts and budgets were available. The top two were Avatar and Titanic.
Which statement is true?
A) The data contain points which are high leverage, influential, and which would have large residuals.
B) The data contain points which are high leverage, not influential, and which would have large residuals.
C) The data contain points which are not high leverage, are influential, and which would have large residuals.
D) The data contain points which are not high leverage, not influential, and which would have large residuals.
E) None of the above statements can be made.
A
2
Which of the following re-expressions of the data would be appropriate?
A) Square the data values.
B) Cube the data values.
C) Use a logarithmic transformation.
D) Use a geometric transformation.
E) The data should not be transformed.
A) Square the data values.
B) Cube the data values.
C) Use a logarithmic transformation.
D) Use a geometric transformation.
E) The data should not be transformed.
C
3
Quarterly sales figures for e-commerce retail sales were obtained from the first quarter of 2003 through the fourth quarter of 2009. A regression model was estimated to describe the trend in e-commerce retail sales over time.
a. Based on the plot of residuals versus predicted values, is the linear model appropriate? Explain. b. The Durbin-Watson statistic for this regression was found to be 1.727. What can you conclude from this statistic at the 0.01 level of significance?
a. Based on the plot of residuals versus predicted values, is the linear model appropriate? Explain.
b. The Durbin-Watson statistic for this regression was found to be 1.727. What can you conclude from this statistic at the 0.01 level of significance?a. The residual plot shows a curvature. In addition, the plot seems to thicken. The spread of residuals increases as the value of the fitted value increases (over time).
b. There is no evidence of positive or negative autocorrelation.
b. There is no evidence of positive or negative autocorrelation.
4
The advertising campaign for a high fibre cereal wants to claim that high fibre cereals are lower in calories. In order to research this claim, they obtain nutritional information for 34 breakfast cereals including the amount of fibre (in grams) and the number of calories per serving. The data resulted in the following scatterplot. Which statement is true?
A) Some high leverage points are evident.
B) There is a strong positive association between amount of fibre and number of calories per serving.
C) As the amount of fibre increases so does the number of calories per serving.
D) Some high leverage points are evident and there is a moderate positive association between amount of fibre and number of calories per serving.
E) Absolutely no high leverage points are evident.
Which statement is true?A) Some high leverage points are evident.
B) There is a strong positive association between amount of fibre and number of calories per serving.
C) As the amount of fibre increases so does the number of calories per serving.
D) Some high leverage points are evident and there is a moderate positive association between amount of fibre and number of calories per serving.
E) Absolutely no high leverage points are evident.
Unlock Deck
Unlock for access to all 28 flashcards in this deck.
Unlock Deck
k this deck
5
Data on Internet usage (per 100 inhabitants) and population were collected for a sample of 52 countries (United Nations database). The data resulted in the following scatterplot. a. Do you think there is a clear pattern? Describe the association between Internet usage and population.
b. Comment on any unusual data point or points in the data set. Explain.
c. Do you think a model could accurately predict the Internet usage in India with a population of 1,153,230,948? Explain.
a. Do you think there is a clear pattern? Describe the association between Internet usage and population.b. Comment on any unusual data point or points in the data set. Explain.
c. Do you think a model could accurately predict the Internet usage in India with a population of 1,153,230,948? Explain.
Unlock Deck
Unlock for access to all 28 flashcards in this deck.
Unlock Deck
k this deck
6
Consider the following to answer the question(s) below:
A regression model was developed relating average annual pay to the percentage of women employed for a sample of companies. Below is the plot of residuals versus predicted values.
What does the plot of residuals suggest?
A) An outlier is present in the data set.
B) The linearity condition is not satisfied.
C) A high leverage point is present in the data set.
D) The equal spread condition is not satisfied.
E) The data are not normal.
Unlock Deck
Unlock for access to all 28 flashcards in this deck.
Unlock Deck
k this deck
7
The following scatterplot shows world population (millions) plotted against 5 year intervals from 1950 through 2000.
a. Based on the scatterplot, is the linear model appropriate? Explain. b. A linear regression model was estimated to describe the trend in world population over time. Based on the plot of residuals versus predicted values shown below, would you consider this model appropriate? Explain. c. Would a re-expression of the data help? If so, what would you recommend?
a. Based on the scatterplot, is the linear model appropriate? Explain.
b. A linear regression model was estimated to describe the trend in world population over time. Based on the plot of residuals versus predicted values shown below, would you consider this model appropriate? Explain. c. Would a re-expression of the data help? If so, what would you recommend? Unlock Deck
Unlock for access to all 28 flashcards in this deck.
Unlock Deck
k this deck
8
Quarterly figures for e-commerce retail sales were obtained from the first quarter of 2001 through the fourth quarter of 2007. A regression model was estimated to describe the trend in e-commerce retail sales over time. What does the plot of residuals versus predicted values suggest?
A) The data are not normal.
B) The linearity condition is not satisfied.
C) The equal spread condition is not satisfied.
D) The data are not normal, and the linearity condition is not satisfied.
E) The linearity condition is not satisfied, and the equal spread condition is not satisfied.
A) The data are not normal.
B) The linearity condition is not satisfied.
C) The equal spread condition is not satisfied.
D) The data are not normal, and the linearity condition is not satisfied.
E) The linearity condition is not satisfied, and the equal spread condition is not satisfied.
Unlock Deck
Unlock for access to all 28 flashcards in this deck.
Unlock Deck
k this deck
9
Consider the following to answer the question(s) below:
A regression model was developed relating average annual pay to the percentage of women employed for a sample of companies. Below is the plot of residuals versus predicted values.
Which of the following re-expressions of the data would be appropriate?
A) Square the data values.
B) Cube the data values.
C) Use a logarithmic transformation.
D) Use a geometric transformation.
E) The data should not be transformed.
Unlock Deck
Unlock for access to all 28 flashcards in this deck.
Unlock Deck
k this deck
10
Consider the following to answer the question(s) below:
Monthly closing stock prices for a utility company were obtained from January 2007 through August 2008. A regression model was estimated to describe the trend in closing stock prices over time.
Suppose that for the regression model estimated using the data described, the Durbin-Watson statistic was calculated as 0.5626. Using α = 0.01 we can conclude that
A) There is evidence of positive autocorrelation.
B) There is evidence of negative autocorrelation.
C) There is no evidence of positive or negative autocorrelation.
D) There is evidence of an outlier.
E) The test is inconclusive.
Unlock Deck
Unlock for access to all 28 flashcards in this deck.
Unlock Deck
k this deck
11
Suppose that data on labour productivity and unit labour costs were obtained for the retail industry from 1990 through 2009. A regression was estimated to describe the linear relationship between the two variables.
a. Based on the plot of residuals versus predicted values, is the linear model appropriate? Explain. b. Would a re-expression of the data help? If so, what would you recommend?
a. Based on the plot of residuals versus predicted values, is the linear model appropriate? Explain.
b. Would a re-expression of the data help? If so, what would you recommend? Unlock Deck
Unlock for access to all 28 flashcards in this deck.
Unlock Deck
k this deck
12
The advertising campaign for a high fibre cereal wants to claim that high fibre cereals are lower in calories. In order to research this claim, they obtain nutritional information for 34 breakfast cereals including the amount of fibre (in grams) and the number of calories per serving. The data resulted in the following scatterplot. a. Do you think there is a clear pattern? Describe the association between fibre and calories.
b. Comment on any unusual data point or points in the data set. Explain.
c. Do you think a model could accurately predict the number of calories in a serving of cereal that has 22 grams of fibre? Explain.
a. Do you think there is a clear pattern? Describe the association between fibre and calories.b. Comment on any unusual data point or points in the data set. Explain.
c. Do you think a model could accurately predict the number of calories in a serving of cereal that has 22 grams of fibre? Explain.
Unlock Deck
Unlock for access to all 28 flashcards in this deck.
Unlock Deck
k this deck
13
Consider the following to answer the question(s) below:
Consider the following scatter diagram for 24 of the top grossing movies of all time. The data include the highest grossing films for which world box office receipts and budgets were available. The top two were Avatar and Titanic.
The effect of including the data for Avatar and Titanic is
A) to make the value of the slope of the regression line larger
B) to make the value of the slope of the regression line smaller
C) to decrease the correlation between the two variables
D) to reduce the residual standard deviation
E) cannot be determined with the information provided
Unlock Deck
Unlock for access to all 28 flashcards in this deck.
Unlock Deck
k this deck
14
A regression model was developed relating average annual pay to the percentage of women employed for a sample of companies. Below is the plot of residuals versus predicted values. a. What can you see in the plot of residuals that may not have been clear in the original scatterplot of the data?
b. Would a re-expression of the data help? If so, what would you recommend?
a. What can you see in the plot of residuals that may not have been clear in the original scatterplot of the data?b. Would a re-expression of the data help? If so, what would you recommend?
Unlock Deck
Unlock for access to all 28 flashcards in this deck.
Unlock Deck
k this deck
15
Data were collected for a sample of companies regarding their investment in quality improvement efforts and cost savings realized as a result (both measured as a percentage of sales revenue). Below is the scatterplot. The correlation coefficient for these data is r = 0.913. If data were collected for individual departments within companies rather than at the company level, would you expect the correlation to be weaker, stronger or about the same? Explain.
The correlation coefficient for these data is r = 0.913. If data were collected for individual departments within companies rather than at the company level, would you expect the correlation to be weaker, stronger or about the same? Explain. Unlock Deck
Unlock for access to all 28 flashcards in this deck.
Unlock Deck
k this deck
16
Monthly closing stock prices for a utility company were obtained from January 2007 through August 2008. A regression model was estimated to describe the trend in closing stock prices over time.
a. Based on the plot of residuals versus predicted values, is the linear model appropriate? Explain. b. The Durbin-Watson statistic for this regression was found to be 0.5626. What can you conclude from this statistic at the 0.01 level of significance?
a. Based on the plot of residuals versus predicted values, is the linear model appropriate? Explain.
b. The Durbin-Watson statistic for this regression was found to be 0.5626. What can you conclude from this statistic at the 0.01 level of significance? Unlock Deck
Unlock for access to all 28 flashcards in this deck.
Unlock Deck
k this deck
17
Quarterly figures for e-commerce retail sales were obtained from the first quarter of 2001 through the fourth quarter of 2007. A regression model was estimated to describe the trend in e-commerce retail sales over time. Suppose that for the regression model estimated using the data described, the Durbin-Watson statistic was calculated as 1.727. Using α = 0.01 we can conclude that
A) There is evidence of positive autocorrelation.
B) There is evidence of negative autocorrelation.
C) There is no evidence of positive or negative autocorrelation.
D) There is evidence of an outlier.
E) The test is inconclusive.
A) There is evidence of positive autocorrelation.
B) There is evidence of negative autocorrelation.
C) There is no evidence of positive or negative autocorrelation.
D) There is evidence of an outlier.
E) The test is inconclusive.
Unlock Deck
Unlock for access to all 28 flashcards in this deck.
Unlock Deck
k this deck
18
What does the plot of the residuals and the fitted values suggest?
A) The equal spread condition is not satisfied.
B) The data are not normal.
C) The linearity condition is not satisfied.
D) There may be autocorrelation.
E) It does not indicate any of the above.
A) The equal spread condition is not satisfied.
B) The data are not normal.
C) The linearity condition is not satisfied.
D) There may be autocorrelation.
E) It does not indicate any of the above.
Unlock Deck
Unlock for access to all 28 flashcards in this deck.
Unlock Deck
k this deck
19
Data were collected for a sample of companies regarding their investment in quality improvement efforts and cost savings realized as a result (both measured as a percentage of sales revenue). The correlation coefficient for these data is r = 0.913. If the data were collected for individual departments within companies rather than at the company level, we would expect
A) a stronger correlation
B) a weaker correlation
C) the same correlation
D) fewer outliers in the data
E) No expectation with regards to regression modeling can be drawn from the given information.
A) a stronger correlation
B) a weaker correlation
C) the same correlation
D) fewer outliers in the data
E) No expectation with regards to regression modeling can be drawn from the given information.
Unlock Deck
Unlock for access to all 28 flashcards in this deck.
Unlock Deck
k this deck
20
Consider the following to answer the question(s) below:
Monthly closing stock prices for a utility company were obtained from January 2007 through August 2008. A regression model was estimated to describe the trend in closing stock prices over time.
What does the plot of residuals below suggest?
A) An outlier is present in the data set.
B) The linearity condition is not satisfied.
C) A high leverage point is present in the data set.
D) The data are not normal.
E) The equal spread condition is not satisfied.
Unlock Deck
Unlock for access to all 28 flashcards in this deck.
Unlock Deck
k this deck
21
Consider the following to answer the question(s) below:
Suppose that data on labour productivity and unit labour costs were obtained for the retail industry from 1990 through 2009. A regression was estimated to describe the linear relationship between the two variables.
Which of the following re-expressions of the data would be appropriate?
A) Use a logarithmic transformation.
B) Square the data.
C) Use a geometric transformation.
D) Take the square root of the data.
E) Take the reciprocal of the data.
Unlock Deck
Unlock for access to all 28 flashcards in this deck.
Unlock Deck
k this deck
22
Consider the following to answer the question(s) below:
Suppose that data on labour productivity and unit labour costs were obtained for the retail industry from 1990 through 2009. A regression was estimated to describe the linear relationship between the two variables.
What does the plot of residuals suggest?
A) The linearity condition is not satisfied, and the equal spread condition is not satisfied.
B) The data are not normal.
C) The equal variance condition is not met.
D) The linearity condition is not met.
E) The linearity condition is not met and the data is not normal.
Unlock Deck
Unlock for access to all 28 flashcards in this deck.
Unlock Deck
k this deck
23
The best practice for modelling this data set given the scatter plot would be
A) to estimate the model both including and excluding the data for Avatar and Titanic and then to compare the equations
B) to include the data for Avatar and Titanic and use this equation
C) to exclude the data for Avatar and Titanic and use this equation
D) to find different data that will measure box office success
E) to model a nonlinear form of the equation
Unlock Deck
Unlock for access to all 28 flashcards in this deck.
Unlock Deck
k this deck
24
A new movie is in the making which has a budget of $350 million. What would the equation in the scatter diagram predict for its box office receipts?
A) $1,693 million
B) $2,388 million
C) $1,010 million
D) $328 million
E) $3,000 million
A) $1,693 million
B) $2,388 million
C) $1,010 million
D) $328 million
E) $3,000 million
Unlock Deck
Unlock for access to all 28 flashcards in this deck.
Unlock Deck
k this deck
25
A new movie is in the making which has a budget of $350 million. Using the equation in the scatter diagram to predict sales we can say
A) that the prediction is an extrapolation
B) that the assumption that nothing about the relationship between budget and sales will change does not have to be made
C) that we should be cautious with a prediction such as this since it is beyond the range of the x-values
D) that our prediction is trustworthy
E) A and C are true.
Unlock Deck
Unlock for access to all 28 flashcards in this deck.
Unlock Deck
k this deck
26
Consider the following to answer the question(s) below:
Suppose that data on labour productivity and unit labour costs were obtained for the retail industry from 1990 through 2009. A regression was estimated to describe the linear relationship between the two variables.
A model of retail sales of furniture and fixtures in Canada as a function of the value of building permits yielded the following equation. log10 Sales = 2.33 + 0.57 log10 Value of permits
What is the predicted value of retail sales if the value of building permits is 700,000?
A) $458,887.14
B) $5.66
C) $2,137.96
D) $3.33
E) $22,060.33
Unlock Deck
Unlock for access to all 28 flashcards in this deck.
Unlock Deck
k this deck
27
Consider the following to answer the question(s) below:
The average monthly residential mortgage lending rate in Canada is available monthly beginning in 1951. A scatterplot of the residuals against time for 747 months from January 1951 to March 2013 is shown below. The rate peaked in September of 1981 at 21.46%. The Durbin-Watson statistic has a value of 0.01.
The critical values for the Durbin-Watson statistic for α = 0.05 and n = 750 are: dL= 1.87736 and dU = 1.88270. What does this tell us about the assumption of the independence of the errors?
A) The assumption of independent errors is violated.
B) The assumption of independent errors is not violated.
C) The errors are not related to one another over time.
D) This test is not valid for time series data.
E) This evidence does not allow us to draw any conclusions in this regard.
The average monthly residential mortgage lending rate in Canada is available monthly beginning in 1951. A scatterplot of the residuals against time for 747 months from January 1951 to March 2013 is shown below. The rate peaked in September of 1981 at 21.46%.
The Durbin-Watson statistic has a value of 0.01.The critical values for the Durbin-Watson statistic for α = 0.05 and n = 750 are: dL= 1.87736 and dU = 1.88270. What does this tell us about the assumption of the independence of the errors?
A) The assumption of independent errors is violated.
B) The assumption of independent errors is not violated.
C) The errors are not related to one another over time.
D) This test is not valid for time series data.
E) This evidence does not allow us to draw any conclusions in this regard.
Unlock Deck
Unlock for access to all 28 flashcards in this deck.
Unlock Deck
k this deck
28
Consider the following to answer the question(s) below:
The average monthly residential mortgage lending rate in Canada is available monthly beginning in 1951. A scatterplot of the residuals against time for 747 months from January 1951 to March 2013 is shown below. The rate peaked in September of 1981 at 21.46%. The Durbin-Watson statistic has a value of 0.01.
What conclusion about autocorrelation in the model can we draw using the value of the Durbin-Watson statistic and the critical limits, dL=1.87736 and dU=1.88270?
A) There is evidence of positive autocorrelation.
B) There is evidence of negative autocorrelation.
C) There is no evidence of positive autocorrelation.
D) There is no evidence of negative autocorrelation.
E) The test is inconclusive.
The average monthly residential mortgage lending rate in Canada is available monthly beginning in 1951. A scatterplot of the residuals against time for 747 months from January 1951 to March 2013 is shown below. The rate peaked in September of 1981 at 21.46%.
The Durbin-Watson statistic has a value of 0.01.What conclusion about autocorrelation in the model can we draw using the value of the Durbin-Watson statistic and the critical limits, dL=1.87736 and dU=1.88270?
A) There is evidence of positive autocorrelation.
B) There is evidence of negative autocorrelation.
C) There is no evidence of positive autocorrelation.
D) There is no evidence of negative autocorrelation.
E) The test is inconclusive.
Unlock Deck
Unlock for access to all 28 flashcards in this deck.
Unlock Deck
k this deck
Unlock Deck
Unlock for access to all 28 flashcards in this deck.


