Deck 45: Systems of Inequalities
Full screen (f)
Question
Select the correct graph of the inequality.
A)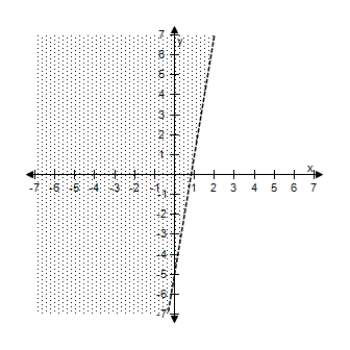
B)
C)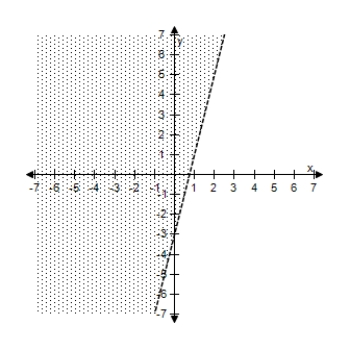
D)
E)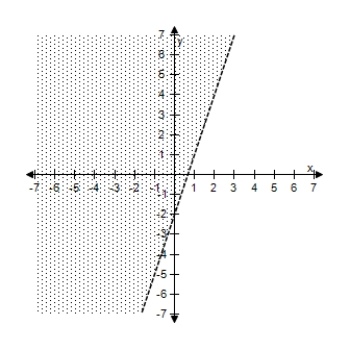
A)
B)
C)
D)
E)
Question
Select the correct graph of the inequality.
A)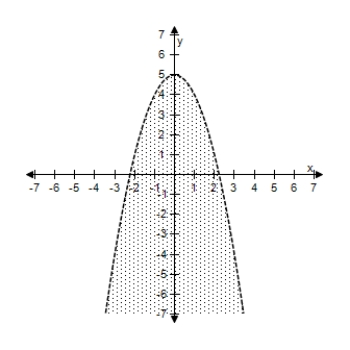
B)
C)
D)
E)
A)
B)
C)
D)
E)
Question
Select the correct graph of the inequality.
A)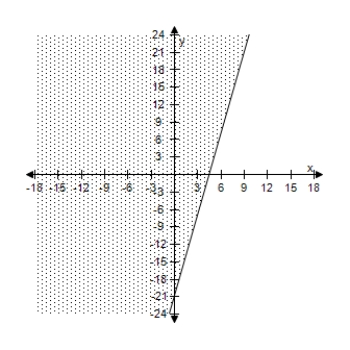
B)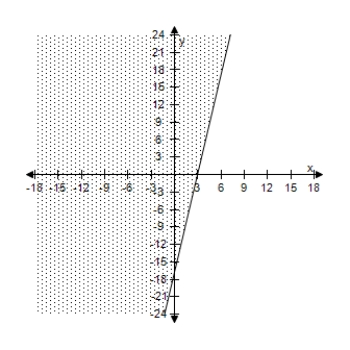
C)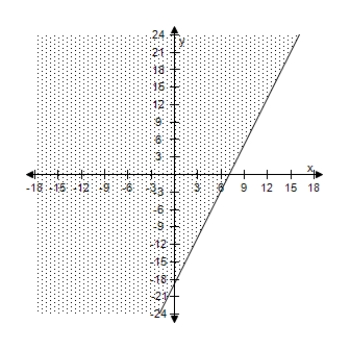
D)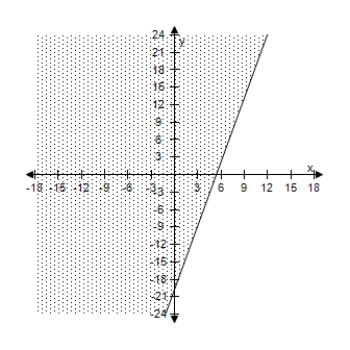
E)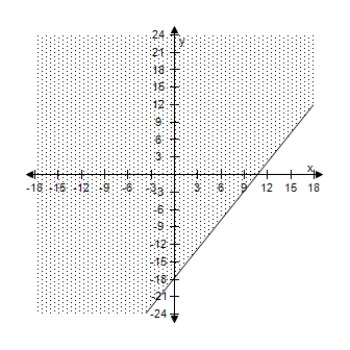
A)
B)
C)
D)
E)
Question
Select the correct graph of the inequality.
A)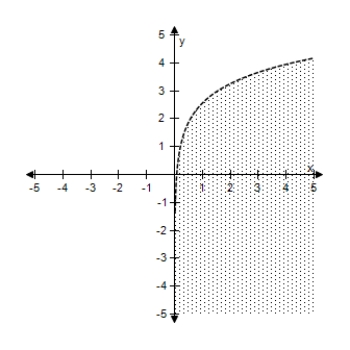
B)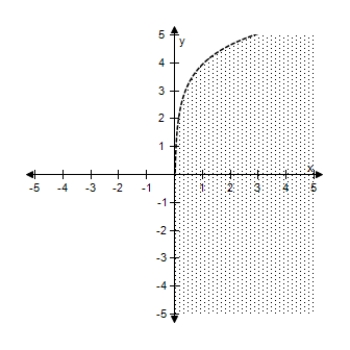
C)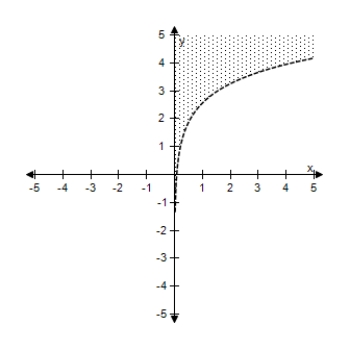
D)
E)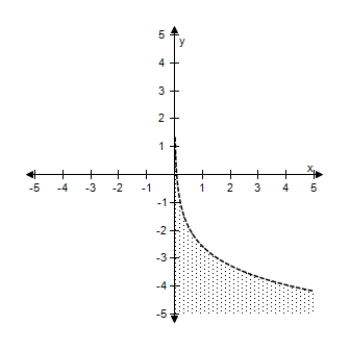
A)
B)
C)
D)
E)
Question
Select the correct graph of the inequality.
A)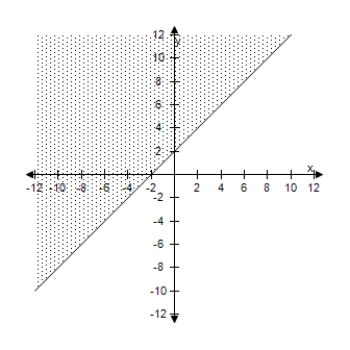
B)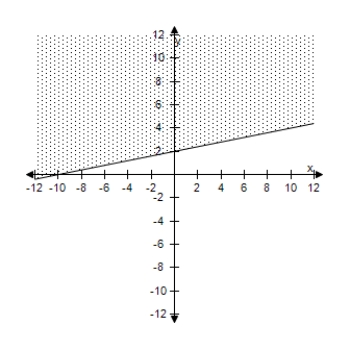
C)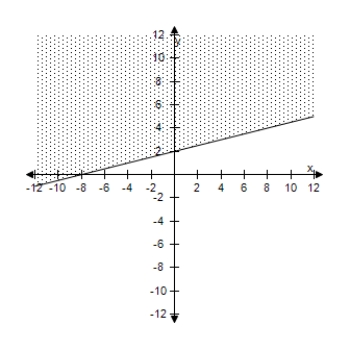
D)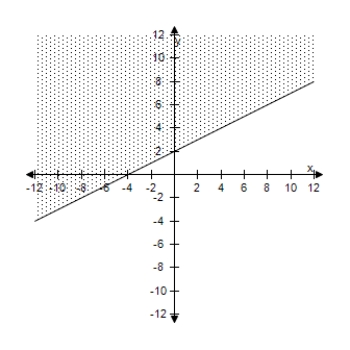
E)
A)
B)
C)
D)
E)
Question
Select the correct graph of the inequality.
A)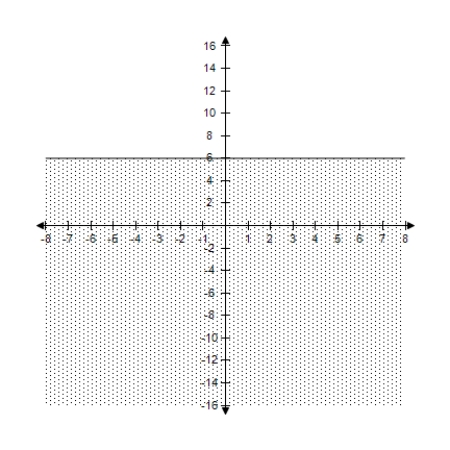
B)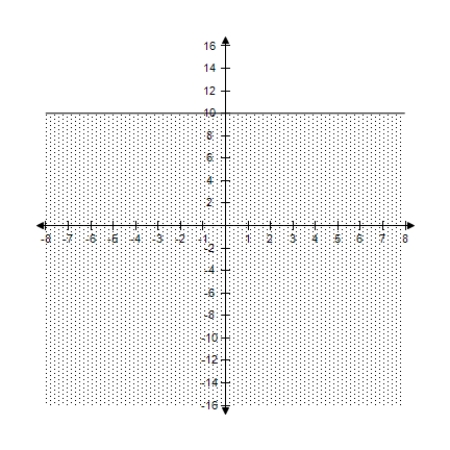
C)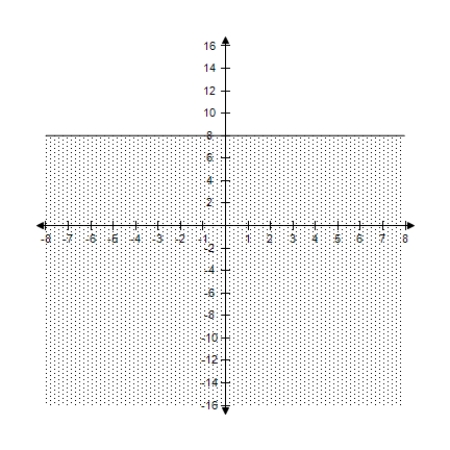
D)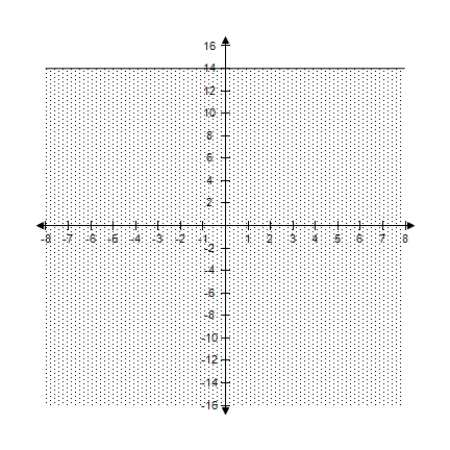
E)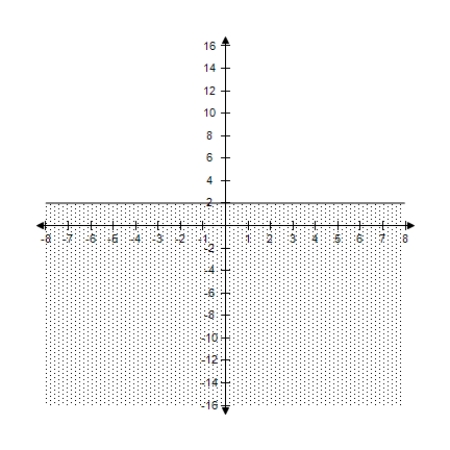
A)
B)
C)
D)
E)
Question
Select the correct graph of the inequality.
A)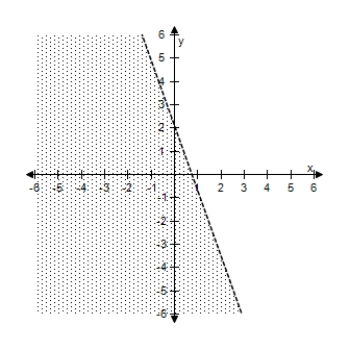
B)
C)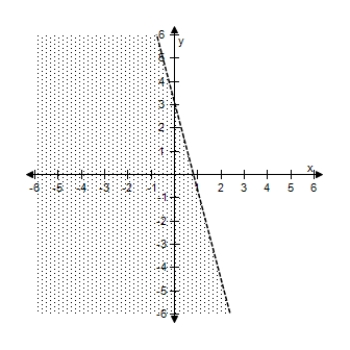
D)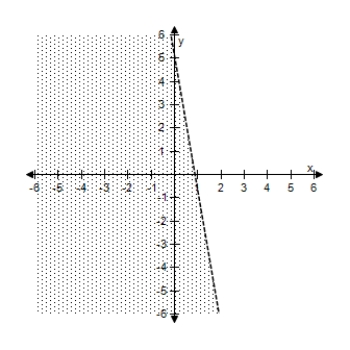
E)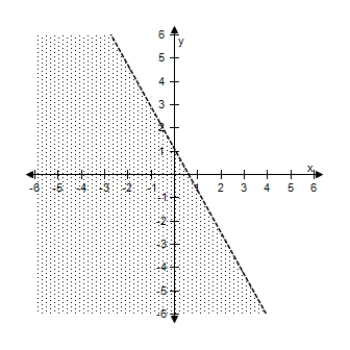
A)
B)
C)
D)
E)
Question
Select the correct graph of the inequality.
A)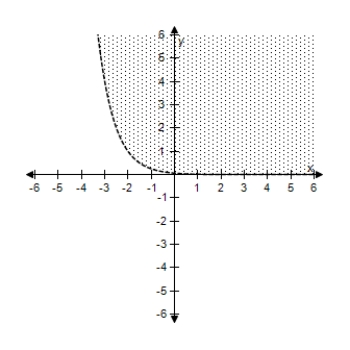
B)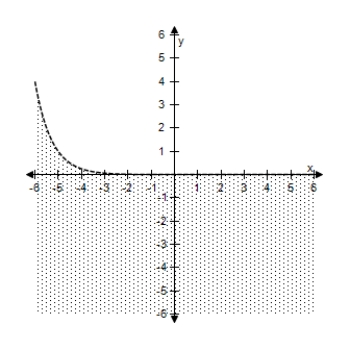
C)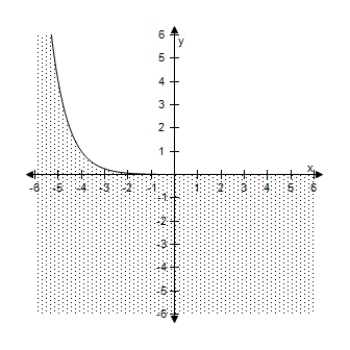
D)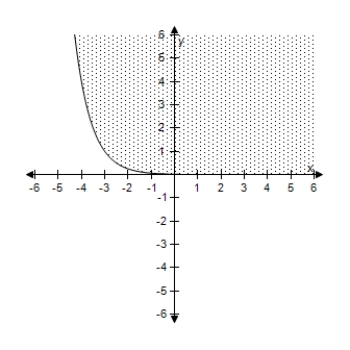
E)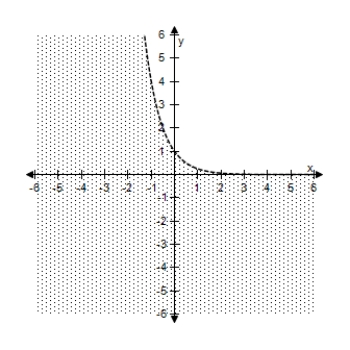
A)
B)
C)
D)
E)
Question
Select the correct graph of the inequality.
A)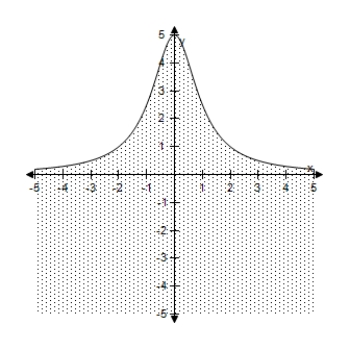
B)
C)
D)
E)
A)
B)
C)
D)
E)
Question
Select the correct graph of the inequality.
A)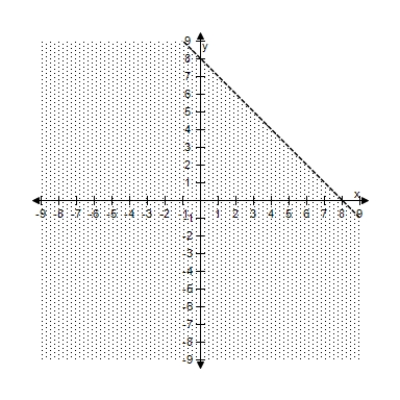
B)
C)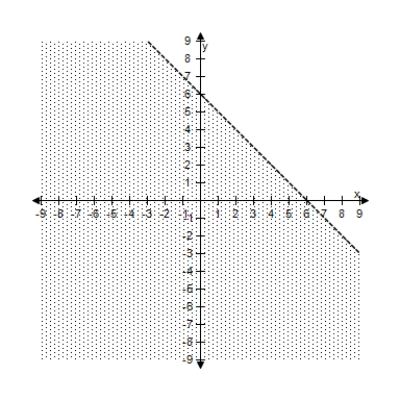
D)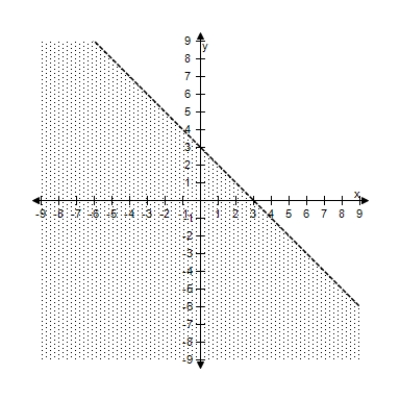
E)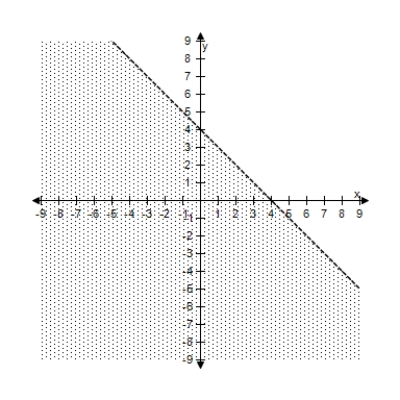
A)
B)
C)
D)
E)
Question
Select the correct graph of the inequality.
A)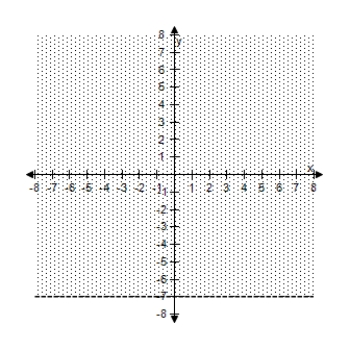
B)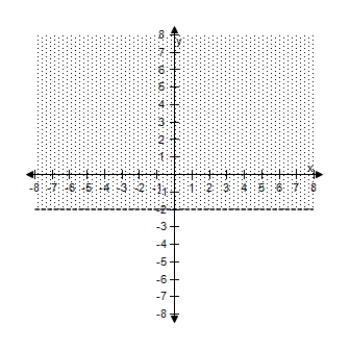
C)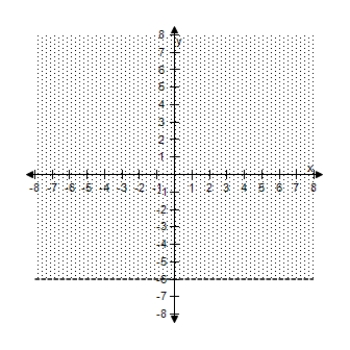
D)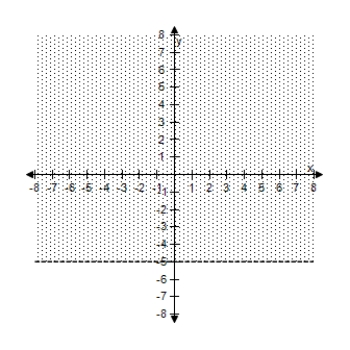
E)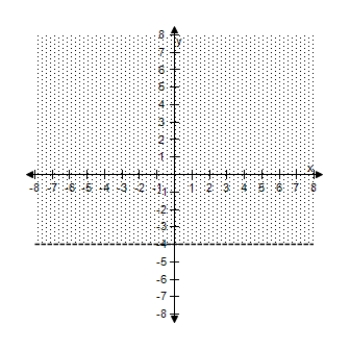
A)
B)
C)
D)
E)
Question
Select the correct graph of the inequality.
A)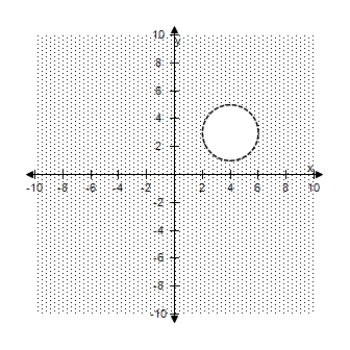
B)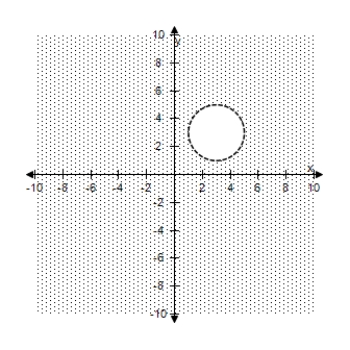
C)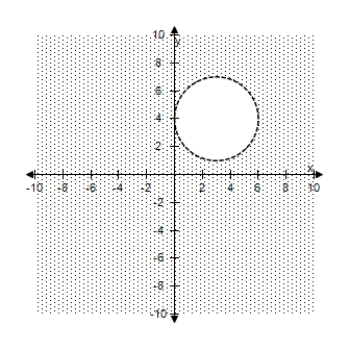
D)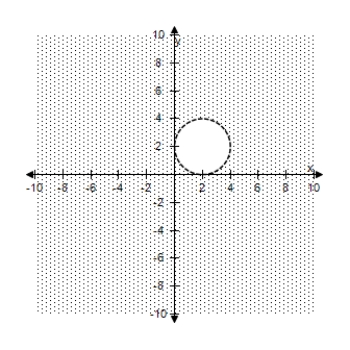
E)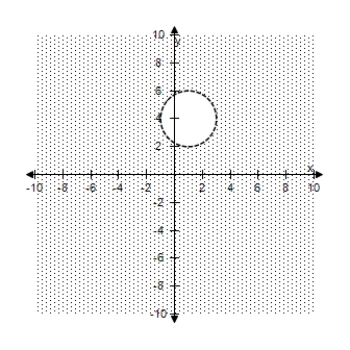
A)
B)
C)
D)
E)
Question
Select the correct graph of the inequality.
A)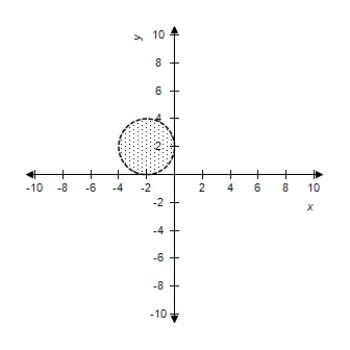
B)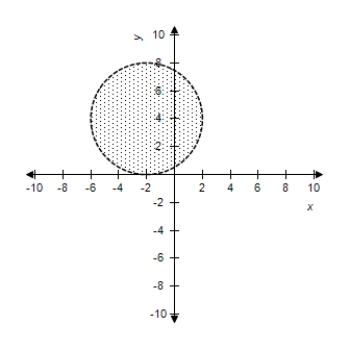
C)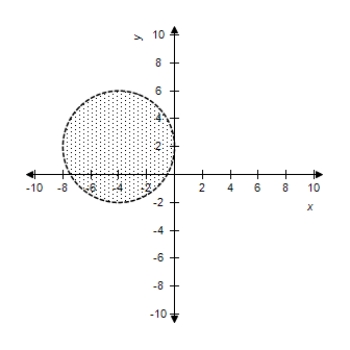
D)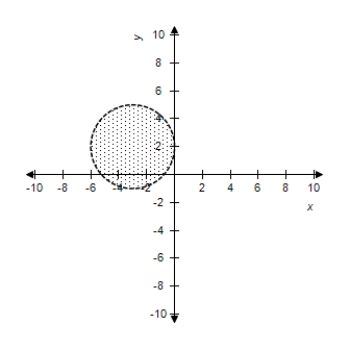
E)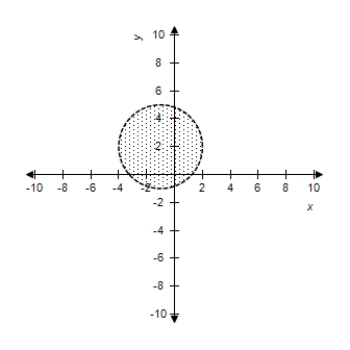
A)
B)
C)
D)
E)
Question
Select the correct graph of the inequality.
A)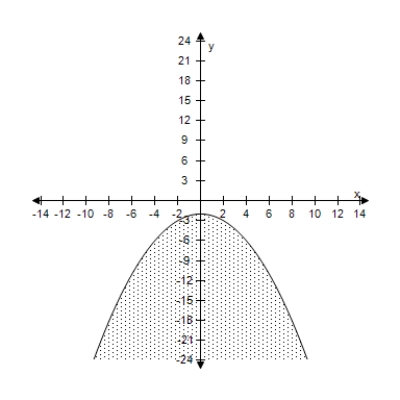
B)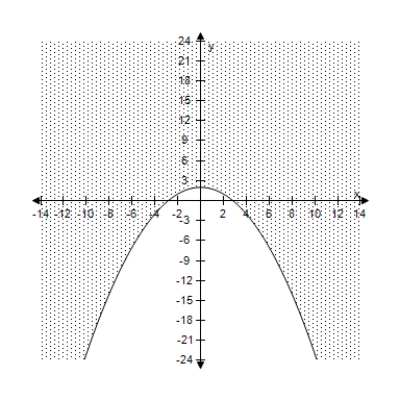
C)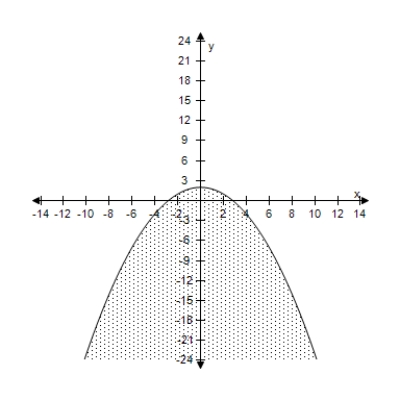
D)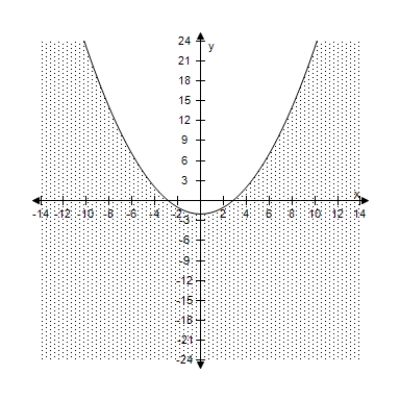
E)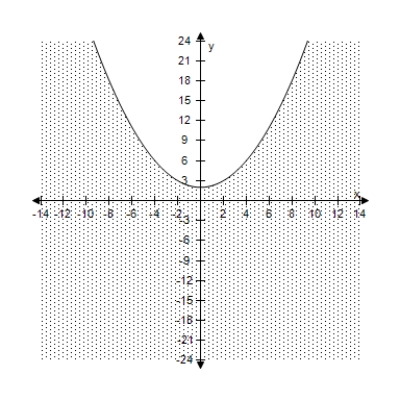
A)
B)
C)
D)
E)
Question
Select the correct graph of the inequality.
A)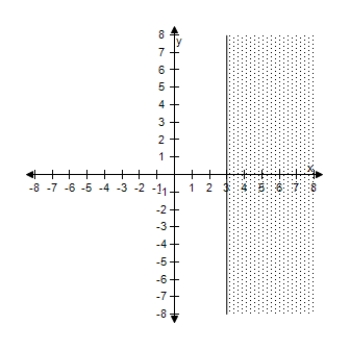
B)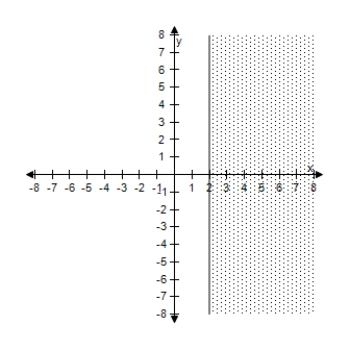
C)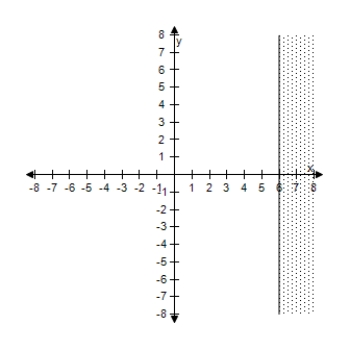
D)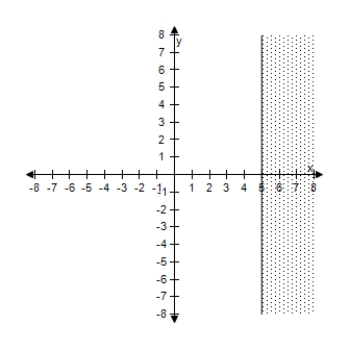
E)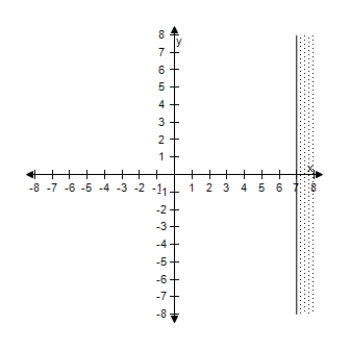
A)
B)
C)
D)
E)
Question
Select the correct graph of the inequality.
A)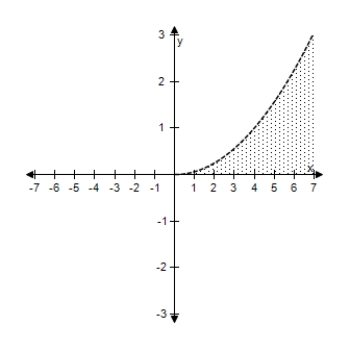
B)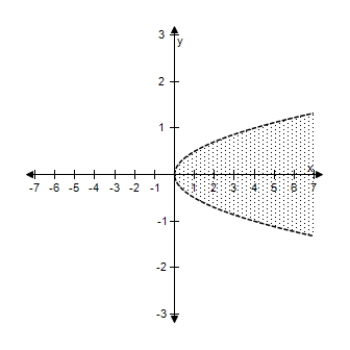
C)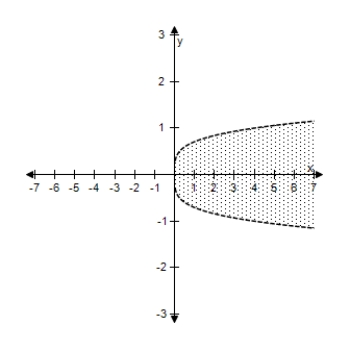
D)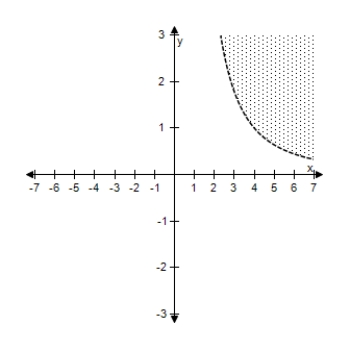
E)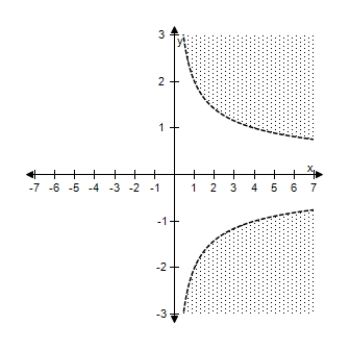
A)
B)
C)
D)
E)
Question
Select the correct graph of the inequality.
A)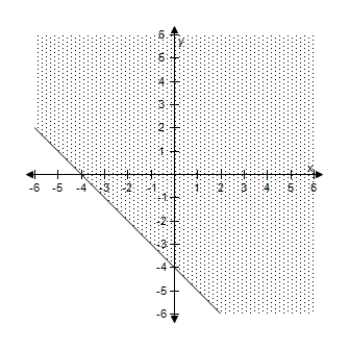
B)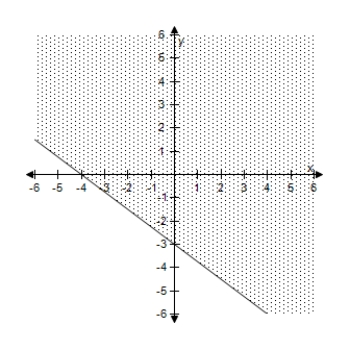
C)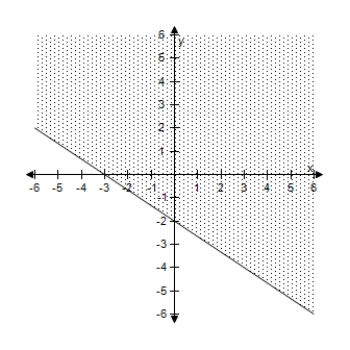
D)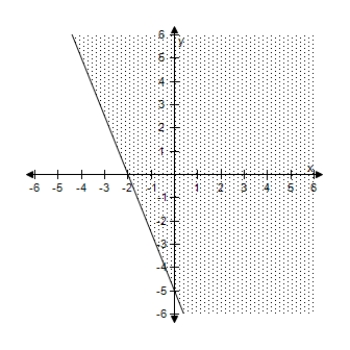
E)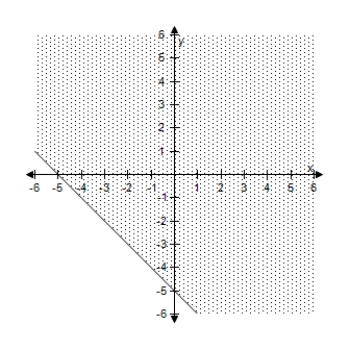
A)
B)
C)
D)
E)
Question
Select the correct graph of the inequality.
A)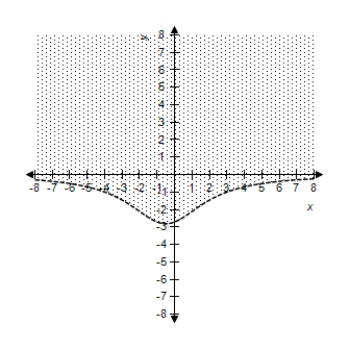
B)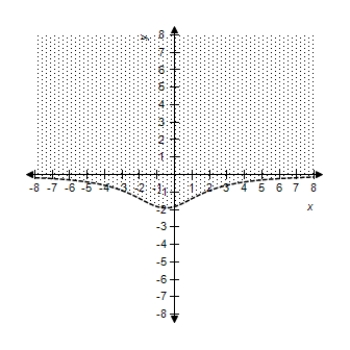
C)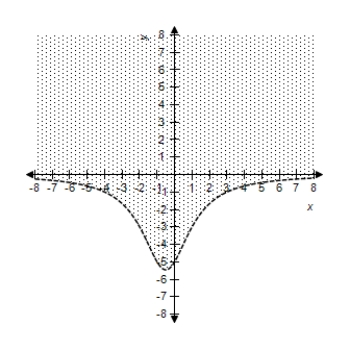
D)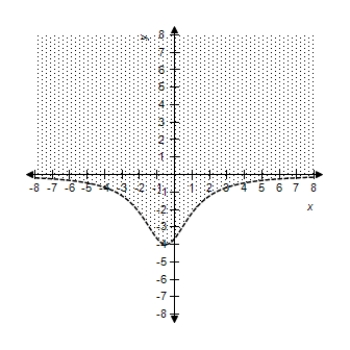
E)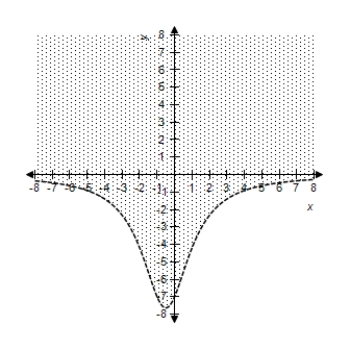
A)
B)
C)
D)
E)
Question
Select the correct graph of the inequality.
A)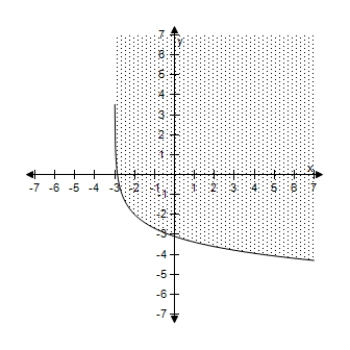
B)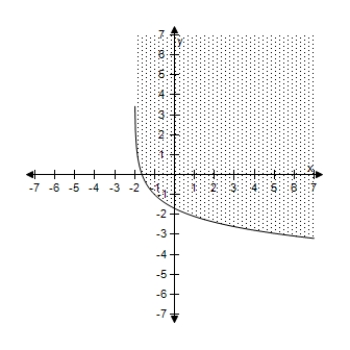
C)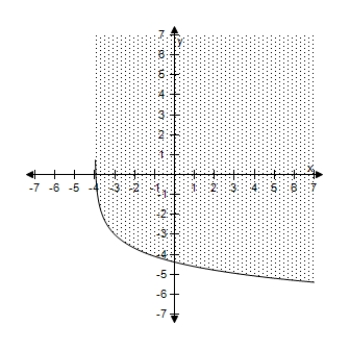
D)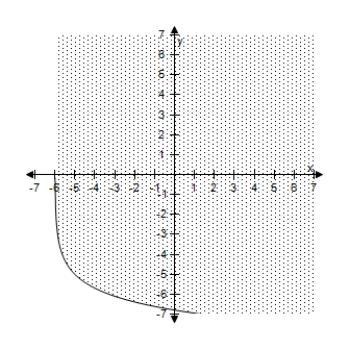
E)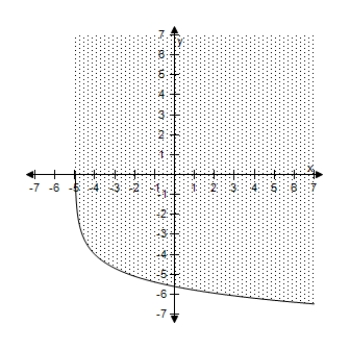
A)
B)
C)
D)
E)
Question
Select the correct graph of the inequality.
A)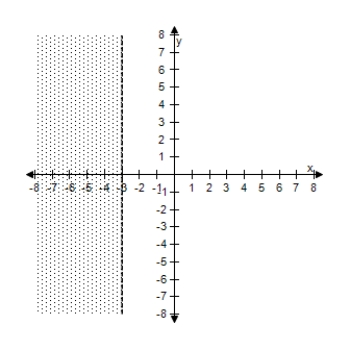
B)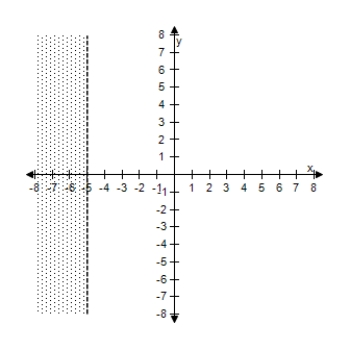
C)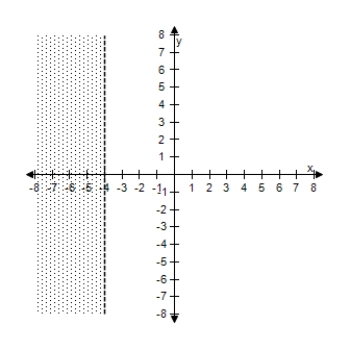
D)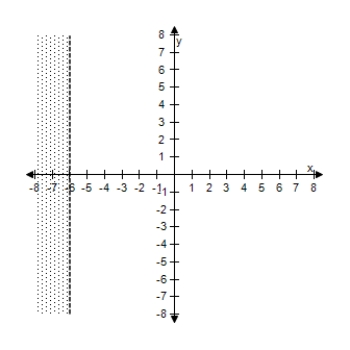
E)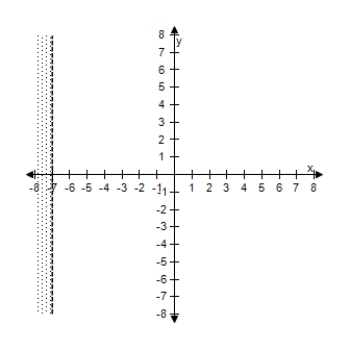
A)
B)
C)
D)
E)
Question
For a concert event,there are $30 reserved seat tickets and $20 general admission tickets.There are 2000 reserved seats available,and fire regulations limit the number of paid ticket holders to 3000.The promoter must take in at least $65,000 in ticket sales.Find and graph a system of inequalities describing the different numbers of tickets that can be sold.
A) 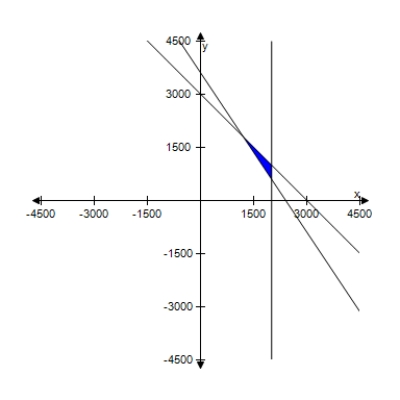
B) 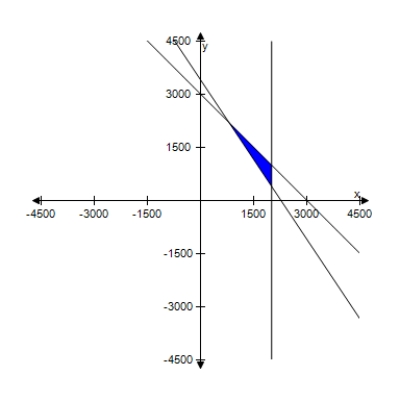
C)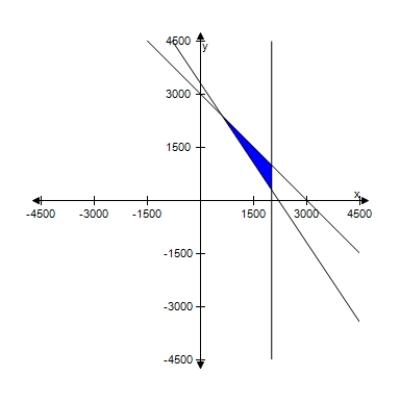
D) 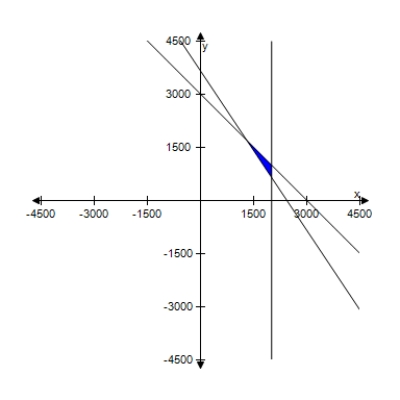
E) 
A)
B)
C)
D)
E)
Question
Question
A dietitian is asked to design a special dietary supplement using two different foods.Each ounce of food X contains 20 units of calcium,15 units of iron,and 10 units of vitamin B.Each ounce of food Y contains 10 units of calcium,10 units of iron,and 20 units of vitamin B.The minimum daily requirements of the diet are 350 units of calcium,300 units of iron,and 400 units of vitamin B.Sketch a graph of the region corresponding to the system inequalities describing the different amounts of food X and food Y that can be used.
A)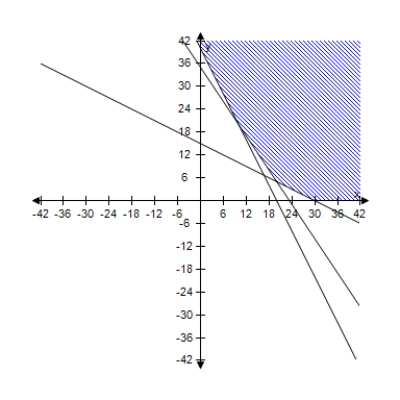
B)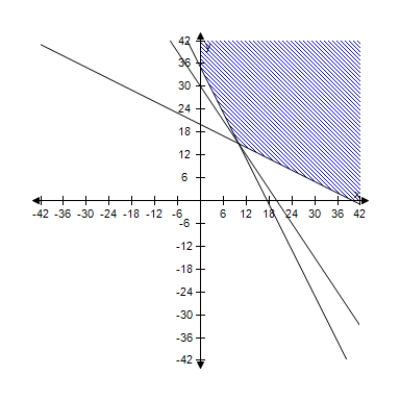
C)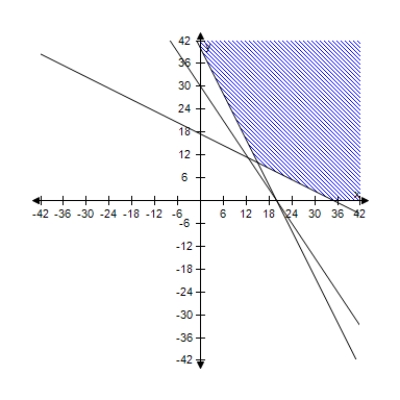
D)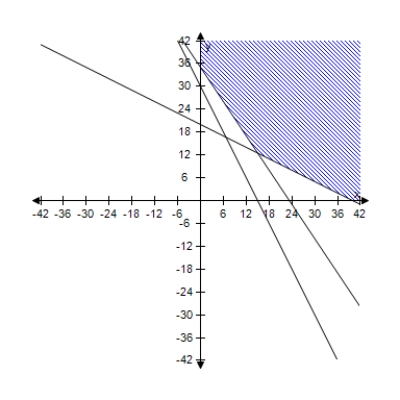
E)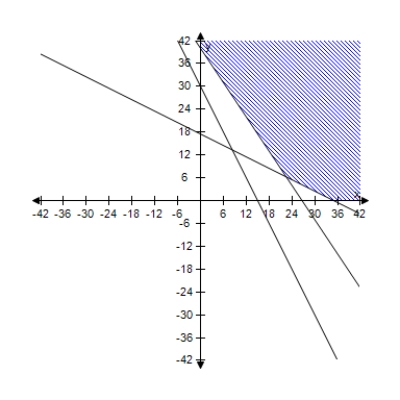
A)
B)
C)
D)
E)
Question
Select the correct graph of the inequality.
A)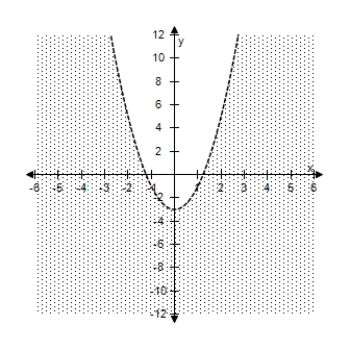
B)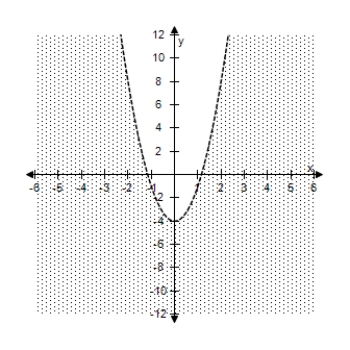
C)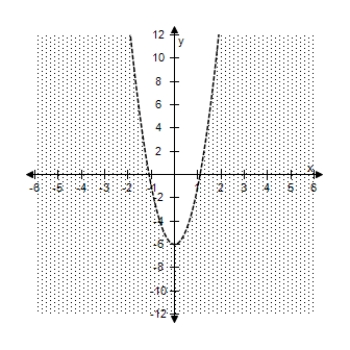
D)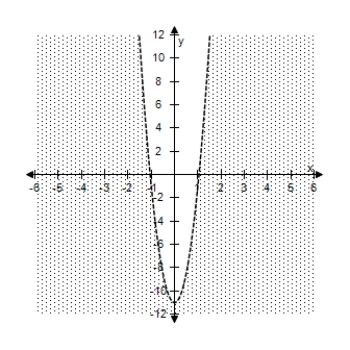
E)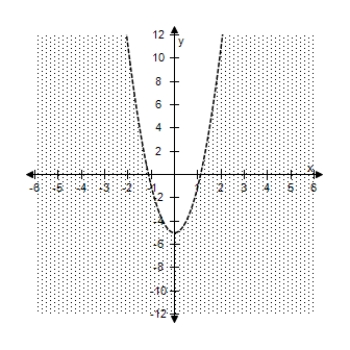
A)
B)
C)
D)
E)
Question
A person plans to invest up to $26,000 in two different interest-bearing accounts.Each account is to contain at least $5000.Moreover,the amount in one account should be at least twice the amount in the other account.Find and graph a system of inequalities to describe the various amounts that can be deposited in each account.
A)
B) 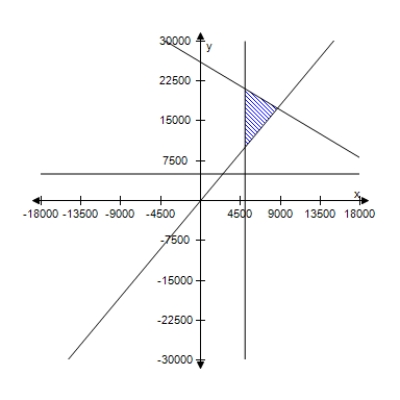
C) 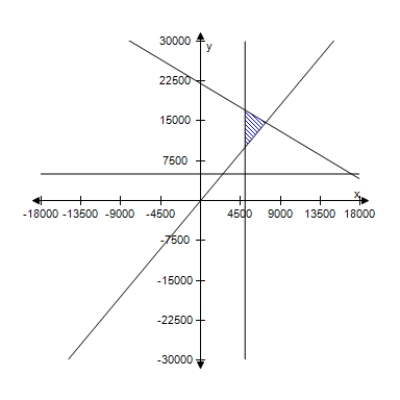
D) 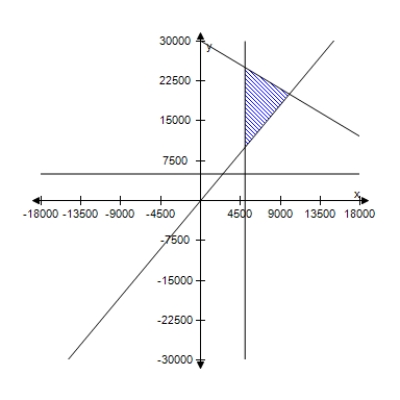
E) 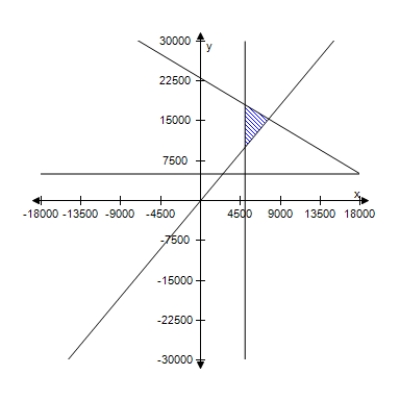
A)
B)
C)
D)
E)
Question
Select an inequality for the shaded region shown in the figure. 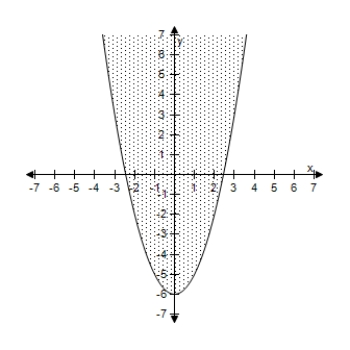
A)
B)
C)
D)
E)
A)
B)
C)
D)
E)
Question
A store sells two models of laptop computers.Because of the demand,the store stocks at least twice as many units of model A as of model B.The costs to the store for the two models are $800 and $1200,respectively.The management does not want more than $29,000 in computer inventory at any one time,and it wants at least four model A laptop computers and two model B laptop computers in inventory at all times.Find and graph a system of inequalities describing all possible inventory levels.
A)
B) 
C) 
D)
E) 
A)
B)
C)
D)
E)
Question
Question
A small company that manufactures two models of exercise machines has an order for 17 units of the standard model and 18 units of the deluxe model.The company has trucks of two different sizes that can haul the products,as shown in the table.
Find and graph a system of inequalities describing the numbers of trucks of each size that are needed to deliver the order.
A) 
B)
C) 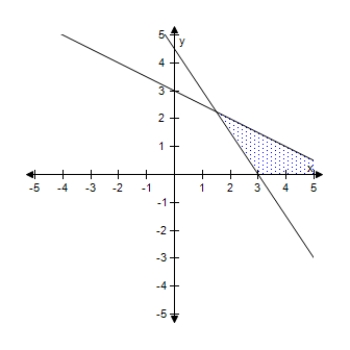
D) 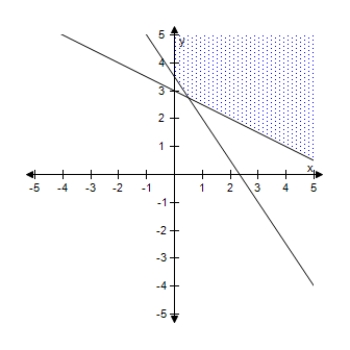
E) 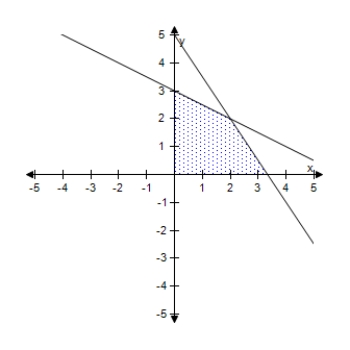
Find and graph a system of inequalities describing the numbers of trucks of each size that are needed to deliver the order.
A)
B)
C)
D)
E)
Question
Question
Use a graphing utility to graph the inequality.
A)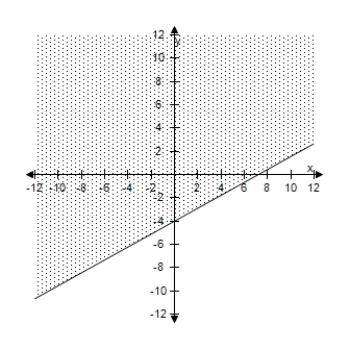
B)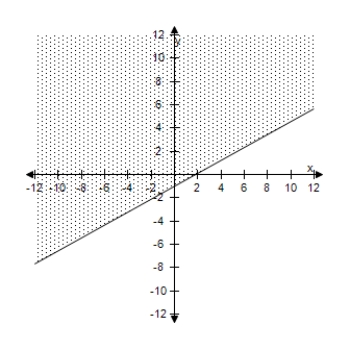
C)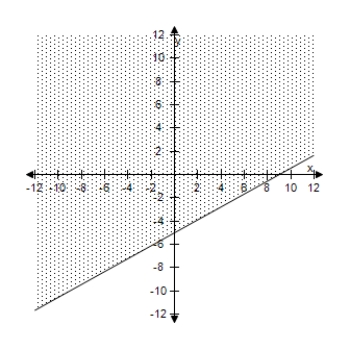
D)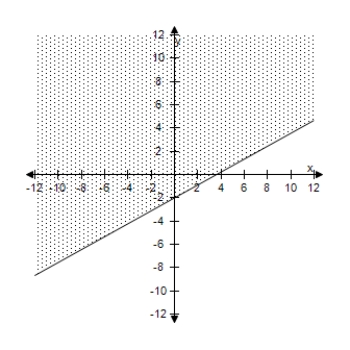
E)
A)
B)
C)
D)
E)
Question
A warehouse supervisor is told to ship at least 50 packages of gravel that weigh 55 pounds each and at least 40 bags of stone that weigh 70 pounds each.The maximum weight capacity of the truck to be used is 9,500 pounds.Find and graph a system of inequalities describing the numbers of bags of stone and gravel that can be shipped.
A) 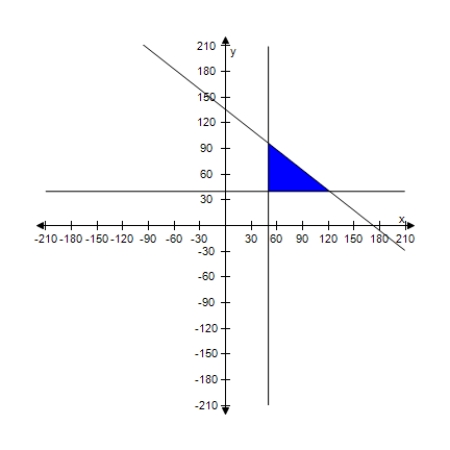
B)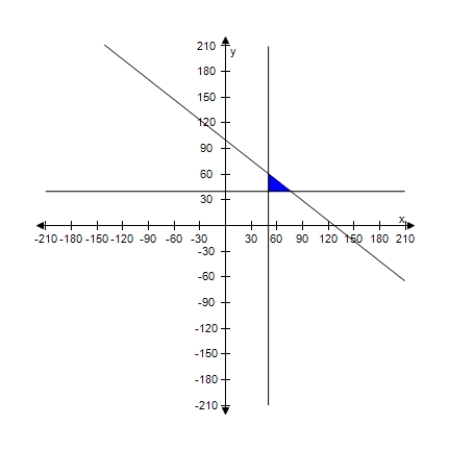
C) 
D)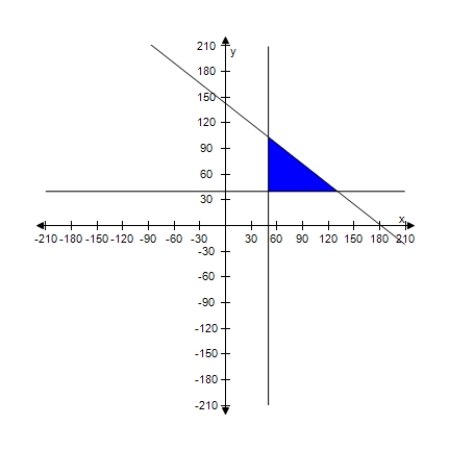
E) 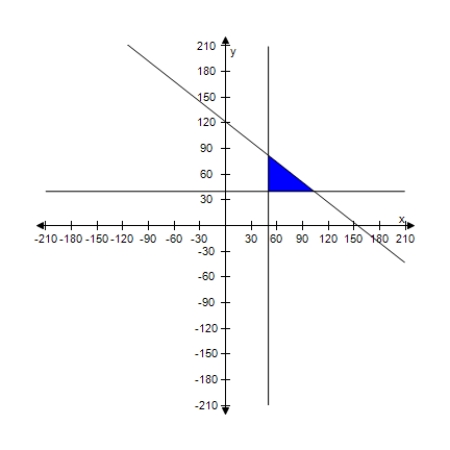
A)
B)
C)
D)
E)
Question
Select a set of inequalities to describe the region. 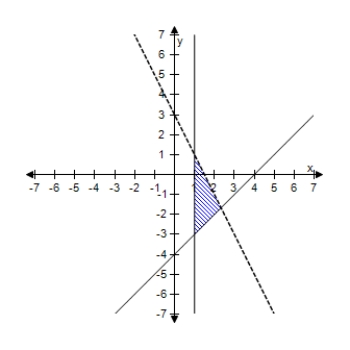
A)
B)
C)
D)
E)
A)
B)
C)
D)
E)
Question
Select an inequality for the shaded region shown in the figure. 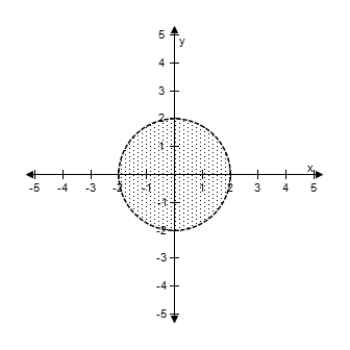
A)
B)
C)
D)
E)
A)
B)
C)
D)
E)
Question
Select an inequality to describe the region. 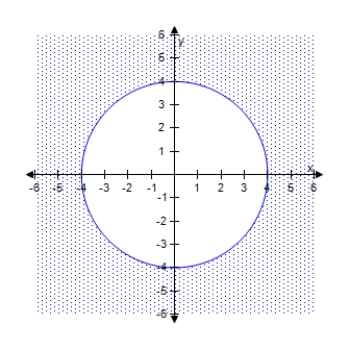
A)
B)
C)
D)
E)
A)
B)
C)
D)
E)
Question
Question
Select a set of inequalities to describe the region. 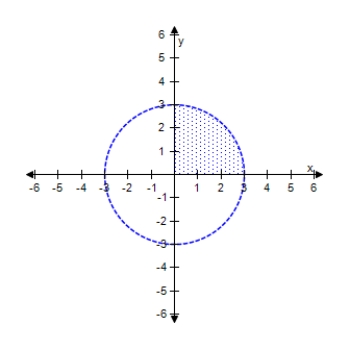
A)
B)
C)
D)
E)
A)
B)
C)
D)
E)
Question
Question
Select an inequality for the shaded region shown in the figure. 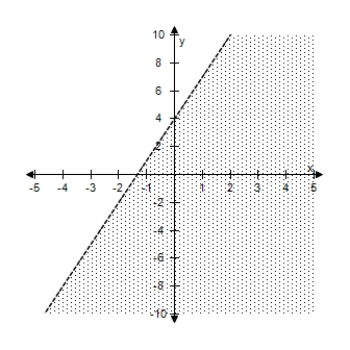
A)
B)
C)
D)
E)
A)
B)
C)
D)
E)
Question
Question
Use a graphing utility to graph the inequalities.Shade the region representing the solution set of the system.
A) 10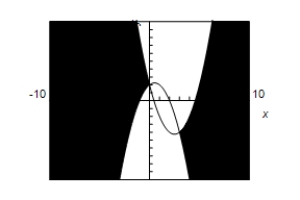 -10
-10
B)10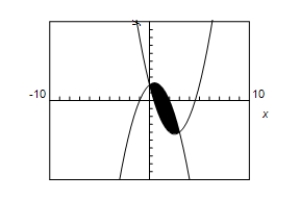 -10
-10
C)10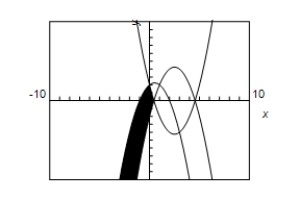 -10
-10
D) 10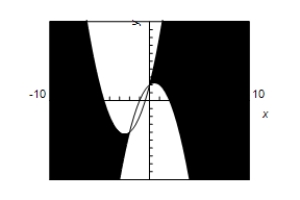 -10
-10
E)10 -10
-10
A) 10
-10B)10
-10C)10
-10D) 10
-10E)10
-10 Question
Sketch the graph and label the vertices of the solution set of the system of inequalities.Shade the solution set. 
A)
B)
C)
D)
E)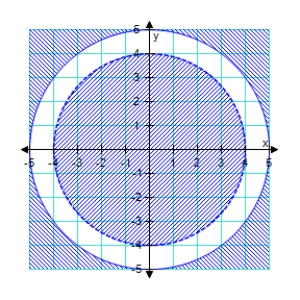
A)
B)
C)
D)
E)
Question
Question
Question
Write an inequality for the shaded region shown in the figure. 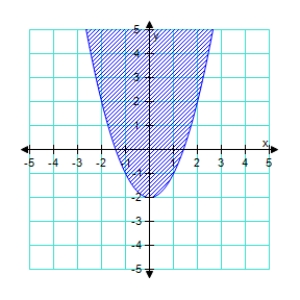
A)
B)y ≥
C)y ≤
D)y ≥
E)y ≥
A)
B)y ≥
C)y ≤
D)y ≥
E)y ≥
Question
Use a graphing utility to graph the inequality.Shade the region representing the solution. ≤
A)10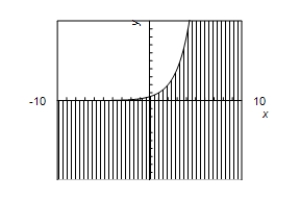 -10
-10
B) 10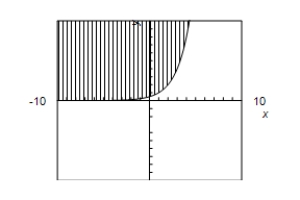 -10
-10
C)10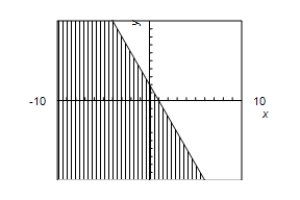 -10
-10
D)10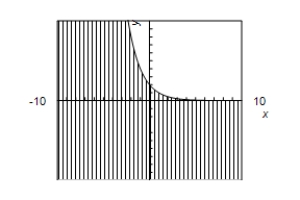 -10
-10
E) 10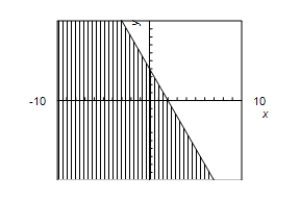 -10
-10
A)10
-10B) 10
-10C)10
-10D)10
-10E) 10
-10 Question
Question
Derive a set of inequalities to describe the region. 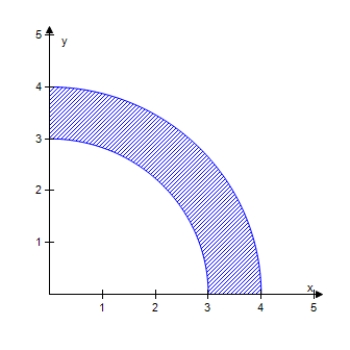
A)
B)
C)
D)
E)
A)
B)
C)
D)
E)
Question
Question
Sketch the graph of the inequality. < 4 
A)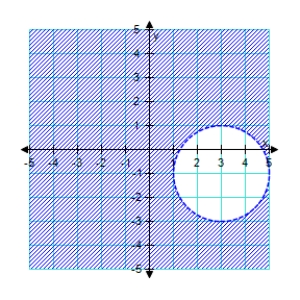
B)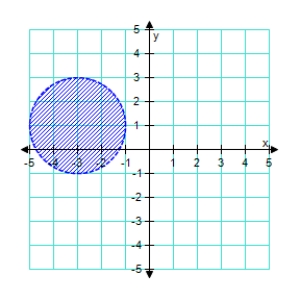
C)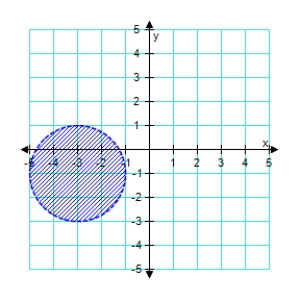
D)
E)
A)
B)
C)
D)
E)

Unlock Deck
Sign up to unlock the cards in this deck!
Unlock Deck
Unlock Deck
1/50
Play
Full screen (f)
Deck 45: Systems of Inequalities
1
Select the correct graph of the inequality.
A)
B)
C)
D)
E)
A)
B)
C)
D)
E)
2
Select the correct graph of the inequality.
A)
B)
C)
D)
E)
A)
B)
C)
D)
E)
3
Select the correct graph of the inequality.
A)
B)
C)
D)
E)
A)
B)
C)
D)
E)
4
Select the correct graph of the inequality.
A)
B)
C)
D)
E)
A)
B)
C)
D)
E)
Unlock Deck
Unlock for access to all 50 flashcards in this deck.
Unlock Deck
k this deck
5
Select the correct graph of the inequality.
A)
B)
C)
D)
E)
A)
B)
C)
D)
E)
Unlock Deck
Unlock for access to all 50 flashcards in this deck.
Unlock Deck
k this deck
6
Select the correct graph of the inequality.
A)
B)
C)
D)
E)
A)
B)
C)
D)
E)
Unlock Deck
Unlock for access to all 50 flashcards in this deck.
Unlock Deck
k this deck
7
Select the correct graph of the inequality.
A)
B)
C)
D)
E)
A)
B)
C)
D)
E)
Unlock Deck
Unlock for access to all 50 flashcards in this deck.
Unlock Deck
k this deck
8
Select the correct graph of the inequality.
A)
B)
C)
D)
E)
A)
B)
C)
D)
E)
Unlock Deck
Unlock for access to all 50 flashcards in this deck.
Unlock Deck
k this deck
9
Select the correct graph of the inequality.
A)
B)
C)
D)
E)
A)
B)
C)
D)
E)
Unlock Deck
Unlock for access to all 50 flashcards in this deck.
Unlock Deck
k this deck
10
Select the correct graph of the inequality.
A)
B)
C)
D)
E)
A)
B)
C)
D)
E)
Unlock Deck
Unlock for access to all 50 flashcards in this deck.
Unlock Deck
k this deck
11
Select the correct graph of the inequality.
A)
B)
C)
D)
E)
A)
B)
C)
D)
E)
Unlock Deck
Unlock for access to all 50 flashcards in this deck.
Unlock Deck
k this deck
12
Select the correct graph of the inequality.
A)
B)
C)
D)
E)
A)
B)
C)
D)
E)
Unlock Deck
Unlock for access to all 50 flashcards in this deck.
Unlock Deck
k this deck
13
Select the correct graph of the inequality.
A)
B)
C)
D)
E)
A)
B)
C)
D)
E)
Unlock Deck
Unlock for access to all 50 flashcards in this deck.
Unlock Deck
k this deck
14
Select the correct graph of the inequality.
A)
B)
C)
D)
E)
A)
B)
C)
D)
E)
Unlock Deck
Unlock for access to all 50 flashcards in this deck.
Unlock Deck
k this deck
15
Select the correct graph of the inequality.
A)
B)
C)
D)
E)
A)
B)
C)
D)
E)
Unlock Deck
Unlock for access to all 50 flashcards in this deck.
Unlock Deck
k this deck
16
Select the correct graph of the inequality.
A)
B)
C)
D)
E)
A)
B)
C)
D)
E)
Unlock Deck
Unlock for access to all 50 flashcards in this deck.
Unlock Deck
k this deck
17
Select the correct graph of the inequality.
A)
B)
C)
D)
E)
A)
B)
C)
D)
E)
Unlock Deck
Unlock for access to all 50 flashcards in this deck.
Unlock Deck
k this deck
18
Select the correct graph of the inequality.
A)
B)
C)
D)
E)
A)
B)
C)
D)
E)
Unlock Deck
Unlock for access to all 50 flashcards in this deck.
Unlock Deck
k this deck
19
Select the correct graph of the inequality.
A)
B)
C)
D)
E)
A)
B)
C)
D)
E)
Unlock Deck
Unlock for access to all 50 flashcards in this deck.
Unlock Deck
k this deck
20
Select the correct graph of the inequality.
A)
B)
C)
D)
E)
A)
B)
C)
D)
E)
Unlock Deck
Unlock for access to all 50 flashcards in this deck.
Unlock Deck
k this deck
21
For a concert event,there are $30 reserved seat tickets and $20 general admission tickets.There are 2000 reserved seats available,and fire regulations limit the number of paid ticket holders to 3000.The promoter must take in at least $65,000 in ticket sales.Find and graph a system of inequalities describing the different numbers of tickets that can be sold.
A)
B)
C)
D)
E)
A)
B)
C)
D)
E)
Unlock Deck
Unlock for access to all 50 flashcards in this deck.
Unlock Deck
k this deck
22
Find the consumer surplus and producer surplus.
Demand
Supply
A)Consumer surplus: $25,000,150 Producer surplus: $12,500,400
B)Consumer surplus: $25,000,200 Producer surplus: $12,500,300
C)Consumer surplus: $25,000,100 Producer surplus: $12,500,100
D)Consumer surplus: $25,000,050 Producer surplus: $12,500,200
E)Consumer surplus: $25,000,000 Producer surplus: $12,500,000
Unlock Deck
Unlock for access to all 50 flashcards in this deck.
Unlock Deck
k this deck
23
A dietitian is asked to design a special dietary supplement using two different foods.Each ounce of food X contains 20 units of calcium,15 units of iron,and 10 units of vitamin B.Each ounce of food Y contains 10 units of calcium,10 units of iron,and 20 units of vitamin B.The minimum daily requirements of the diet are 350 units of calcium,300 units of iron,and 400 units of vitamin B.Sketch a graph of the region corresponding to the system inequalities describing the different amounts of food X and food Y that can be used.
A)
B)
C)
D)
E)
A)
B)
C)
D)
E)
Unlock Deck
Unlock for access to all 50 flashcards in this deck.
Unlock Deck
k this deck
24
Select the correct graph of the inequality.
A)
B)
C)
D)
E)
A)
B)
C)
D)
E)
Unlock Deck
Unlock for access to all 50 flashcards in this deck.
Unlock Deck
k this deck
25
A person plans to invest up to $26,000 in two different interest-bearing accounts.Each account is to contain at least $5000.Moreover,the amount in one account should be at least twice the amount in the other account.Find and graph a system of inequalities to describe the various amounts that can be deposited in each account.
A)
B)
C)
D)
E)
A)
B)
C)
D)
E)
Unlock Deck
Unlock for access to all 50 flashcards in this deck.
Unlock Deck
k this deck
26
Select an inequality for the shaded region shown in the figure.
A)
B)
C)
D)
E)
A)
B)
C)
D)
E)
Unlock Deck
Unlock for access to all 50 flashcards in this deck.
Unlock Deck
k this deck
27
A store sells two models of laptop computers.Because of the demand,the store stocks at least twice as many units of model A as of model B.The costs to the store for the two models are $800 and $1200,respectively.The management does not want more than $29,000 in computer inventory at any one time,and it wants at least four model A laptop computers and two model B laptop computers in inventory at all times.Find and graph a system of inequalities describing all possible inventory levels.
A)
B)
C)
D)
E)
A)
B)
C)
D)
E)
Unlock Deck
Unlock for access to all 50 flashcards in this deck.
Unlock Deck
k this deck
28
Find the consumer surplus and producer surplus.
Demand
Supply
A)Consumer surplus: $3136 Producer surplus: $784
B)Consumer surplus: $3286 Producer surplus: $784
C)Consumer surplus: $3236 Producer surplus: $784
D)Consumer surplus: $3186 Producer surplus: $784
E)Consumer surplus: $3336 Producer surplus: $784
Demand
Supply
A)Consumer surplus: $3136 Producer surplus: $784
B)Consumer surplus: $3286 Producer surplus: $784
C)Consumer surplus: $3236 Producer surplus: $784
D)Consumer surplus: $3186 Producer surplus: $784
E)Consumer surplus: $3336 Producer surplus: $784
Unlock Deck
Unlock for access to all 50 flashcards in this deck.
Unlock Deck
k this deck
29
A small company that manufactures two models of exercise machines has an order for 17 units of the standard model and 18 units of the deluxe model.The company has trucks of two different sizes that can haul the products,as shown in the table.
Find and graph a system of inequalities describing the numbers of trucks of each size that are needed to deliver the order.
A)
B)
C)
D)
E)
Find and graph a system of inequalities describing the numbers of trucks of each size that are needed to deliver the order.
A)
B)
C)
D)
E)
Unlock Deck
Unlock for access to all 50 flashcards in this deck.
Unlock Deck
k this deck
30
Write a set of inequalities to describe the region.
Rectangle: vertices at
A)
B)
C)
D)
E)
Rectangle: vertices at
A)
B)
C)
D)
E)
Unlock Deck
Unlock for access to all 50 flashcards in this deck.
Unlock Deck
k this deck
31
Use a graphing utility to graph the inequality.
A)
B)
C)
D)
E)
A)
B)
C)
D)
E)
Unlock Deck
Unlock for access to all 50 flashcards in this deck.
Unlock Deck
k this deck
32
A warehouse supervisor is told to ship at least 50 packages of gravel that weigh 55 pounds each and at least 40 bags of stone that weigh 70 pounds each.The maximum weight capacity of the truck to be used is 9,500 pounds.Find and graph a system of inequalities describing the numbers of bags of stone and gravel that can be shipped.
A)
B)
C)
D)
E)
A)
B)
C)
D)
E)
Unlock Deck
Unlock for access to all 50 flashcards in this deck.
Unlock Deck
k this deck
33
Select a set of inequalities to describe the region.
A)
B)
C)
D)
E)
A)
B)
C)
D)
E)
Unlock Deck
Unlock for access to all 50 flashcards in this deck.
Unlock Deck
k this deck
34
Select an inequality for the shaded region shown in the figure.
A)
B)
C)
D)
E)
A)
B)
C)
D)
E)
Unlock Deck
Unlock for access to all 50 flashcards in this deck.
Unlock Deck
k this deck
35
Select an inequality to describe the region.
A)
B)
C)
D)
E)
A)
B)
C)
D)
E)
Unlock Deck
Unlock for access to all 50 flashcards in this deck.
Unlock Deck
k this deck
36
Find the consumer surplus and producer surplus.
Demand
Supply
A)Consumer surplus: $3,750 Producer surplus: $12,800
B)Consumer surplus: $3,750 Producer surplus: $12,500
C)Consumer surplus: $3,750 Producer surplus: $12,600
D)Consumer surplus: $3,750 Producer surplus: $12,900
E)Consumer surplus: $3,750 Producer surplus: $12,700
Demand
Supply
A)Consumer surplus: $3,750 Producer surplus: $12,800
B)Consumer surplus: $3,750 Producer surplus: $12,500
C)Consumer surplus: $3,750 Producer surplus: $12,600
D)Consumer surplus: $3,750 Producer surplus: $12,900
E)Consumer surplus: $3,750 Producer surplus: $12,700
Unlock Deck
Unlock for access to all 50 flashcards in this deck.
Unlock Deck
k this deck
37
Select a set of inequalities to describe the region.
A)
B)
C)
D)
E)
A)
B)
C)
D)
E)
Unlock Deck
Unlock for access to all 50 flashcards in this deck.
Unlock Deck
k this deck
38
A dietitian is asked to design a special dietary supplement using two different foods.Each ounce of food X contains 20 units of calcium,15 units of iron,and 10 units of vitamin B.Each ounce of food Y contains 10 units of calcium,10 units of iron,and 20 units of vitamin B.The minimum daily requirements of the diet are 350 units of calcium,300 units of iron,and 400 units of vitamin B.Write a system of inequalities describing the different amounts of food X and food Y that can be used.
A)
B)
C)
D)
E)
A)
B)
C)
D)
E)
Unlock Deck
Unlock for access to all 50 flashcards in this deck.
Unlock Deck
k this deck
39
Select an inequality for the shaded region shown in the figure.
A)
B)
C)
D)
E)
A)
B)
C)
D)
E)
Unlock Deck
Unlock for access to all 50 flashcards in this deck.
Unlock Deck
k this deck
40
Find the consumer surplus and producer surplus.
Demand
Supply
A)Consumer surplus: $300,100 Producer surplus: $ 200,100
B)Consumer surplus: $300,050 Producer surplus: $200,200
C)Consumer surplus: $300,200 Producer surplus: $200,300
D)Consumer surplus: $300,150 Producer surplus: $200,400
E)Consumer surplus: $300,000 Producer surplus: $200,000
Demand
Supply
A)Consumer surplus: $300,100 Producer surplus: $ 200,100
B)Consumer surplus: $300,050 Producer surplus: $200,200
C)Consumer surplus: $300,200 Producer surplus: $200,300
D)Consumer surplus: $300,150 Producer surplus: $200,400
E)Consumer surplus: $300,000 Producer surplus: $200,000
Unlock Deck
Unlock for access to all 50 flashcards in this deck.
Unlock Deck
k this deck
41
Use a graphing utility to graph the inequalities.Shade the region representing the solution set of the system.
A) 10 -10
B)10 -10
C)10 -10
D) 10 -10
E)10 -10
A) 10
-10B)10
-10C)10
-10D) 10
-10E)10
-10 Unlock Deck
Unlock for access to all 50 flashcards in this deck.
Unlock Deck
k this deck
42
Sketch the graph and label the vertices of the solution set of the system of inequalities.Shade the solution set.
A)
B)
C)
D)
E)
A)
B)
C)
D)
E)
Unlock Deck
Unlock for access to all 50 flashcards in this deck.
Unlock Deck
k this deck
43
Determine which one of the ordered pairs below is a solution of the system of linear inequalities.
A)(2,8)
B)(6,1)
C)(0,0)
D)(-1,4)
E)(3,-3)
A)(2,8)
B)(6,1)
C)(0,0)
D)(-1,4)
E)(3,-3)
Unlock Deck
Unlock for access to all 50 flashcards in this deck.
Unlock Deck
k this deck
44
For the given supply and demand equations,find the consumer surplus. Demand
Supply
A)$1,875,000
B)$2,812,500
C)$2,062,500
D)$2,250,000
E)$625,000
Supply
A)$1,875,000
B)$2,812,500
C)$2,062,500
D)$2,250,000
E)$625,000
Unlock Deck
Unlock for access to all 50 flashcards in this deck.
Unlock Deck
k this deck
45
Write an inequality for the shaded region shown in the figure.
A)
B)y ≥
C)y ≤
D)y ≥
E)y ≥
A)
B)y ≥
C)y ≤
D)y ≥
E)y ≥
Unlock Deck
Unlock for access to all 50 flashcards in this deck.
Unlock Deck
k this deck
46
Use a graphing utility to graph the inequality.Shade the region representing the solution. ≤
A)10 -10
B) 10 -10
C)10 -10
D)10 -10
E) 10 -10
A)10
-10B) 10
-10C)10
-10D)10
-10E) 10
-10 Unlock Deck
Unlock for access to all 50 flashcards in this deck.
Unlock Deck
k this deck
47
Determine which one of the ordered pairs below is a solution of the system of linear inequalities.
A)(-2,2)
B)(3,-3)
C)(-5,-9)
D)(4,-7)
E)(9,8)
A)(-2,2)
B)(3,-3)
C)(-5,-9)
D)(4,-7)
E)(9,8)
Unlock Deck
Unlock for access to all 50 flashcards in this deck.
Unlock Deck
k this deck
48
Derive a set of inequalities to describe the region.
A)
B)
C)
D)
E)
A)
B)
C)
D)
E)
Unlock Deck
Unlock for access to all 50 flashcards in this deck.
Unlock Deck
k this deck
49
Derive a set of inequalities to describe the region.
Triangle: vertices at (0,0), (4,0), (4,5)
A)
B)
C)
D)
E)
Triangle: vertices at (0,0), (4,0), (4,5)
A)
B)
C)
D)
E)
Unlock Deck
Unlock for access to all 50 flashcards in this deck.
Unlock Deck
k this deck
50
Sketch the graph of the inequality. < 4
A)
B)
C)
D)
E)
A)
B)
C)
D)
E)
Unlock Deck
Unlock for access to all 50 flashcards in this deck.
Unlock Deck
k this deck
Unlock Deck
Unlock for access to all 50 flashcards in this deck.


