Deck 1: Rectangular Coordinates
Full screen (f)
Question
Sketch a scatter plot of the data shown in the table. The table shows the number y of Wal-Mart stores for each year x from 2000 through 2007.
A)?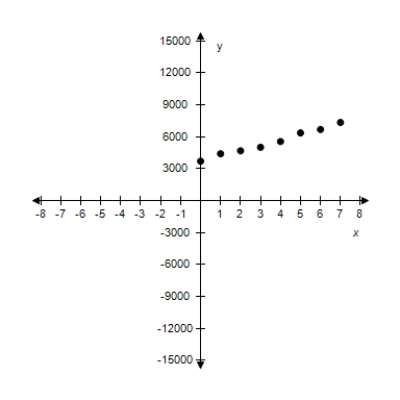 x: Year (0 ? 2000)
Y: Number of stores
B)?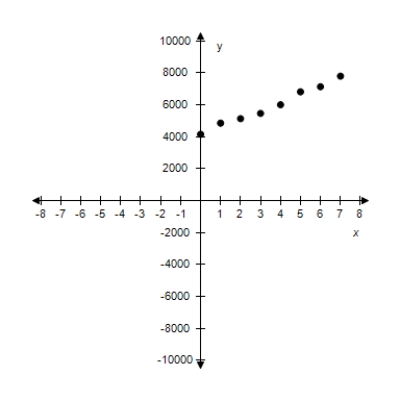 x: Year (0 ? 2000)
Y: Number of stores
C)?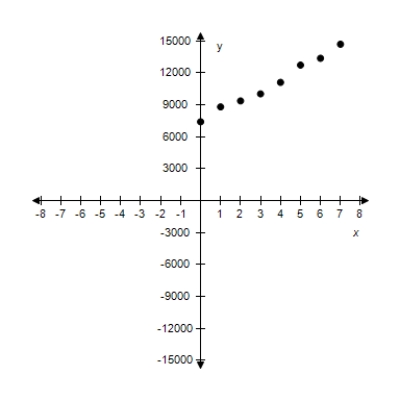 ?
?
X: Year (0 ? 2000)
Y: Number of stores
D)?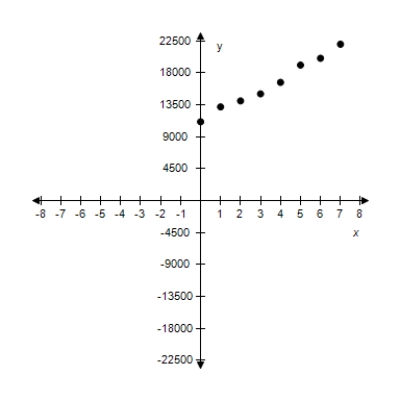 x: Year (0 ? 2000)
Y: Number of stores
E)?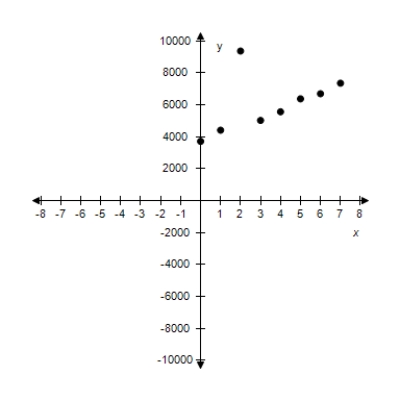 x: Year (0 ? 2000)
Y: Number of stores
A)?
x: Year (0 ? 2000)Y: Number of stores
B)?
x: Year (0 ? 2000)Y: Number of stores
C)?
?X: Year (0 ? 2000)
Y: Number of stores
D)?
x: Year (0 ? 2000)Y: Number of stores
E)?
x: Year (0 ? 2000)Y: Number of stores
Question
Question
Question
Question
Question
Question
Question
Plot the points below whose coordinates are given on a Cartesian coordinate system.
(5,2), (9,-6), (2,-4), (9,-5)
A)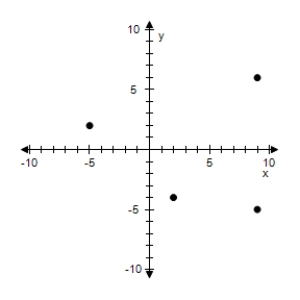
B)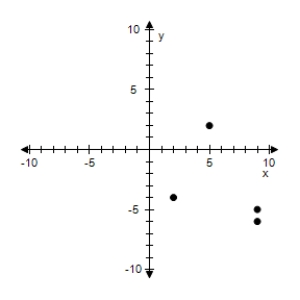
C)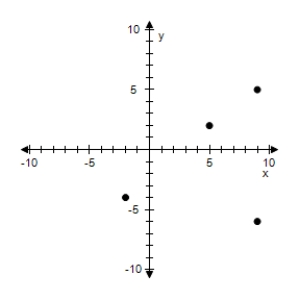
D)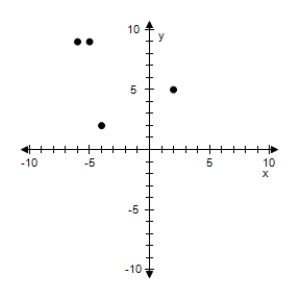
E)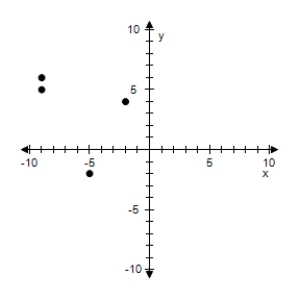
(5,2), (9,-6), (2,-4), (9,-5)
A)
B)
C)
D)
E)
Question
Plot the points in the Cartesian plane.
(2,6), (2.5,6), (3,-6), (-6,4.5)
A)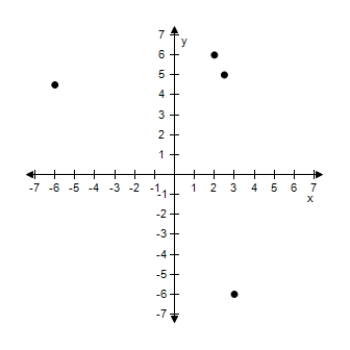
B)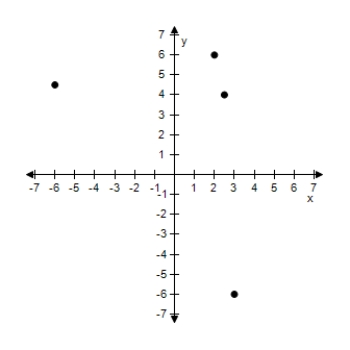
C)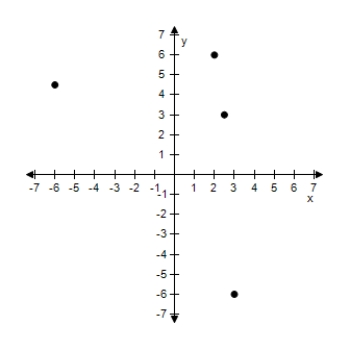
D)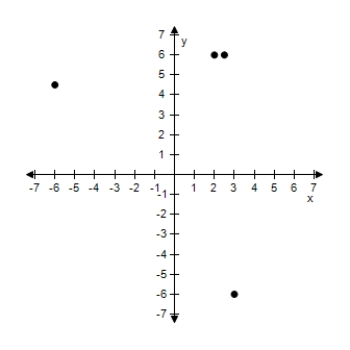
E)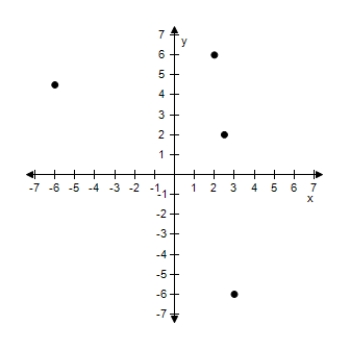
(2,6), (2.5,6), (3,-6), (-6,4.5)
A)
B)
C)
D)
E)
Question
Question
Question
Find the coordinates of the point labeled II. 
A)(-4,-3)
B)(-4,3)
C)(3,4)
D)(4,3)
E)(-3,-4)
A)(-4,-3)
B)(-4,3)
C)(3,4)
D)(4,3)
E)(-3,-4)
Question
Approximate the coordinates of the points.? 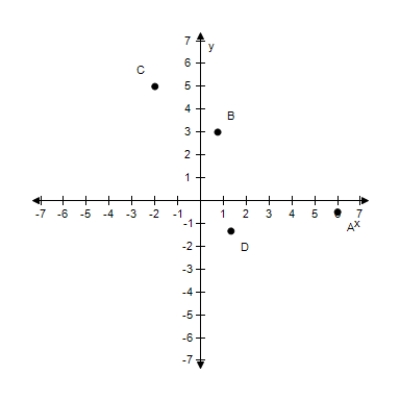 ?
?
A)
B)
C)
D)
E)
?A)
B)
C)
D)
E)
Question
Plot the points in the Cartesian plane. ?? ?
A)?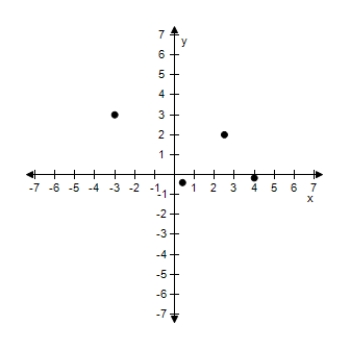
B)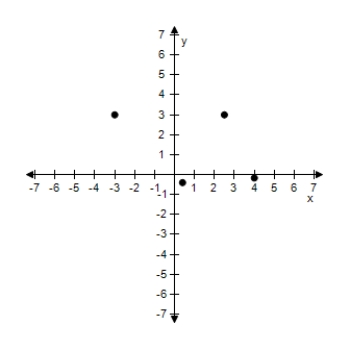 ?
?
C)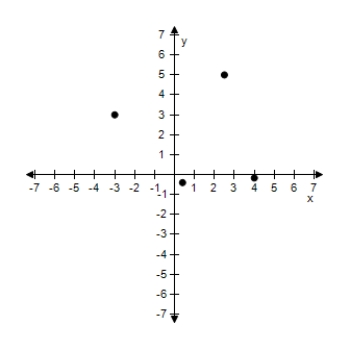
D)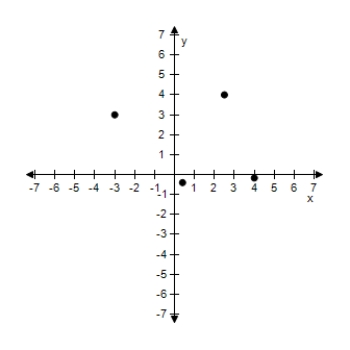 ?
?
E)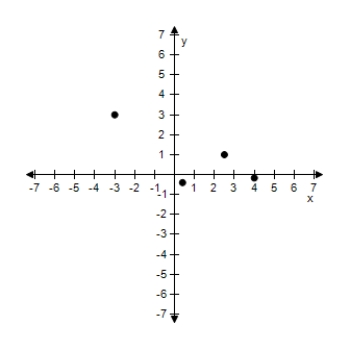
A)?
B)
?C)
D)
?E)
Question
Question
Approximate the coordinates of the points. 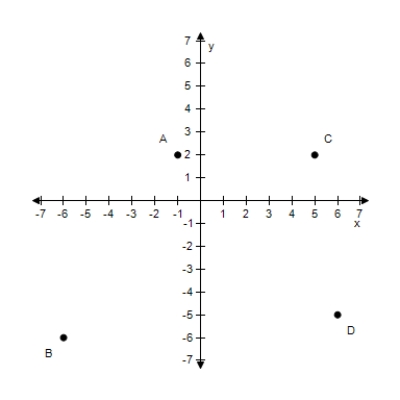
A)A: (4,2),B: (-6,-6),C: (5,2),D: (6,-5)
B)A: (1,2),B: (-6,-6),C: (5,2),D: (6,-5)
C)A: (2,2),B: (-6,-6),C: (5,2),D: (6,-5)
D)A: (3,2),B: (-6,-6),C: (5,2),D: (6,-5)
E)A: (-1,2),B: (-6,-6),C: (5,2),D: (6,-5)
A)A: (4,2),B: (-6,-6),C: (5,2),D: (6,-5)
B)A: (1,2),B: (-6,-6),C: (5,2),D: (6,-5)
C)A: (2,2),B: (-6,-6),C: (5,2),D: (6,-5)
D)A: (3,2),B: (-6,-6),C: (5,2),D: (6,-5)
E)A: (-1,2),B: (-6,-6),C: (5,2),D: (6,-5)
Question
Which label corresponds to the coordinates (-3,-5)? 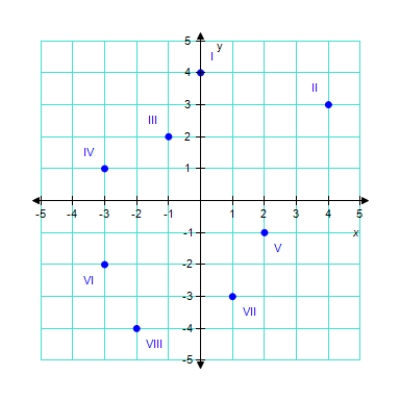
A)VI
B)VIII
C)V
D)VII
E)none
A)VI
B)VIII
C)V
D)VII
E)none
Question
Question
Plot the points in the Cartesian plane.
(-4,1), (-5,-2), (5,4), (2,-4)
A)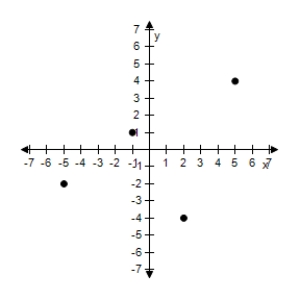
B)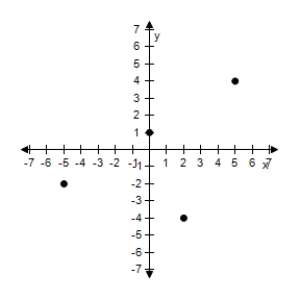
C)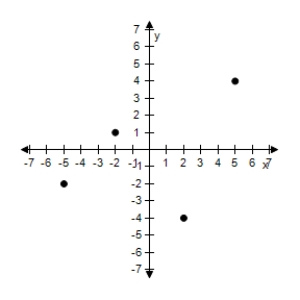
D)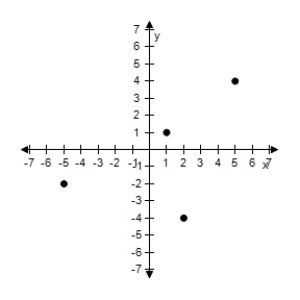
E)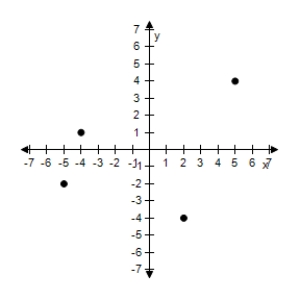
(-4,1), (-5,-2), (5,4), (2,-4)
A)
B)
C)
D)
E)
Question
Question
Question
Question
Question
Question
Plot the following points and find the midpoint of the line segment joining the points.
(9,6), (5,6)
A)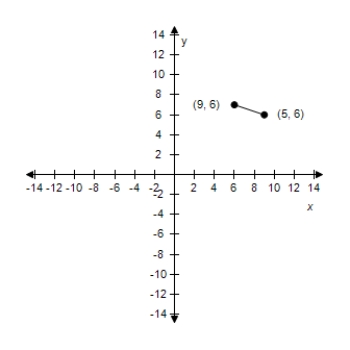 Midpoint: (7,6)
B)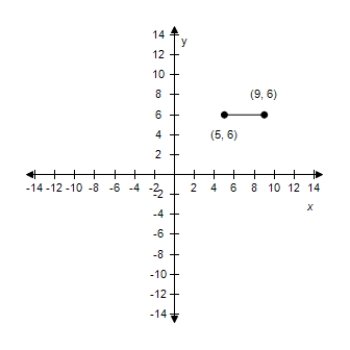 Midpoint: (7,6)
C)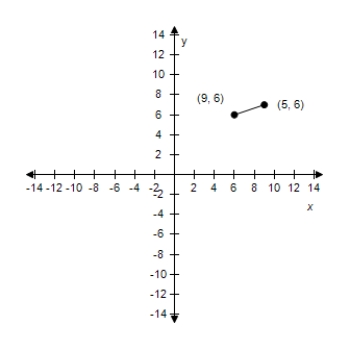
Midpoint: (7,6)
D)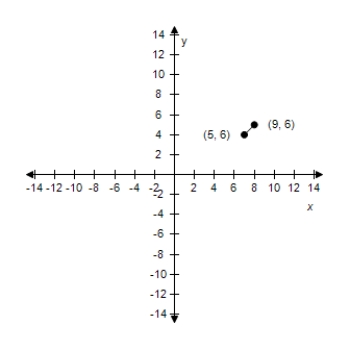 Midpoint: (7,6)
E)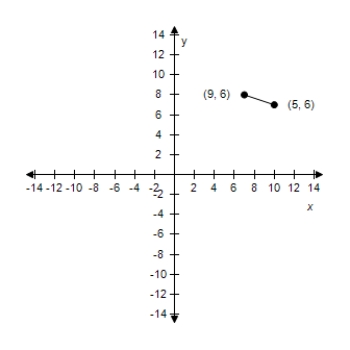 Midpoint: (7,6)
(9,6), (5,6)
A)
Midpoint: (7,6)B)
Midpoint: (7,6)C)
Midpoint: (7,6)
D)
Midpoint: (7,6)E)
Midpoint: (7,6) Question
Question
Question
Plot the following points and find the distance between the points. ?
(-5,8), (7,2)
?
A)?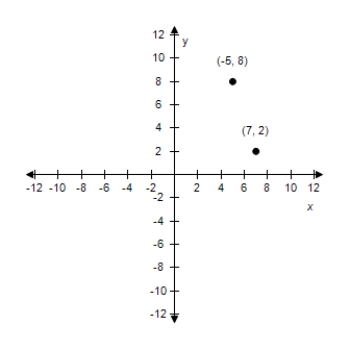 Distance:
B)?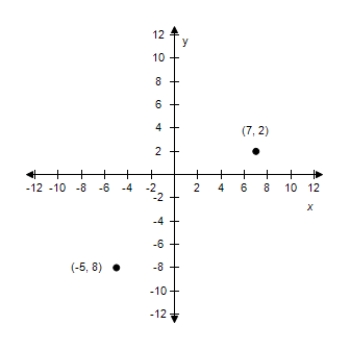 Distance:
C)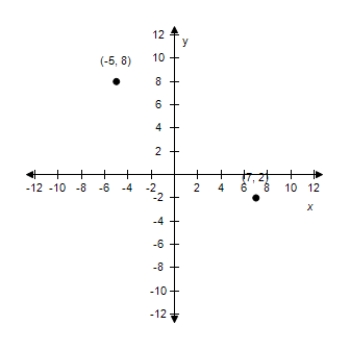 Distance:
D)?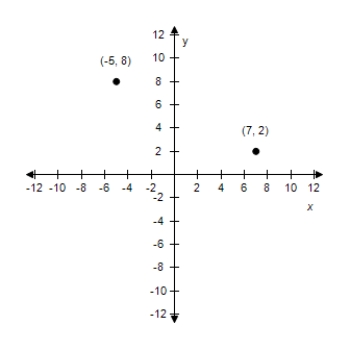 Distance:
E)?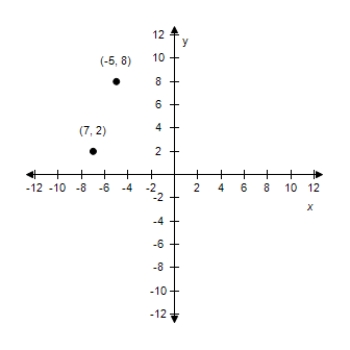 Distance:
(-5,8), (7,2)
?
A)?
Distance: B)?
Distance: C)
Distance: D)?
Distance: E)?
Distance: Question
Question
Plot the following points and find the distance between the points.
(11,3), (5,3)
A)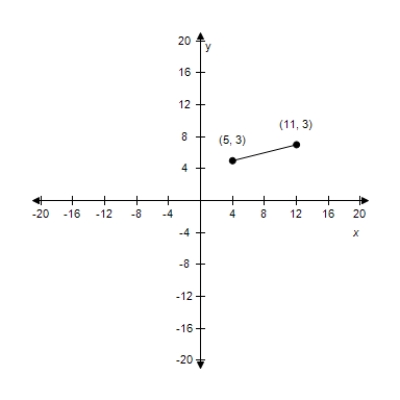 Distance: 8
B)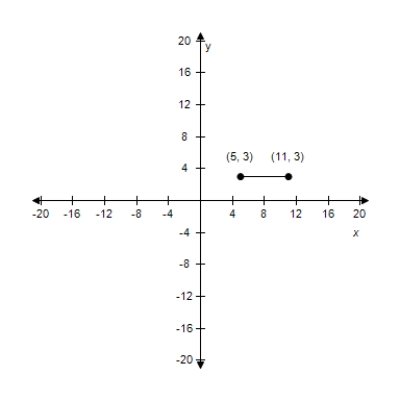 Distance: 6
C)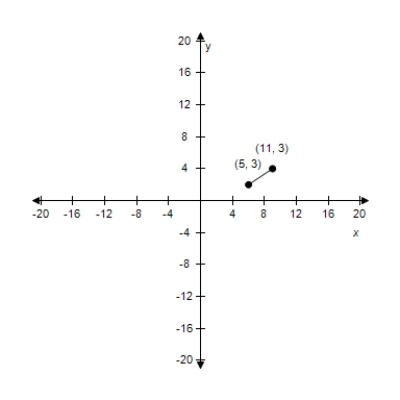 Distance: 9
D)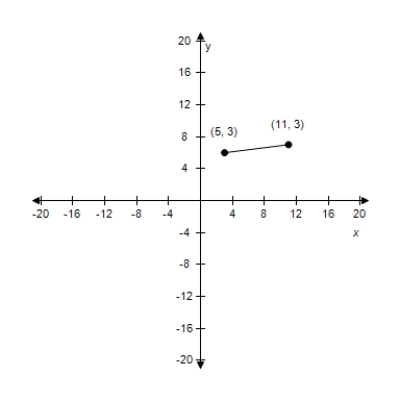 Distance: 10
E)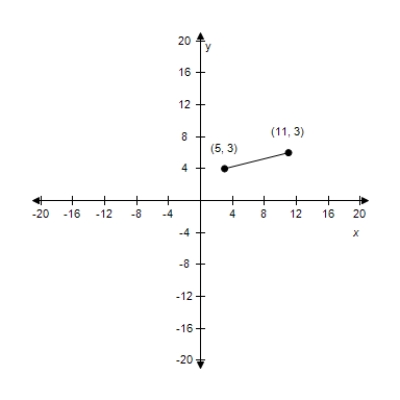 Distance: 7
(11,3), (5,3)
A)
Distance: 8B)
Distance: 6C)
Distance: 9D)
Distance: 10E)
Distance: 7 Question
Question
Question
Plot the following points and find the distance between the points. ?
(3,8), (8,3)
?
A)?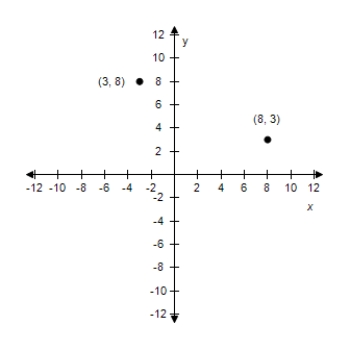 Distance:
B)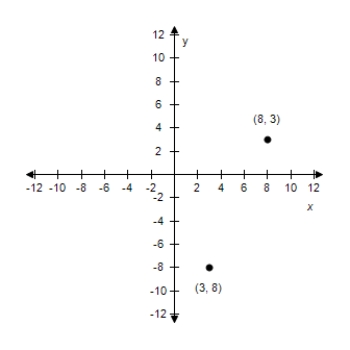 Distance:
C)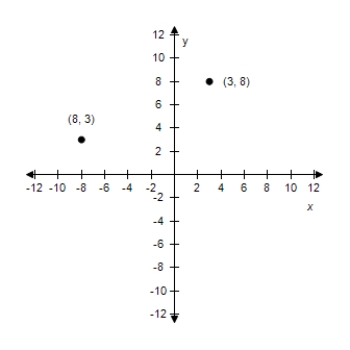 ?
?
Distance:
D)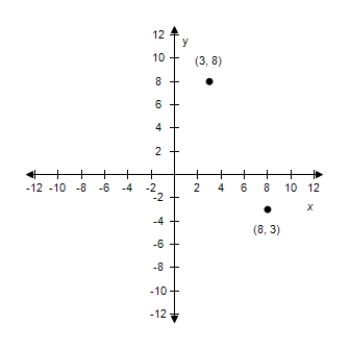 ?
?
Distance:
E)?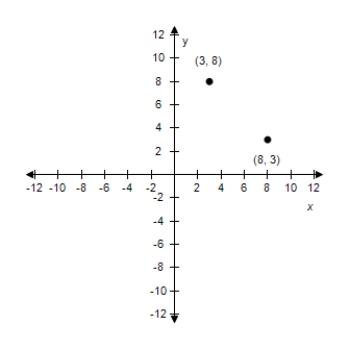 Distance:
(3,8), (8,3)
?
A)?
Distance: B)
Distance: C)
?Distance:
D)
?Distance:
E)?
Distance: Question
Question
Question
Sketch a scatter plot of the data shown in the table. The table shows the lowest temperature on record y (in degrees Fahrenheit)in Duluth,Minnesota for each month x where x = 1 represents from January.
A)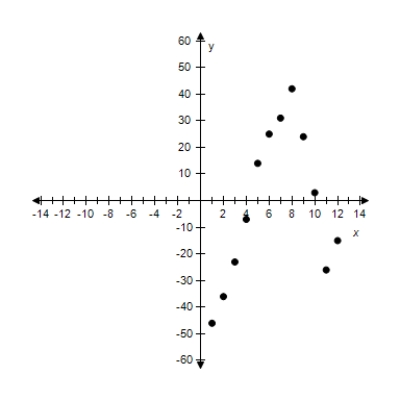 x: Months (1 ? January)
Y: Temperature (in Fº)
B)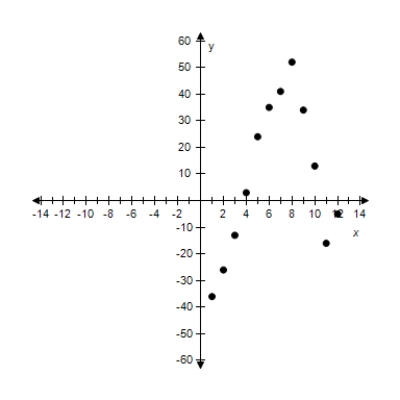 x: Months (1 ? January)
Y: Temperature (in Fº)
C)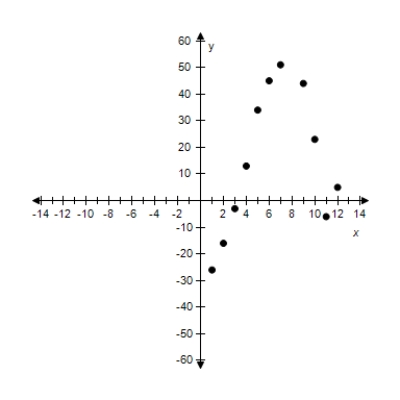 ?
?
X: Months (1 ? January)
Y: Temperature (in Fº)
D)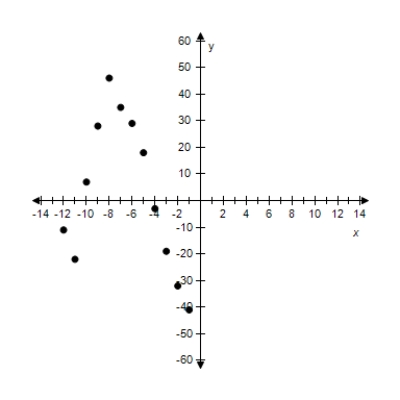 ?
?
X: Months (1 ? January)
Y: Temperature (in Fº)
E)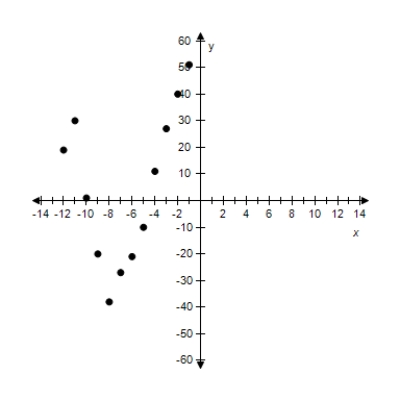 x: Months (1 ? January)
Y: Temperature (in Fº)
A)
x: Months (1 ? January)Y: Temperature (in Fº)
B)
x: Months (1 ? January)Y: Temperature (in Fº)
C)
?X: Months (1 ? January)
Y: Temperature (in Fº)
D)
?X: Months (1 ? January)
Y: Temperature (in Fº)
E)
x: Months (1 ? January)Y: Temperature (in Fº)
Question
Question
Question
Question
Question
Question
Question
Use the graph,which shows the average retail prices of 1 gallon of whole milk from 1996 through 2007. 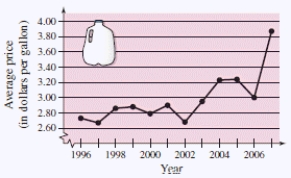 Approximate the percent change in the price of milk from the price in 2000 to the highest price shown in the graph.
A)About 48%
B)About 58%
C)About 43%
D)About 53%
E)About 38%
Approximate the percent change in the price of milk from the price in 2000 to the highest price shown in the graph.
A)About 48%
B)About 58%
C)About 43%
D)About 53%
E)About 38%
Question
Question
Question
A soccer player passes the ball from a point that is 13 yards from the end line and 16 yards from the sideline.The pass is received by a teammate who is 48 yards from the same end line and 39 yards from the same sideline,as shown in the figure.How long is the pass?? 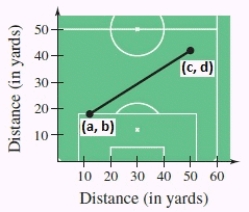 (a,b): (13,16) (c,d): (48,39)
?
A) ? 44 yd
B) ? 43 yd
C) ? 45 yd
D) ? 42 yd
E) ? 46 yd
(a,b): (13,16) (c,d): (48,39)?
A) ? 44 yd
B) ? 43 yd
C) ? 45 yd
D) ? 42 yd
E) ? 46 yd
Question
Question
The graph shows the numbers of performers who were elected to the Rock and Roll Hall of Fame from 1991 through 2008.Describe any trends in the data.From these trends,predict the number of performers elected in 2009. 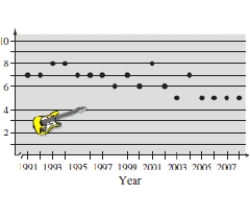
A)The number of performers elected in last four years in the graph seems to be nearly steady except for the first few years therefore five performers will be elected in 2009.
B)The number of performers elected in last four years in the graph seems to be nearly steady except for the first few years therefore seven performers will be elected in 2009.
C)The number of performers elected in last four years in the graph seems to be nearly steady except for the first few years therefore eight performers will be elected in 2009.
D)The number of performers elected in last four years in the graph seems to be nearly steady except for the first few years therefore six performers will be elected in 2009.
E)The number of performers elected in last four years in the graph seems to be nearly steady except for the first few years therefore nine performers will be elected in 2009.
Question
Question
Question
Use the graph,which shows the average retail prices of 1 gallon of whole milk from 1996 through 2007.  Approximate the lowest price of a gallon of whole milk shown in the graph.When did this occur?
A)$2.97 / gal;2001
B)$3.17 / gal;2002
C)$3.07 / gal;2003
D)$2.67 / gal;1997
E)$3.87 / gal;2004
Approximate the lowest price of a gallon of whole milk shown in the graph.When did this occur?
A)$2.97 / gal;2001
B)$3.17 / gal;2002
C)$3.07 / gal;2003
D)$2.67 / gal;1997
E)$3.87 / gal;2004
Question
Question
Question
Question
Plot the point (-3,1)on the Cartesian plane.
A)
B)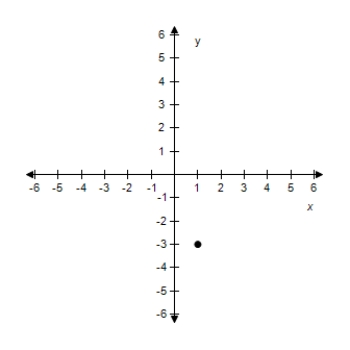
C)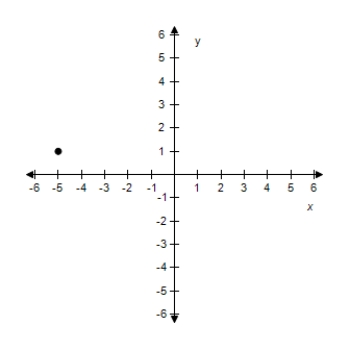
D)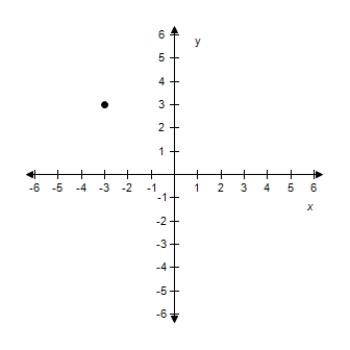
E)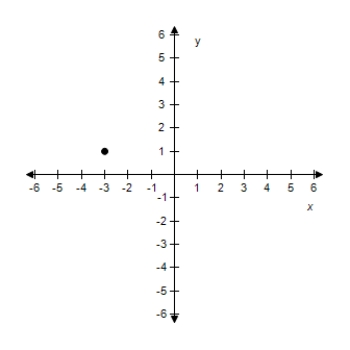
A)
B)
C)
D)
E)
Question
Question
Question
Find the coordinates of the point C shown below. 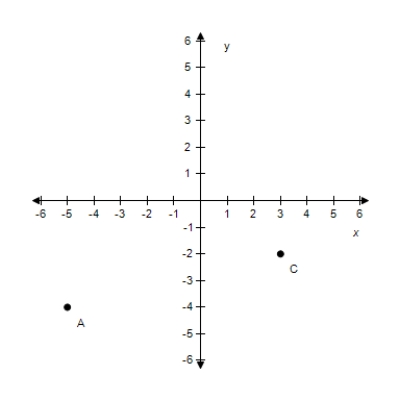
A)(-2,3)
B)(3,-2)
C)(-4,-5)
D)(-5,-4)
E)(-5,-2)
A)(-2,3)
B)(3,-2)
C)(-4,-5)
D)(-5,-4)
E)(-5,-2)
Question
Question
Question
Question
Question
Question
Question
Question
Question
Question
Question

Unlock Deck
Sign up to unlock the cards in this deck!
Unlock Deck
Unlock Deck
1/69
Play
Full screen (f)
Deck 1: Rectangular Coordinates
1
Sketch a scatter plot of the data shown in the table. The table shows the number y of Wal-Mart stores for each year x from 2000 through 2007.
A)? x: Year (0 ? 2000)
Y: Number of stores
B)? x: Year (0 ? 2000)
Y: Number of stores
C)? ?
X: Year (0 ? 2000)
Y: Number of stores
D)? x: Year (0 ? 2000)
Y: Number of stores
E)? x: Year (0 ? 2000)
Y: Number of stores
A)?
x: Year (0 ? 2000)Y: Number of stores
B)?
x: Year (0 ? 2000)Y: Number of stores
C)?
?X: Year (0 ? 2000)
Y: Number of stores
D)?
x: Year (0 ? 2000)Y: Number of stores
E)?
x: Year (0 ? 2000)Y: Number of stores
? x: Year (0 ? 2000)
Y: Number of stores
x: Year (0 ? 2000)Y: Number of stores
2
A point is located five units below the x-axis and the coordinates of the point are equal.Find the coordinates of the point.
A)(-5,5)
B)(-5,0)
C)(5,-5)
D)(-5,-5)
E)(5,5)
A)(-5,5)
B)(-5,0)
C)(5,-5)
D)(-5,-5)
E)(5,5)
(-5,-5)
3
Determine the quadrant(s)in which (x,y)is located so that the condition(s)is (are)satisfied.
Y < -6
A)Quadrant II or IV
B)Quadrant III or IV
C)Quadrant IV
D)Quadrant I
E)Quadrant II
Y < -6
A)Quadrant II or IV
B)Quadrant III or IV
C)Quadrant IV
D)Quadrant I
E)Quadrant II
Quadrant III or IV
4
Determine the quadrant(s)in which (x,y)is located so that the condition(s)is (are)satisfied.
X > 3 and y = 1
A)Quadrant III
B)Quadrant I
C)Quadrant III and IV
D)Quadrant II
E)Quadrant IV
X > 3 and y = 1
A)Quadrant III
B)Quadrant I
C)Quadrant III and IV
D)Quadrant II
E)Quadrant IV
Unlock Deck
Unlock for access to all 69 flashcards in this deck.
Unlock Deck
k this deck
5
A point is located six units to the left of the y-axis and seven units above the x-axis.Find the coordinates of the point.
A)(-6,7)
B)(7,6)
C)(-6,-7)
D)(6,-7)
E)(6,7)
A)(-6,7)
B)(7,6)
C)(-6,-7)
D)(6,-7)
E)(6,7)
Unlock Deck
Unlock for access to all 69 flashcards in this deck.
Unlock Deck
k this deck
6
Determine the quadrant(s)in which (x,y)is located so that the condition(s)is (are)satisfied.
X < -9 and - y > 6
A)Quadrant I
B)Quadrant II
C)Quadrant IV
D)Quadrant III
E)Quadrant I or IV
X < -9 and - y > 6
A)Quadrant I
B)Quadrant II
C)Quadrant IV
D)Quadrant III
E)Quadrant I or IV
Unlock Deck
Unlock for access to all 69 flashcards in this deck.
Unlock Deck
k this deck
7
Determine the quadrant(s)in which (x,y)is located so that the condition(s)is (are)satisfied.
X = -2 and y > 0
A)Quadrant IV
B)Quadrant II or IV
C)Quadrant II
D)Quadrant I
E)Quadrant III
X = -2 and y > 0
A)Quadrant IV
B)Quadrant II or IV
C)Quadrant II
D)Quadrant I
E)Quadrant III
Unlock Deck
Unlock for access to all 69 flashcards in this deck.
Unlock Deck
k this deck
8
Plot the points below whose coordinates are given on a Cartesian coordinate system.
(5,2), (9,-6), (2,-4), (9,-5)
A)
B)
C)
D)
E)
(5,2), (9,-6), (2,-4), (9,-5)
A)
B)
C)
D)
E)
Unlock Deck
Unlock for access to all 69 flashcards in this deck.
Unlock Deck
k this deck
9
Plot the points in the Cartesian plane.
(2,6), (2.5,6), (3,-6), (-6,4.5)
A)
B)
C)
D)
E)
(2,6), (2.5,6), (3,-6), (-6,4.5)
A)
B)
C)
D)
E)
Unlock Deck
Unlock for access to all 69 flashcards in this deck.
Unlock Deck
k this deck
10
Determine the quadrant(s)in which (x,y)is located so that the condition(s)is (are)satisfied.
Xy < -4
A)Quadrant II or III
B)Quadrant I or III
C)Quadrant III or IV
D)Quadrant II or IV
E)Quadrant I or IV
Xy < -4
A)Quadrant II or III
B)Quadrant I or III
C)Quadrant III or IV
D)Quadrant II or IV
E)Quadrant I or IV
Unlock Deck
Unlock for access to all 69 flashcards in this deck.
Unlock Deck
k this deck
11
Determine the quadrant(s)in which (x,y)is located so that the condition(s)is (are)satisfied.
X > 7 and y < 0
A)Quadrant I and IV
B)Quadrant III
C)Quadrant I
D)Quadrant IV
E)Quadrant II
X > 7 and y < 0
A)Quadrant I and IV
B)Quadrant III
C)Quadrant I
D)Quadrant IV
E)Quadrant II
Unlock Deck
Unlock for access to all 69 flashcards in this deck.
Unlock Deck
k this deck
12
Find the coordinates of the point labeled II.
A)(-4,-3)
B)(-4,3)
C)(3,4)
D)(4,3)
E)(-3,-4)
A)(-4,-3)
B)(-4,3)
C)(3,4)
D)(4,3)
E)(-3,-4)
Unlock Deck
Unlock for access to all 69 flashcards in this deck.
Unlock Deck
k this deck
13
Approximate the coordinates of the points.? ?
A)
B)
C)
D)
E)
?A)
B)
C)
D)
E)
Unlock Deck
Unlock for access to all 69 flashcards in this deck.
Unlock Deck
k this deck
14
Plot the points in the Cartesian plane. ?? ?
A)?
B) ?
C)
D) ?
E)
A)?
B)
?C)
D)
?E)
Unlock Deck
Unlock for access to all 69 flashcards in this deck.
Unlock Deck
k this deck
15
Determine the quadrant(s)in which (x,y)is located so that the condition(s)is (are)satisfied.
X < -8 and y < -6
A)Quadrant I
B)Quadrant I and II
C)Quadrant III
D)Quadrant II
E)Quadrant IV
X < -8 and y < -6
A)Quadrant I
B)Quadrant I and II
C)Quadrant III
D)Quadrant II
E)Quadrant IV
Unlock Deck
Unlock for access to all 69 flashcards in this deck.
Unlock Deck
k this deck
16
Approximate the coordinates of the points.
A)A: (4,2),B: (-6,-6),C: (5,2),D: (6,-5)
B)A: (1,2),B: (-6,-6),C: (5,2),D: (6,-5)
C)A: (2,2),B: (-6,-6),C: (5,2),D: (6,-5)
D)A: (3,2),B: (-6,-6),C: (5,2),D: (6,-5)
E)A: (-1,2),B: (-6,-6),C: (5,2),D: (6,-5)
A)A: (4,2),B: (-6,-6),C: (5,2),D: (6,-5)
B)A: (1,2),B: (-6,-6),C: (5,2),D: (6,-5)
C)A: (2,2),B: (-6,-6),C: (5,2),D: (6,-5)
D)A: (3,2),B: (-6,-6),C: (5,2),D: (6,-5)
E)A: (-1,2),B: (-6,-6),C: (5,2),D: (6,-5)
Unlock Deck
Unlock for access to all 69 flashcards in this deck.
Unlock Deck
k this deck
17
Which label corresponds to the coordinates (-3,-5)?
A)VI
B)VIII
C)V
D)VII
E)none
A)VI
B)VIII
C)V
D)VII
E)none
Unlock Deck
Unlock for access to all 69 flashcards in this deck.
Unlock Deck
k this deck
18
Find the coordinates for the point that is four units to the left of the y-axis and is six units up from the x-axis.
A)(-4,-6)
B)(4,-6)
C)(-4,6)
D)(6,6)
E)(4,6)
A)(-4,-6)
B)(4,-6)
C)(-4,6)
D)(6,6)
E)(4,6)
Unlock Deck
Unlock for access to all 69 flashcards in this deck.
Unlock Deck
k this deck
19
Plot the points in the Cartesian plane.
(-4,1), (-5,-2), (5,4), (2,-4)
A)
B)
C)
D)
E)
(-4,1), (-5,-2), (5,4), (2,-4)
A)
B)
C)
D)
E)
Unlock Deck
Unlock for access to all 69 flashcards in this deck.
Unlock Deck
k this deck
20
Determine the quadrant(s)in which (x,y)is located so that the conditions(s)is (are)satisfied.
- x > 6 and y < -2
A)Quadrant III
B)Quadrant I
C)Quadrant II
D)Quadrant I or IV
E)Quadrant IV
- x > 6 and y < -2
A)Quadrant III
B)Quadrant I
C)Quadrant II
D)Quadrant I or IV
E)Quadrant IV
Unlock Deck
Unlock for access to all 69 flashcards in this deck.
Unlock Deck
k this deck
21
Find the distance between the points.(Round the answer to two decimal places)
(9)5,-4.1), (-3.3,8.7)
A)8.7
B)9.5
C)327.68
D)3.3
E)18.10
(9)5,-4.1), (-3.3,8.7)
A)8.7
B)9.5
C)327.68
D)3.3
E)18.10
Unlock Deck
Unlock for access to all 69 flashcards in this deck.
Unlock Deck
k this deck
22
Find the distance between the points.
(-9,4), (3,-5)
A)4
B)15
C)9
D)3
E)225
(-9,4), (3,-5)
A)4
B)15
C)9
D)3
E)225
Unlock Deck
Unlock for access to all 69 flashcards in this deck.
Unlock Deck
k this deck
23
Show that the points form the vertices of the indicated polygon. ?
Right triangle: (6,2), (3,4), (-3,-5)
?
A)
B)
C)
D)
E)
Right triangle: (6,2), (3,4), (-3,-5)
?
A)
B)
C)
D)
E)
Unlock Deck
Unlock for access to all 69 flashcards in this deck.
Unlock Deck
k this deck
24
Find the distance between the two points (-3,-1)and (13,29).
A)65
B)68
C)102
D)31
E)34
A)65
B)68
C)102
D)31
E)34
Unlock Deck
Unlock for access to all 69 flashcards in this deck.
Unlock Deck
k this deck
25
Plot the following points and find the midpoint of the line segment joining the points.
(9,6), (5,6)
A) Midpoint: (7,6)
B) Midpoint: (7,6)
C)
Midpoint: (7,6)
D) Midpoint: (7,6)
E) Midpoint: (7,6)
(9,6), (5,6)
A)
Midpoint: (7,6)B)
Midpoint: (7,6)C)
Midpoint: (7,6)
D)
Midpoint: (7,6)E)
Midpoint: (7,6) Unlock Deck
Unlock for access to all 69 flashcards in this deck.
Unlock Deck
k this deck
26
Find the midpoint between the two points (-19,9)and (11,13).
A)(-15,2)
B)(-15,11)
C)(-8,11)
D)(-4,2)
E)(-4,11)
A)(-15,2)
B)(-15,11)
C)(-8,11)
D)(-4,2)
E)(-4,11)
Unlock Deck
Unlock for access to all 69 flashcards in this deck.
Unlock Deck
k this deck
27
Find the distance between the points.
(-8,-5), (-2,3)
A)10
B)100
C)2
D)5
E)8
(-8,-5), (-2,3)
A)10
B)100
C)2
D)5
E)8
Unlock Deck
Unlock for access to all 69 flashcards in this deck.
Unlock Deck
k this deck
28
Plot the following points and find the distance between the points. ?
(-5,8), (7,2)
?
A)? Distance:
B)? Distance:
C) Distance:
D)? Distance:
E)? Distance:
(-5,8), (7,2)
?
A)?
Distance: B)?
Distance: C)
Distance: D)?
Distance: E)?
Distance: Unlock Deck
Unlock for access to all 69 flashcards in this deck.
Unlock Deck
k this deck
29
Find the distance between the two points (6,1)and (6,7).
A)1
B)13
C)12
D)11
E)6
A)1
B)13
C)12
D)11
E)6
Unlock Deck
Unlock for access to all 69 flashcards in this deck.
Unlock Deck
k this deck
30
Plot the following points and find the distance between the points.
(11,3), (5,3)
A) Distance: 8
B) Distance: 6
C) Distance: 9
D) Distance: 10
E) Distance: 7
(11,3), (5,3)
A)
Distance: 8B)
Distance: 6C)
Distance: 9D)
Distance: 10E)
Distance: 7 Unlock Deck
Unlock for access to all 69 flashcards in this deck.
Unlock Deck
k this deck
31
Given points(-1,1),and (-11,-9)form the vertices of the base of a triangle,find a third point so that the three points form the vertices of an isosceles triangle.
A)(3,1)
B)(4,-15)
C)(-15,-13)
D)(3,5)
E)(-6,-4)
A)(3,1)
B)(4,-15)
C)(-15,-13)
D)(3,5)
E)(-6,-4)
Unlock Deck
Unlock for access to all 69 flashcards in this deck.
Unlock Deck
k this deck
32
Show that the points form the vertices of the indicated polygon. ?
Isosceles triangle: (7,-6), (9,8), (-5,6)
?
A)Distances between the points:
B)Distances between the points:
C)Distances between the points:
D)Distances between the points:
E)Distances between the points:
Isosceles triangle: (7,-6), (9,8), (-5,6)
?
A)Distances between the points:
B)Distances between the points:
C)Distances between the points:
D)Distances between the points:
E)Distances between the points:
Unlock Deck
Unlock for access to all 69 flashcards in this deck.
Unlock Deck
k this deck
33
Plot the following points and find the distance between the points. ?
(3,8), (8,3)
?
A)? Distance:
B) Distance:
C) ?
Distance:
D) ?
Distance:
E)? Distance:
(3,8), (8,3)
?
A)?
Distance: B)
Distance: C)
?Distance:
D)
?Distance:
E)?
Distance: Unlock Deck
Unlock for access to all 69 flashcards in this deck.
Unlock Deck
k this deck
34
Show that the points form the vertices of the indicated polygon. ?
Isosceles triangle: (7,1), (5,4), (2,6)
?
A)Distances between the points:
B)Distances between the points:
C)Distances between the points:
D)Distances between the points:
E)Distances between the points:
Isosceles triangle: (7,1), (5,4), (2,6)
?
A)Distances between the points:
B)Distances between the points:
C)Distances between the points:
D)Distances between the points:
E)Distances between the points:
Unlock Deck
Unlock for access to all 69 flashcards in this deck.
Unlock Deck
k this deck
35
Show that the points form the vertices of the indicated polygon. ?
Right triangle: (3,5), (5,6), (6,4)
?
A)
B)
C)
D)
E)
Right triangle: (3,5), (5,6), (6,4)
?
A)
B)
C)
D)
E)
Unlock Deck
Unlock for access to all 69 flashcards in this deck.
Unlock Deck
k this deck
36
Sketch a scatter plot of the data shown in the table. The table shows the lowest temperature on record y (in degrees Fahrenheit)in Duluth,Minnesota for each month x where x = 1 represents from January.
A) x: Months (1 ? January)
Y: Temperature (in Fº)
B) x: Months (1 ? January)
Y: Temperature (in Fº)
C) ?
X: Months (1 ? January)
Y: Temperature (in Fº)
D) ?
X: Months (1 ? January)
Y: Temperature (in Fº)
E) x: Months (1 ? January)
Y: Temperature (in Fº)
A)
x: Months (1 ? January)Y: Temperature (in Fº)
B)
x: Months (1 ? January)Y: Temperature (in Fº)
C)
?X: Months (1 ? January)
Y: Temperature (in Fº)
D)
?X: Months (1 ? January)
Y: Temperature (in Fº)
E)
x: Months (1 ? January)Y: Temperature (in Fº)
Unlock Deck
Unlock for access to all 69 flashcards in this deck.
Unlock Deck
k this deck
37
An airplane flies from one city in a straight line to another city,which is 360 kilometers north and 150 kilometers west of first city.How far does the plane fly?
A)150 km
B)390 km
C)255 km
D)360 km
E)350 km
A)150 km
B)390 km
C)255 km
D)360 km
E)350 km
Unlock Deck
Unlock for access to all 69 flashcards in this deck.
Unlock Deck
k this deck
38
Given the points (-6,-8)and (4,-6).Find a third point so that the three points form the vertices of a right triangle.
A)(-16,4)
B)(-11,17)
C)(-6,-9)
D)(5,-6)
E)(4,6)
A)(-16,4)
B)(-11,17)
C)(-6,-9)
D)(5,-6)
E)(4,6)
Unlock Deck
Unlock for access to all 69 flashcards in this deck.
Unlock Deck
k this deck
39
Find the distance between the points.(Round the answer to two decimal places)
(-6)5,4.9), (-9.5,7.5)
A)15.76
B)9.5
C)7.5
D)3.97
E)6.5
(-6)5,4.9), (-9.5,7.5)
A)15.76
B)9.5
C)7.5
D)3.97
E)6.5
Unlock Deck
Unlock for access to all 69 flashcards in this deck.
Unlock Deck
k this deck
40
Find the distance between the two points (10,7)and (-5,7).
A)30
B)20
C)12
D)40
E)15
A)30
B)20
C)12
D)40
E)15
Unlock Deck
Unlock for access to all 69 flashcards in this deck.
Unlock Deck
k this deck
41
)Given points(5,-11),and (11,-5)form the vertices of the base of a triangle,find a third point so that the three points form the vertices of an isosceles triangle.
A)(8,-8)
B)(11,-12)
C)(6,-10)
D)(10,-6)
E)(10,-11)
A)(8,-8)
B)(11,-12)
C)(6,-10)
D)(10,-6)
E)(10,-11)
Unlock Deck
Unlock for access to all 69 flashcards in this deck.
Unlock Deck
k this deck
42
Find the midpoint of the line segment joining the points (3,6)and (9,-4).
A)(6,-10)
B)(12,2)
C)(6,1)
D)(-3,5)
E)(3,-5)
A)(6,-10)
B)(12,2)
C)(6,1)
D)(-3,5)
E)(3,-5)
Unlock Deck
Unlock for access to all 69 flashcards in this deck.
Unlock Deck
k this deck
43
Use the graph,which shows the average retail prices of 1 gallon of whole milk from 1996 through 2007. Approximate the percent change in the price of milk from the price in 2000 to the highest price shown in the graph.
A)About 48%
B)About 58%
C)About 43%
D)About 53%
E)About 38%
Approximate the percent change in the price of milk from the price in 2000 to the highest price shown in the graph.
A)About 48%
B)About 58%
C)About 43%
D)About 53%
E)About 38%
Unlock Deck
Unlock for access to all 69 flashcards in this deck.
Unlock Deck
k this deck
44
The Coca-Cola Company had sales of $19,999 million in 1999 and $29,511 million in 2007.Use the Midpoint Formula to estimate the sales in 2003.Assume that the sales followed a linear pattern.
A)$24,905 million
B)$24,855 million
C)$24,755 million
D)$24,955 million
E)$24,805 million
A)$24,905 million
B)$24,855 million
C)$24,755 million
D)$24,955 million
E)$24,805 million
Unlock Deck
Unlock for access to all 69 flashcards in this deck.
Unlock Deck
k this deck
45
Find the coordinates of the point that is located 8 units below the x-axis and 3 units to the left of the y-axis.
A)(-8,-3)
B)(8,-3)
C)(-3,8)
D)(3,-8)
E)(-3,-8)
A)(-8,-3)
B)(8,-3)
C)(-3,8)
D)(3,-8)
E)(-3,-8)
Unlock Deck
Unlock for access to all 69 flashcards in this deck.
Unlock Deck
k this deck
46
A soccer player passes the ball from a point that is 13 yards from the end line and 16 yards from the sideline.The pass is received by a teammate who is 48 yards from the same end line and 39 yards from the same sideline,as shown in the figure.How long is the pass?? (a,b): (13,16) (c,d): (48,39)
?
A) ? 44 yd
B) ? 43 yd
C) ? 45 yd
D) ? 42 yd
E) ? 46 yd
(a,b): (13,16) (c,d): (48,39)?
A) ? 44 yd
B) ? 43 yd
C) ? 45 yd
D) ? 42 yd
E) ? 46 yd
Unlock Deck
Unlock for access to all 69 flashcards in this deck.
Unlock Deck
k this deck
47
Find the coordinates of the vertices of the polygon in its new position.
Original coordinates of vertices: (6,5), (3,2), (4,2), (5,2)
Shift: six units downward,two units to the left
A)(13,-1), (1,-4), (2,-4), (3,-4)
B)(10,-1), (1,-4), (2,-4), (3,-4)
C)(12,-1), (1,-4), (2,-4), (3,-4)
D)(4,-1), (1,-4), (2,-4), (3,-4)
E)(11,-1), (1,-4), (2,-4), (3,-4)
Original coordinates of vertices: (6,5), (3,2), (4,2), (5,2)
Shift: six units downward,two units to the left
A)(13,-1), (1,-4), (2,-4), (3,-4)
B)(10,-1), (1,-4), (2,-4), (3,-4)
C)(12,-1), (1,-4), (2,-4), (3,-4)
D)(4,-1), (1,-4), (2,-4), (3,-4)
E)(11,-1), (1,-4), (2,-4), (3,-4)
Unlock Deck
Unlock for access to all 69 flashcards in this deck.
Unlock Deck
k this deck
48
The graph shows the numbers of performers who were elected to the Rock and Roll Hall of Fame from 1991 through 2008.Describe any trends in the data.From these trends,predict the number of performers elected in 2009.
A)The number of performers elected in last four years in the graph seems to be nearly steady except for the first few years therefore five performers will be elected in 2009.
B)The number of performers elected in last four years in the graph seems to be nearly steady except for the first few years therefore seven performers will be elected in 2009.
C)The number of performers elected in last four years in the graph seems to be nearly steady except for the first few years therefore eight performers will be elected in 2009.
D)The number of performers elected in last four years in the graph seems to be nearly steady except for the first few years therefore six performers will be elected in 2009.
E)The number of performers elected in last four years in the graph seems to be nearly steady except for the first few years therefore nine performers will be elected in 2009.
Unlock Deck
Unlock for access to all 69 flashcards in this deck.
Unlock Deck
k this deck
49
Determine the quadrant(s)in which (x,y)is located so that the condition is satisfied. x = 2 and y < -8
A)quadrant II
B)quadrant IV
C)quadrants I and IV
D)quadrants II and IV
E)quadrants III and IV
A)quadrant II
B)quadrant IV
C)quadrants I and IV
D)quadrants II and IV
E)quadrants III and IV
Unlock Deck
Unlock for access to all 69 flashcards in this deck.
Unlock Deck
k this deck
50
Find the coordinates of the vertices of the polygon in its new position.
Original coordinates of vertices: (-5,-3), (-3,6), (-5,-4), (-4,-7)
Shift: three units to the right,four units upward
A)(-2,1), (0,10), (-2,0), (-1,-3)
B)(1,1), (0,10), (-2,0), (-1,-3)
C)(2,1), (0,10), (-2,0), (-1,-3)
D)(3,1), (0,10), (-2,0), (-1,-3)
E)(4,1), (0,10), (-2,0), (-1,-3)
Original coordinates of vertices: (-5,-3), (-3,6), (-5,-4), (-4,-7)
Shift: three units to the right,four units upward
A)(-2,1), (0,10), (-2,0), (-1,-3)
B)(1,1), (0,10), (-2,0), (-1,-3)
C)(2,1), (0,10), (-2,0), (-1,-3)
D)(3,1), (0,10), (-2,0), (-1,-3)
E)(4,1), (0,10), (-2,0), (-1,-3)
Unlock Deck
Unlock for access to all 69 flashcards in this deck.
Unlock Deck
k this deck
51
Use the graph,which shows the average retail prices of 1 gallon of whole milk from 1996 through 2007. Approximate the lowest price of a gallon of whole milk shown in the graph.When did this occur?
A)$2.97 / gal;2001
B)$3.17 / gal;2002
C)$3.07 / gal;2003
D)$2.67 / gal;1997
E)$3.87 / gal;2004
Approximate the lowest price of a gallon of whole milk shown in the graph.When did this occur?
A)$2.97 / gal;2001
B)$3.17 / gal;2002
C)$3.07 / gal;2003
D)$2.67 / gal;1997
E)$3.87 / gal;2004
Unlock Deck
Unlock for access to all 69 flashcards in this deck.
Unlock Deck
k this deck
52
Find the midpoint of the line segment joining the points (5.5,4.3)and (13.6,-1.2).
A)(19.1,3.1)
B)(8.1,-5.5)
C)(-4.05,2.75)
D)(9.55,1.55)
E)(4.05,-2.75)
A)(19.1,3.1)
B)(8.1,-5.5)
C)(-4.05,2.75)
D)(9.55,1.55)
E)(4.05,-2.75)
Unlock Deck
Unlock for access to all 69 flashcards in this deck.
Unlock Deck
k this deck
53
A quarterback is standing in the middle of the field 41 yards from his goal line.He passes the ball to a player 8 yards to his left on the 26 yard line.How long was the pass?
A)42 yards
B)15 yards
C)27 yards
D)17 yards
E)67 yards
A)42 yards
B)15 yards
C)27 yards
D)17 yards
E)67 yards
Unlock Deck
Unlock for access to all 69 flashcards in this deck.
Unlock Deck
k this deck
54
Find the distance between the points (4,-3)and (11,-3). ?
A)10
B)
C)3
D)
E)7
A)10
B)
C)3
D)
E)7
Unlock Deck
Unlock for access to all 69 flashcards in this deck.
Unlock Deck
k this deck
55
Plot the point (-3,1)on the Cartesian plane.
A)
B)
C)
D)
E)
A)
B)
C)
D)
E)
Unlock Deck
Unlock for access to all 69 flashcards in this deck.
Unlock Deck
k this deck
56
Use the Midpoint Formula to estimate the sales of Dollar Tree Stores,Inc.in 2005,given the sales in 2003 and 2007.Assume that the sales followed a linear pattern. Dollar tree
Year
Sales (in millions)
2003
2200
2007
4283
A)$3241.5 million
B)$3251.5 million
C)$3246.5 million
D)$3256.5 million
E)$3261.5 million
Year
Sales (in millions)
2003
2200
2007
4283
A)$3241.5 million
B)$3251.5 million
C)$3246.5 million
D)$3256.5 million
E)$3261.5 million
Unlock Deck
Unlock for access to all 69 flashcards in this deck.
Unlock Deck
k this deck
57
Find the distance between the points (4,-5)and (9,0).Round the answer to the nearest tenth.
A)7.1
B)7.4
C)7.3
D)7.5
E)6.9
A)7.1
B)7.4
C)7.3
D)7.5
E)6.9
Unlock Deck
Unlock for access to all 69 flashcards in this deck.
Unlock Deck
k this deck
58
Find the coordinates of the point C shown below.
A)(-2,3)
B)(3,-2)
C)(-4,-5)
D)(-5,-4)
E)(-5,-2)
A)(-2,3)
B)(3,-2)
C)(-4,-5)
D)(-5,-4)
E)(-5,-2)
Unlock Deck
Unlock for access to all 69 flashcards in this deck.
Unlock Deck
k this deck
59
Use the Midpoint Formula to estimate the sales of Big Lots,Inc.in 2005,given the sales in 2003 and 2007.Assume that the sales followed a linear pattern. Big Lots
Year
Sales (in millions)
2003
4174
2007
4700
A)$4700 million
B)$4457 million
C)$4174 million
D)$4437 million
E)$4447 million
Year
Sales (in millions)
2003
4174
2007
4700
A)$4700 million
B)$4457 million
C)$4174 million
D)$4437 million
E)$4447 million
Unlock Deck
Unlock for access to all 69 flashcards in this deck.
Unlock Deck
k this deck
60
Find the distance between the points.Round to the nearest hundredth,if necessary.
(-8,-8), (-1,9)
A)19.24
B)7.07
C)18.38
D)10
E)9.06
(-8,-8), (-1,9)
A)19.24
B)7.07
C)18.38
D)10
E)9.06
Unlock Deck
Unlock for access to all 69 flashcards in this deck.
Unlock Deck
k this deck
61
Write the standard form of the equation of the circle with center (3,-2)and solution point (-2,3). ?
A)
B)
C)
D)
E)
A)
B)
C)
D)
E)
Unlock Deck
Unlock for access to all 69 flashcards in this deck.
Unlock Deck
k this deck
62
Write the standard form of the equation of the circle with center (5,-7)and radius 5. ?
A)?
B)
C)
D)
E)
A)?
B)
C)
D)
E)
Unlock Deck
Unlock for access to all 69 flashcards in this deck.
Unlock Deck
k this deck
63
Write the standard form of the equation of the circle which has (-5,4)and (-1,8)as endpoints of a diameter. ?
A)?
B)
C)
D)
E)
A)?
B)
C)
D)
E)
Unlock Deck
Unlock for access to all 69 flashcards in this deck.
Unlock Deck
k this deck
64
The point A has coordinates (-3,5).If A is moved 3 units upward 6 units to the left,what are the new coordinates of A ?
A)(0,-1)
B)(3,8)
C)(0,11)
D)(-9,8)
E)(3,2)
A)(0,-1)
B)(3,8)
C)(0,11)
D)(-9,8)
E)(3,2)
Unlock Deck
Unlock for access to all 69 flashcards in this deck.
Unlock Deck
k this deck
65
Let M denote the midpoint of the line segment joining (4,3)and (11,6).Find the distance from M to the point (-6,-5).Round the answer to the nearest tenth.
A)16.7
B)16.1
C)16.5
D)15.9
E)16.2
A)16.7
B)16.1
C)16.5
D)15.9
E)16.2
Unlock Deck
Unlock for access to all 69 flashcards in this deck.
Unlock Deck
k this deck
66
Let M denote the midpoint of the line segment joining (2,3)and (7,6).Find the midpoint between M and (-6,-4).
A)(2,0.25)
B)(-0.75,0.25)
C)(-2,-0.5)
D)(4.5,4.5)
E)(0.5,1)
A)(2,0.25)
B)(-0.75,0.25)
C)(-2,-0.5)
D)(4.5,4.5)
E)(0.5,1)
Unlock Deck
Unlock for access to all 69 flashcards in this deck.
Unlock Deck
k this deck
67
Write the standard form of the equation of the circle tangent to the y-axis and with center (-3,-6). ?
A)?
B)
C)
D)
E)
A)?
B)
C)
D)
E)
Unlock Deck
Unlock for access to all 69 flashcards in this deck.
Unlock Deck
k this deck
68
Find the center and radius of the circle with equation . ?
A)Center: (7,2) Radius: 5
B)Center: (-7,2) Radius: 25
C)Center: (7,-2) Radius: 25
D)Center: (7,-2) Radius: 5
E)Center: (-7,2) Radius: 5
A)Center: (7,2) Radius: 5
B)Center: (-7,2) Radius: 25
C)Center: (7,-2) Radius: 25
D)Center: (7,-2) Radius: 5
E)Center: (-7,2) Radius: 5
Unlock Deck
Unlock for access to all 69 flashcards in this deck.
Unlock Deck
k this deck
69
Let S represent the midpoint between (5,3)and (-5,-7).Let T represent the midpoint between (5,3)and S.Find the coordinates of T.
A)(-2.5,-4.5)
B)(0,-2)
C)(0,0.5)
D)(2.5,0.5)
E)(2.5,-2)
A)(-2.5,-4.5)
B)(0,-2)
C)(0,0.5)
D)(2.5,0.5)
E)(2.5,-2)
Unlock Deck
Unlock for access to all 69 flashcards in this deck.
Unlock Deck
k this deck
Unlock Deck
Unlock for access to all 69 flashcards in this deck.


