Deck 5: Exponential and Logarithmic Functions
Full screen (f)
Question
If $1,200 is invested for x years at an annual rate of 7%, compounded quarterly, the future value that will result is 
Determine the value of the investment after 8 years. Round your answer to two decimal places, if necessary.
A) $5,229.16
B) $10,458.32
C) $2,061.82
D) $9,258.32
E) $672
Determine the value of the investment after 8 years. Round your answer to two decimal places, if necessary.
A) $5,229.16
B) $10,458.32
C) $2,061.82
D) $9,258.32
E) $672
Question
The percent concentration y of a certain drug in the bloodstream at any time t in minutes is given by the equation 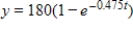 .
.
Graph this equation for 0 ≤ t ≤ 30.
A) 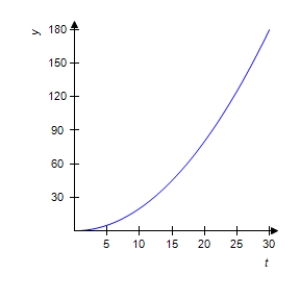
B) 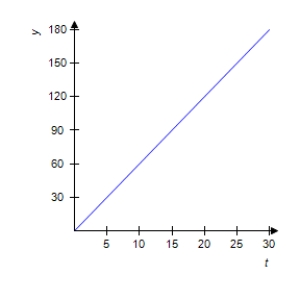
C) 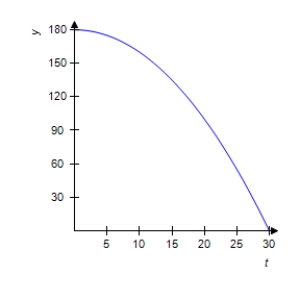
D) 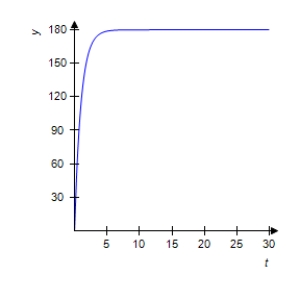
E) 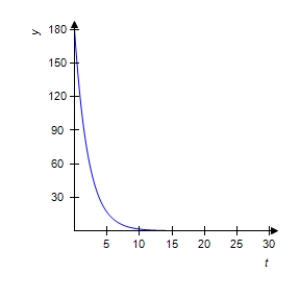
.
Graph this equation for 0 ≤ t ≤ 30.
A)
B)
C)
D)
E)
Question
Graph the function. 
A) 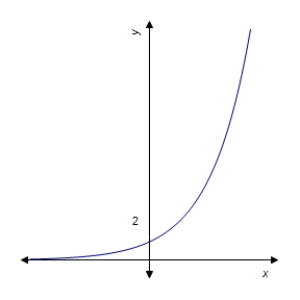
B) 
C) 
D) 
E) 
A)
B)
C)
D)
E)
Question
Graph the function. 
A) 
B) 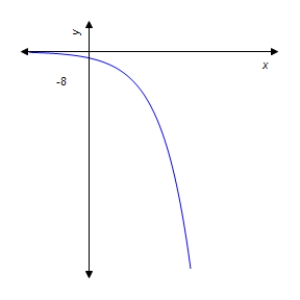
C) 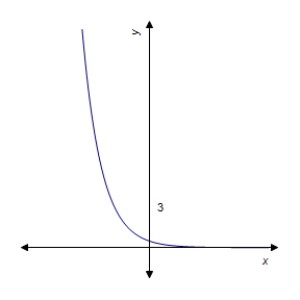
D) 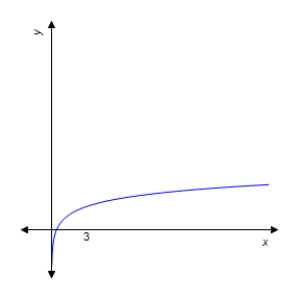
E) 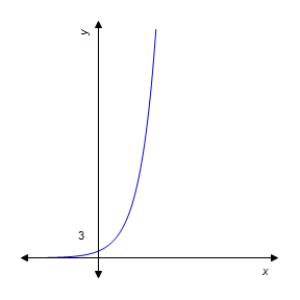
A)
B)
C)
D)
E)
Question
Graph the function. 
A) 
B) 
C) 
D) 
E) 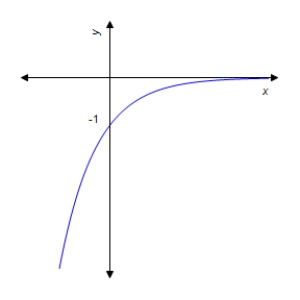
A)
B)
C)
D)
E)
Question
Let  . Use a graphing utility to graph the functions
  and
and  where
where  . Identify the graphs of
  and
and  below.
A) 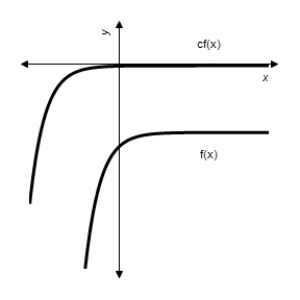
B) 
C) 
D) 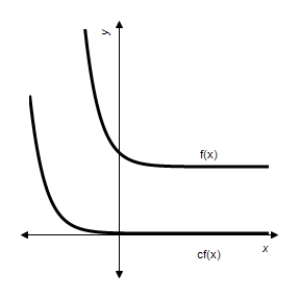
E) 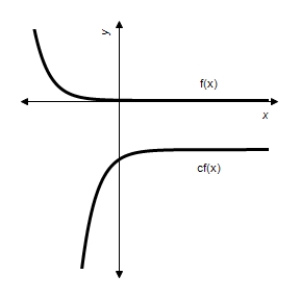
. Use a graphing utility to graph the functions and where . Identify the graphs of and below. A)
B)
C)
D)
E)
Question
A starfish population can be modeled by  , where
  is the number of individuals at time
  , r is the yearly rate of growth, and t is the number of years. Sketch the graph for
  to
to  when the growth rate is 2.1% and
  is 5.5 billion. All numbers on the vertical axis are in billions.
A) 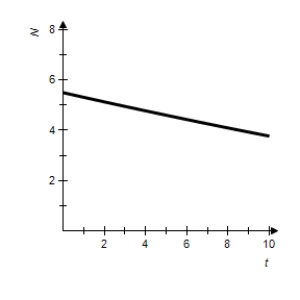
B) 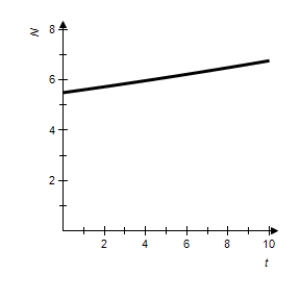
C) 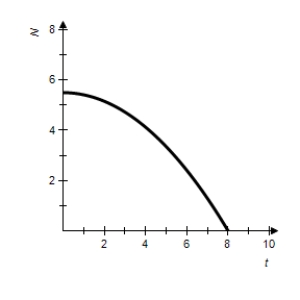
D) 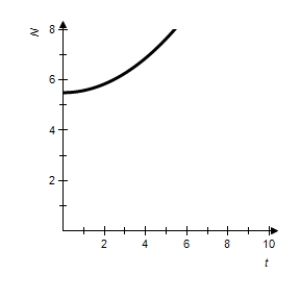
E) 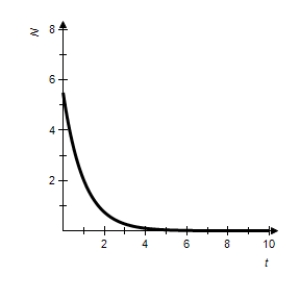
, where is the number of individuals at time , r is the yearly rate of growth, and t is the number of years. Sketch the graph for to when the growth rate is 2.1% and is 5.5 billion. All numbers on the vertical axis are in billions. A)
B)
C)
D)
E)
Question
Graph the function  .
.
A) 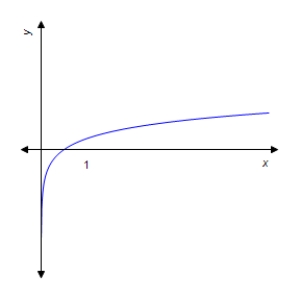
B) 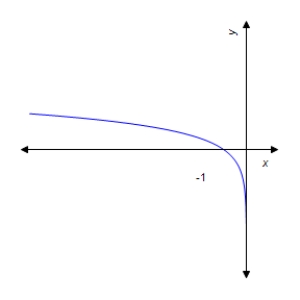
C) 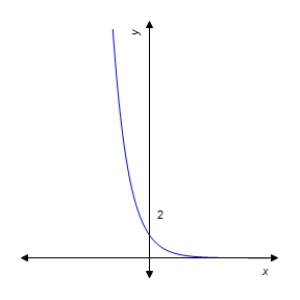
D) 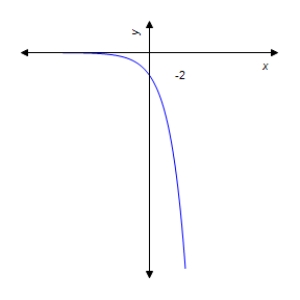
E) 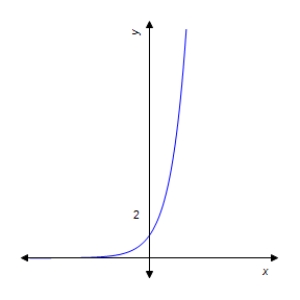
. A)
B)
C)
D)
E)
Question
Is the function  a growth exponential or decay exponential?
A) growth exponential
B) decay exponential
a growth exponential or decay exponential? A) growth exponential
B) decay exponential
Question
Express  in the form
  with an appropriate value of
  .
.
A)
B)
C)
D) -
E) -
in the form with an appropriate value of . A)
B)
C)
D) -
E) -
Question
Given  . Graph
  and
and 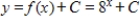 for
for  .
.
A) 
B) 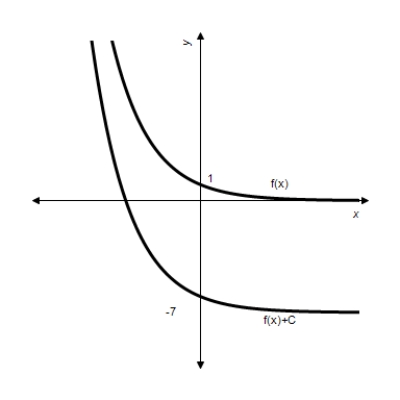
C) 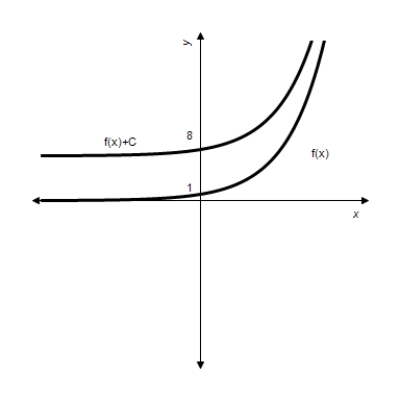
D) 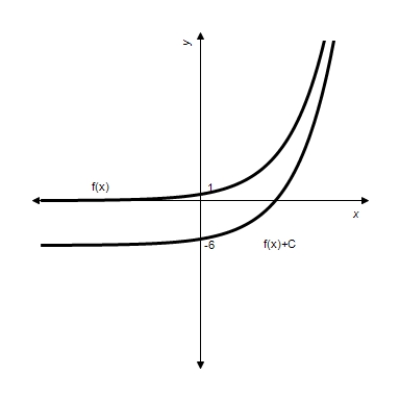
E) 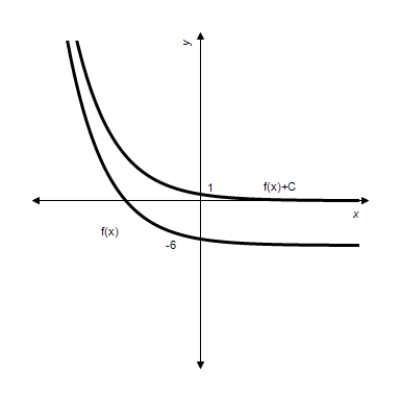
. Graph and for . A)
B)
C)
D)
E)
Question
Use a calculator to evaluate the expression. Round your answer to two decimal places, if necessary. 
A) 46,656
B) 1
C) 1.35
D) 8.09
E) 36
A) 46,656
B) 1
C) 1.35
D) 8.09
E) 36
Question
Use a calculator to evaluate the expression. Round your answer to six decimal places. 
A) -0.041235
B) -24.251465
C) -9.200000
D) 27.984100
E) 0.041235
A) -0.041235
B) -24.251465
C) -9.200000
D) 27.984100
E) 0.041235
Question
Use a calculator to evaluate the expression. Round your answer to four decimal places, if necessary. 
A) 0.0002
B) 3.4641
C) 0.2887
D) 8,192
E) 6
A) 0.0002
B) 3.4641
C) 0.2887
D) 8,192
E) 6
Question
Let 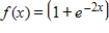 . Using a graphing utility, graph
 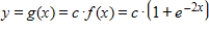 for
for  and
and  . What effect does c have on the graphs?
A) As c changes, the graph is shifted horizontally by c units.
B) As c changes, the graph is shifted vertically by c units.
C) As c changes, the y-intercept and the horizontal asymptote change.
D) As c changes, the graph is rotated c degrees.
E) As c changes, the graph is reflected over the line .
.
. Using a graphing utility, graph for and . What effect does c have on the graphs?
A) As c changes, the graph is shifted horizontally by c units.
B) As c changes, the graph is shifted vertically by c units.
C) As c changes, the y-intercept and the horizontal asymptote change.
D) As c changes, the graph is rotated c degrees.
E) As c changes, the graph is reflected over the line
. Question
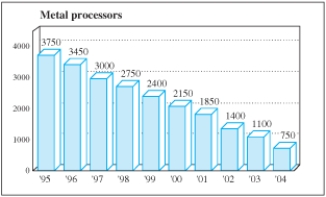
The following figure, from Investor's Business Daily (March 5, 1998), shows how quickly the U.S. metal processing industry isconsolidating. The linear equation that is the best fit for the number of metal processors as a function of years after 1990 is  , and the best exponential fit is
 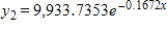 . The linear equation seems to give a much better fit for the data points than the exponential equation. Why then is the exponential equation a more useful model to predict the number of metal processors in
  ?
? 
A) The quantity of metal processing units as a function of time is exponential for the first five years, and linear for the next five years.
B) As the quantity of metal processors decreases, they decrease at an increasingly logarithmic rate as a function of time.
C) The number of metal processing units will probably start to increase in 2007.
D) The linear model gives a negative number of processors in 2010. The exponential model is always non-negative.
E) The number of metal processing units follows a parabolic model.
, and the best exponential fit is . The linear equation seems to give a much better fit for the data points than the exponential equation. Why then is the exponential equation a more useful model to predict the number of metal processors in ? A) The quantity of metal processing units as a function of time is exponential for the first five years, and linear for the next five years.
B) As the quantity of metal processors decreases, they decrease at an increasingly logarithmic rate as a function of time.
C) The number of metal processing units will probably start to increase in 2007.
D) The linear model gives a negative number of processors in 2010. The exponential model is always non-negative.
E) The number of metal processing units follows a parabolic model.
Question
We will show in the next chapter that if $P is invested for n years at an annual rate of 3% compounded continuously, the future value of the investment is given by 
Use and graph this function for
  .
.
A) 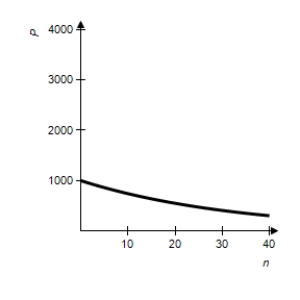
B) 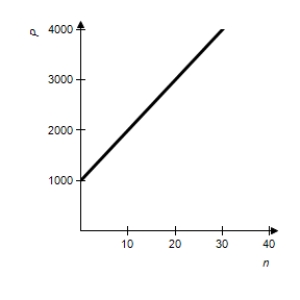
C) 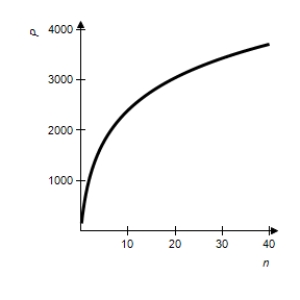
D) 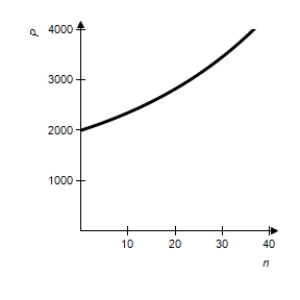
E) 
Use
and graph this function for .
A)
B)
C)
D)
E)
Question
The percent concentration y of a certain drug in the bloodstream at any time t in minutes is given by the equation 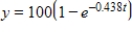 . Graph this function with a graphing utility. Which of the following statements best describes the situation after 10 hours?
A) After 10 hours, 50% of the drug is in the blood stream.
B) After 10 hours, 10% of the drug is in the blood stream.
C) After 10 hours, there are almost 100 units of the drug in the blood stream.
D) After 10 hours, the drug has almost completely dissipated.
E) After 10 hours, the drug is almost completely in the blood stream.
. Graph this function with a graphing utility. Which of the following statements best describes the situation after 10 hours? A) After 10 hours, 50% of the drug is in the blood stream.
B) After 10 hours, 10% of the drug is in the blood stream.
C) After 10 hours, there are almost 100 units of the drug in the blood stream.
D) After 10 hours, the drug has almost completely dissipated.
E) After 10 hours, the drug is almost completely in the blood stream.
Question
Use a calculator to evaluate the expression. Round your answer to two decimal places. 
A) 20.09
B) 8.15
C) 19.81
D) 54.60
E) 16.31
A) 20.09
B) 8.15
C) 19.81
D) 54.60
E) 16.31
Question
Graph the function. 
A) 
B) 
C) 
D) 
E) 
A)
B)
C)
D)
E)
Question
Solve for x by writing the equation in exponential form. Round your answer two decimal places, if necessary. 
A) 20
B) 1,024
C) 625
D) 54.60
E) 3,125
A) 20
B) 1,024
C) 625
D) 54.60
E) 3,125
Question
Use properties of logarithms or a definition to simplify the expression.
If find
find  .
.
A)
B)
C)
D)
E)
If
find .
A)
B)
C)
D)
E)
Question
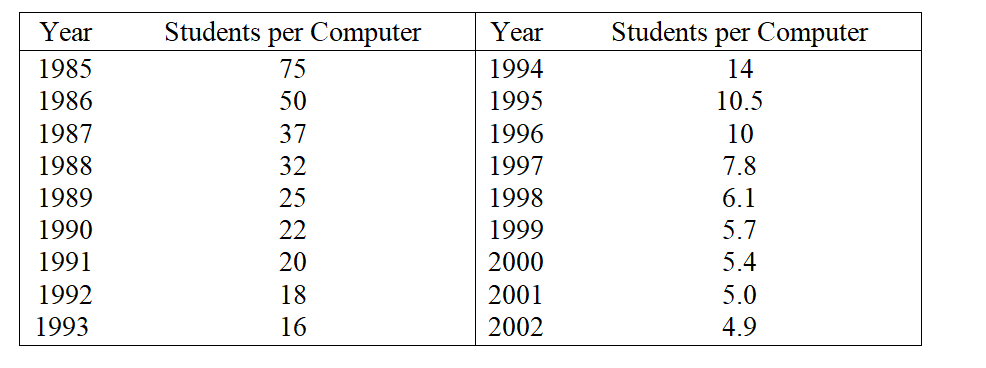
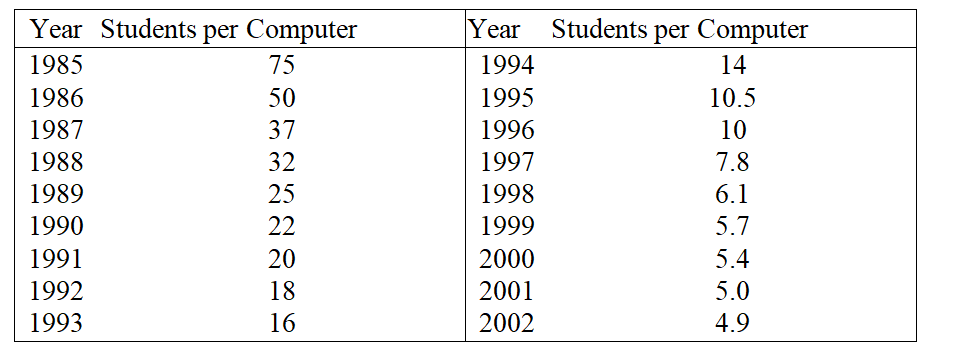
The following table gives the average number of students per computer in public schools for the school years that ended in 1985 through 2002. Let x be the number of years past 1980. Find an exponential model for these data. Round your answer to three decimal places.
Source: Quality Education Data, Inc., Denver, Colorado
A) 
B) 
C) 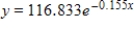
D) 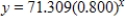
E) 
Source: Quality Education Data, Inc., Denver, Colorado
A)
B)
C)
D)
E)
Question
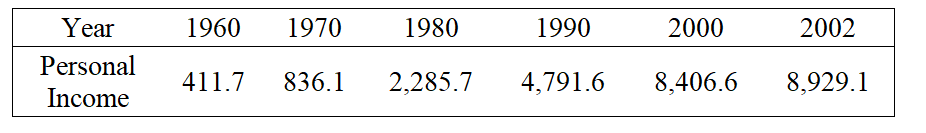
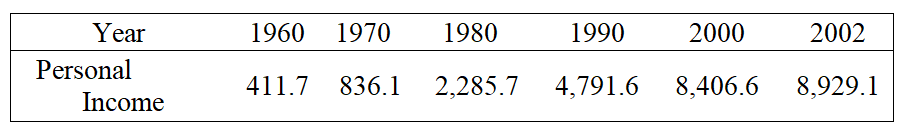
Total personal income in the United States (in billions of dollars) for selected years from 1960 to 2002 is given in the following table.
Source: Bureau of Economic Analysis, U.S. Department of Commerce
These data can be modeled by an exponential function. Write the equation of this function, with x as the number of years past 1960. If this model is accurate, what will be the total U.S. personal income in 2010? Round your answer to two decimal places.
A) $13,899.68 billions
B) $15,216.17 billions
C) $17,199.23 billions
D) $18,464.37 billions
E) $20,698.13 billions
Question
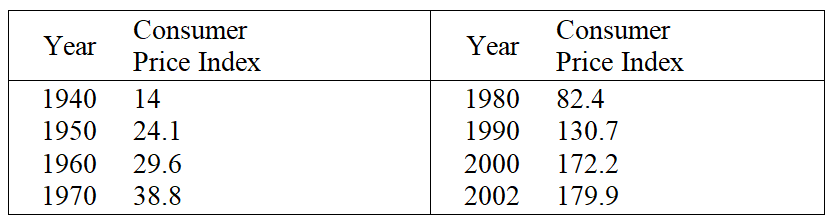
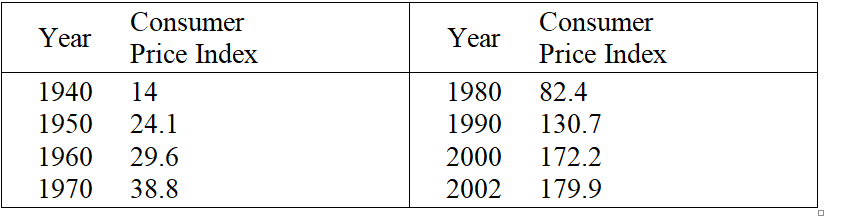
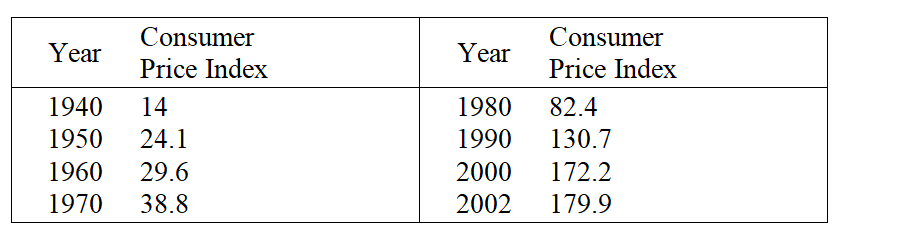
The consumer price index (CPI) is calculated by averaging the prices of various items after assigning a weight to each item. The following table gives the consumer price indexes for selected years from 1940 through 2002, reflecting buying patterns of all urban consumers, with x representing years past 1900. Find an equation that models these data. If it's necessary, round your calculations to four decimal places.
Source: U.S. Bureau of the Census
A)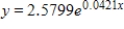
B)
C)
D)
E)
Source: U.S. Bureau of the Census
A)
B)
C)
D)
E)
Question
Total personal income in the United States (in billions of dollars) for selected years from 1960 to 2002 is given in the following table.
Source: Bureau of Economic Analysis, U.S. Department of Commerce
These data can be modeled by an exponential function. Write the equation of this function, with x as the number of years past 1960. If it's necessary round your calculations to four decimal places.
A)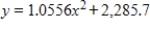
B)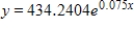
C)
D)
E)
Source: Bureau of Economic Analysis, U.S. Department of Commerce
These data can be modeled by an exponential function. Write the equation of this function, with x as the number of years past 1960. If it's necessary round your calculations to four decimal places.
A)
B)
C)
D)
E)
Question
Use properties of logarithms or a definition to simplify the expression.
If , find
  .
.
A)
B)
C)
D)
E)
If
, find .
A)
B)
C)
D)
E)
Question
The consumer price index (CPI) is calculated by averaging the prices of various items after assigning a weight to each item. The following table gives the consumer price indexes for selected years from 1940 through 2002, reflecting buying patterns of all urban consumers. Find an equation that models these data and use it to determine when the consumer price index will pass 349.
Source: U.S. Bureau of the Census
A) The 2011 - 2012 year
B) The 2012 - 2013 year
C) The 2014 - 2015 year
D) The 2016 - 2017 year
E) The 2019 - 2020 year
Source: U.S. Bureau of the Census
A) The 2011 - 2012 year
B) The 2012 - 2013 year
C) The 2014 - 2015 year
D) The 2016 - 2017 year
E) The 2019 - 2020 year
Question
Write the equation in logarithmic form. 
A)
B)
C)
D)
E)
A)
B)
C)
D)
E)
Question
Write the equation in logarithmic form. 
A)
B)
C)
D)
E)
A)
B)
C)
D)
E)
Question
The consumer price index (CPI) is calculated by averaging the prices of various items after assigning a weight to each item. The following table gives the consumer price indexes for selected years from 1940 through 2002, reflecting buying patterns of all urban consumers. Find an equation that models these data and use it to predict the consumer price index in 2015. Use the model to predict the consumer price index in 2015. Round your answer to two decimal places.
Source: U.S. Bureau of the Census
A) 76.47
B) 129.14
C) 169.33
D) 216.39
E) 326.77
Source: U.S. Bureau of the Census
A) 76.47
B) 129.14
C) 169.33
D) 216.39
E) 326.77
Question
Use properties of logarithms or a definition to simplify the expression. Check the result with a change-of-base formula and a calculator. 
A) 8
B) 1
C) 4
D) -1
E) no solution
A) 8
B) 1
C) 4
D) -1
E) no solution
Question
The following table gives the average number of students per computer in public schools for the school years that ended in 1985 through 2002. Find an exponential model for these data. How many students per computer in public schools does this model predict for 2005? Round your answer to two decimal places.
A) 1.92
B) 2.42
C) 4.32
D) 3.42
E) 4.92
A) 1.92
B) 2.42
C) 4.32
D) 3.42
E) 4.92
Question
Use properties of logarithms or a definition to simplify the expression. Check the result with a change-of-base formula and a calculator. Round your answer two decimal places. 
A) 20.09
B) 4.00
C) 64.00
D) 243.00
E) no solution
A) 20.09
B) 4.00
C) 64.00
D) 243.00
E) no solution
Question
Graph the function. 
A) 
B) 
C) 
D) 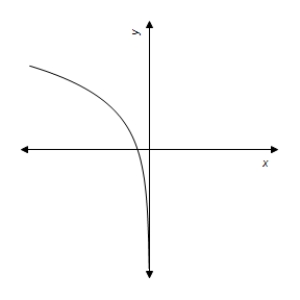
E) 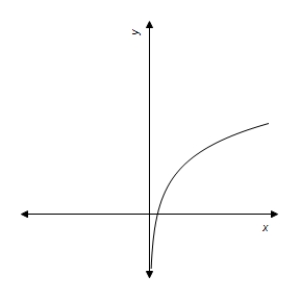
A)
B)
C)
D)
E)
Question
Write the equation in exponential form. 
A)
B)
C)
D)
E)
A)
B)
C)
D)
E)
Question
Graph the function. 
A) 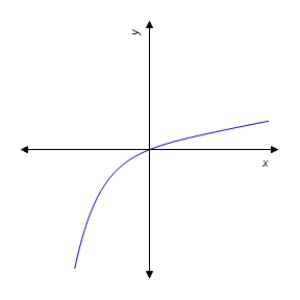
B) 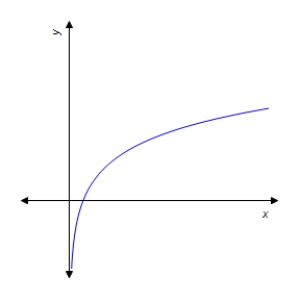
C) 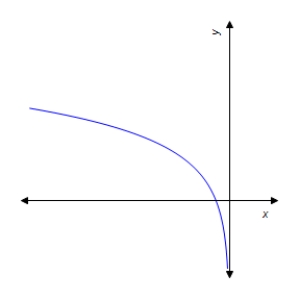
D) 
E) 
A)
B)
C)
D)
E)
Question
Write the equation in exponential form. 
A)
B)
C)
D)
E)
A)
B)
C)
D)
E)
Question
Solve for x by writing the equation in exponential form. 
A)
B) 
C) 124
D) 5
E) 45
A)
B)
C) 124
D) 5
E) 45
Question
Solve for x by writing the equation in exponential form. Round your answer to two decimal places, if necessary. 
A)
B)
C)
D)
E)
A)
B)
C)
D)
E)
Question
Use a change-of-base formula to rewrite the logarithm in terms of natural logarithms. 
A)
B)
C)
D)
E)
A)
B)
C)
D)
E)
Question
Use the formula 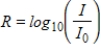 .
.
The San Francisco earthquake of 1906 measured 8.25 on the Richter scale, and the San Francisco earthquake of 1989 measured 7.1. How much more intense was the 1906 quake?
A) 0.3 times as severe.
B) 1.5 times as severe
C) 5.7 times as severe
D) 10.8 times as severe
E) 14.1 times as severe
. The San Francisco earthquake of 1906 measured 8.25 on the Richter scale, and the San Francisco earthquake of 1989 measured 7.1. How much more intense was the 1906 quake?
A) 0.3 times as severe.
B) 1.5 times as severe
C) 5.7 times as severe
D) 10.8 times as severe
E) 14.1 times as severe
Question
Use the properties of logarithms to write the expression as a single logarithm. 
A)
B)
C)
D)
E)
A)
B)
C)
D)
E)
Question
Given  , use a graphing calculator to graph
  for
for  and
and  .
.
A) 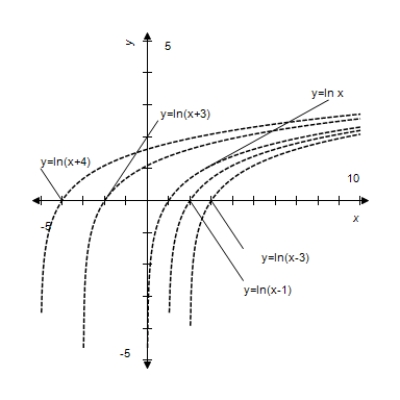
B) 
C) 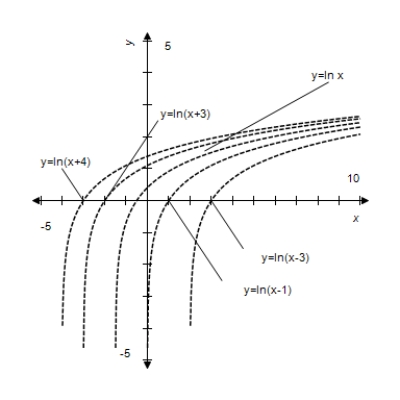
D) 
E) 
, use a graphing calculator to graph for and . A)
B)
C)
D)
E)
Question
Use properties of logarithms or a definition to simplify the expression.
If , find
  .
.
A) 5
B) 10
C)
D) 100,000
E) 50
If
, find .
A) 5
B) 10
C)
D) 100,000
E) 50
Question
Use a calculator to determine whether expression (a) is equivalent to expression (b). 

A) equivalent
B) not equivalent
A) equivalent
B) not equivalent
Question
Use the following information. Chemists use the pH (hydrogen potential) of a solution to measure its acidity or basicity. The pH is given by the formula 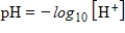 , where
  is the concentration of hydrogen ions in moles per liter. What value of
  is associated with pH level 12?
A)
B)
C)
D)
E)
, where is the concentration of hydrogen ions in moles per liter. What value of is associated with pH level 12? A)
B)
C)
D)
E)
Question
Evaluate the logarithm by using properties of logarithms and the following facts. Round your answer two decimal places. 

A) 1.48
B) 1.10
C) 4.40
D) 1.45
E) 0.67
A) 1.48
B) 1.10
C) 4.40
D) 1.45
E) 0.67
Question
Evaluate the logarithm by using properties of logarithms and the following facts. Round your answer to two decimal places. 

A) 1.15
B) 8.37
C) 1.14
D) 0.40
E) 5.80
A) 1.15
B) 8.37
C) 1.14
D) 0.40
E) 5.80
Question
Evaluate the logarithm by using properties of logarithms and the following fact. Round your answer two decimal places. 

A) 10.40
B) 1.91
C) 4.60
D) 6.76
E) 5.20
A) 10.40
B) 1.91
C) 4.60
D) 6.76
E) 5.20
Question
Use a calculator to determine whether expression (a) is equivalent to expression (b). 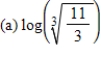
A) equivalent
B) not equivalent
A) equivalent
B) not equivalent
Question
Use the fact that the loudness of sound (in decibels) perceived by the human ear depends on intensity levels according to 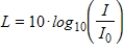 , where
  is the threshold of hearing for the average human ear. Find the loudness when I is 1,000 times
  .
.
A) 3
B) 30
C) 4
D) 300
E) 100
, where is the threshold of hearing for the average human ear. Find the loudness when I is 1,000 times . A) 3
B) 30
C) 4
D) 300
E) 100
Question
Find an equivalent expression for the given logarithm using the change-of-base formula. 
A) 
B) 
C) 
D) 
E) 
A)
B)
C)
D)
E)
Question
Evaluate the logarithm by using properties of logarithms and the following facts. Round your answer two decimal places.

A) 7.70
B) 14.82
C) 0.10
D) 1.82
E) 1.03
A) 7.70
B) 14.82
C) 0.10
D) 1.82
E) 1.03
Question
Write the expression as the sum or difference of two logarithmic functions containing no exponents. 
A)
B)
C)
D)
E)
A)
B)
C)
D)
E)
Question
Use the formula  .
.
In October 2004, an earthquake measuring 6.8 on the Richter scale occurred in Japan. The largest quake in Japan since 1990 was one in 1993 that registered 7.7. How many times more severe was the 1993 shock than the one in 2004 on the Richter scale? Round your answer to one decimal place.
A) 0.7 times as severe
B) 1.9 times as severe
C) 7.9 times as severe
D) 9.3 times as severe
E) 19.1 times as severe
. In October 2004, an earthquake measuring 6.8 on the Richter scale occurred in Japan. The largest quake in Japan since 1990 was one in 1993 that registered 7.7. How many times more severe was the 1993 shock than the one in 2004 on the Richter scale? Round your answer to one decimal place.
A) 0.7 times as severe
B) 1.9 times as severe
C) 7.9 times as severe
D) 9.3 times as severe
E) 19.1 times as severe
Question
Write the expression as the sum or difference of two logarithmic functions containing no exponents. 
A)
B)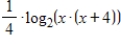
C)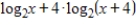
D)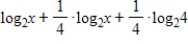
E)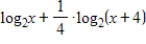
A)
B)
C)
D)
E)
Question
Which answer choice is a graph of the function? 
A) 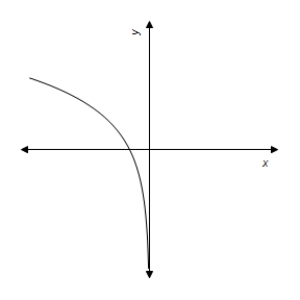
B) 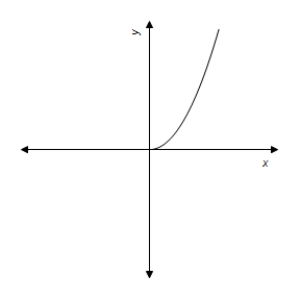
C) 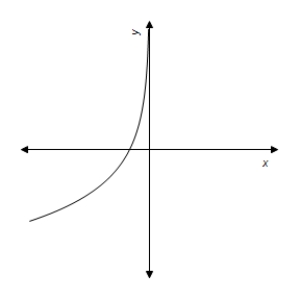
D) 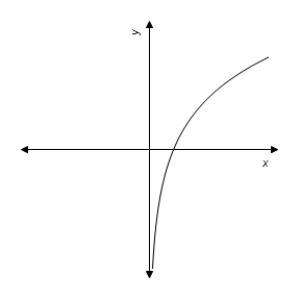
E) 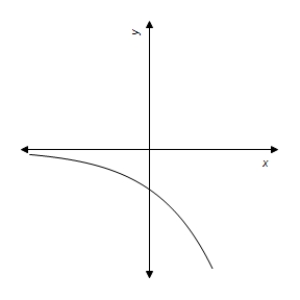
A)
B)
C)
D)
E)
Question
Use a change-of-base formula to evaluate  with a calculator or other technology. Round your answer to four decimal places.
A) 0.3801
B) 3.1754
C) 2.6309
D) 3.9890
E) 3.0445
with a calculator or other technology. Round your answer to four decimal places. A) 0.3801
B) 3.1754
C) 2.6309
D) 3.9890
E) 3.0445
Question
Use the properties of logarithms to write the expression as a single logarithm. 
A)
B)
C)
D)
E)
A)
B)
C)
D)
E)
Question
The monthly sales S for a product is given by  , where x is the number of months that have passed since the end of a promotional campaign. How many months after the end of the campaign will sales drop below 6,000, if no new campaign is initiated? Round to two decimal places.
A) 2.65 months
B) 4.32 months
C) 5.12 months
D) 6.16 months
E) 7.36 months
, where x is the number of months that have passed since the end of a promotional campaign. How many months after the end of the campaign will sales drop below 6,000, if no new campaign is initiated? Round to two decimal places. A) 2.65 months
B) 4.32 months
C) 5.12 months
D) 6.16 months
E) 7.36 months
Question
Solve the exponential equation. Round your answer to three decimal places, if necessary. 
A) 125
B) 0.667
C) 0.861
D) 0.408
E) 63
A) 125
B) 0.667
C) 0.861
D) 0.408
E) 63
Question
The purchasing power P (in dollars) of an annual amount of A dollars after t years of 4% inflation decays according to  . How long will it be before a pension of $60,000 per year has a purchasing power of $30,000? Round your answer to one decimal place.
A) 1.0 year
B) 9.7 years
C) 15.8 years
D) 35.7 years
E) 17.3 years
. How long will it be before a pension of $60,000 per year has a purchasing power of $30,000? Round your answer to one decimal place. A) 1.0 year
B) 9.7 years
C) 15.8 years
D) 35.7 years
E) 17.3 years
Question
Solve the exponential equation. Give the answer correct to 3 decimal places. 
A) 0.802
B) 1.605
C) 2.493
D) 0.936
E) 3.744
A) 0.802
B) 1.605
C) 2.493
D) 0.936
E) 3.744
Question
Solve the exponential equation. Give answers correct to 3 decimal places. 
A) 1.159
B) 0.093
C) 10.714
D) -0.093
E) -0.424
A) 1.159
B) 0.093
C) 10.714
D) -0.093
E) -0.424
Question
Solve the logarithmic equation  . Round your answer to three decimal places.
A)
B)
C)
D)
E)
. Round your answer to three decimal places. A)
B)
C)
D)
E)
Question
An initial amount of 300 g of the radioactive isotope thorium-234 decays according to  , where t is in years. How long does it take for half of the initial amount to disintegrate? This time is called the half-life of this isotope. Round your answer to one decimal place.
A) 240.5 years
B) 170.7 years
C) 24.5 years
D) 27.5 years
E) 245.1 years
, where t is in years. How long does it take for half of the initial amount to disintegrate? This time is called the half-life of this isotope. Round your answer to one decimal place. A) 240.5 years
B) 170.7 years
C) 24.5 years
D) 27.5 years
E) 245.1 years
Question
Solve the exponential equation. Give the answer correct to 3 decimal places. 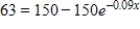
A) -0.545
B) 9.639
C) 6.053
D) -9.639
E) -3.896
A) -0.545
B) 9.639
C) 6.053
D) -9.639
E) -3.896
Question
Solve the exponential equation. Give the answer correct to 3 decimal places. 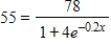
A) -2.258
B) -0.523
C) 2.516
D) -0.503
E) 11.291
A) -2.258
B) -0.523
C) 2.516
D) -0.503
E) 11.291
Question
The purchasing power P (in dollars) of an annual amount of A dollars after t years of 4% inflation decays according to  . Determine how large a pension A needs to be so that the purchasing power P is $70,000 after 25 years? Round your answer to the nearest dollar.
A) $260,683
B) $190,280
C) $115,410
D) $156,191
E) $95,141
. Determine how large a pension A needs to be so that the purchasing power P is $70,000 after 25 years? Round your answer to the nearest dollar. A) $260,683
B) $190,280
C) $115,410
D) $156,191
E) $95,141
Question
For selected years from 1960 to 2001, the national health care expenditures H, in billions of dollars, can be modeled by 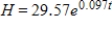 , where t is the number of years past 1960 (Source: U.S. Department of Health and Human Services). If this model remains accurate, in what year will national health care expenditures reach $3 trillion (that is, $3000 billion)? Round your answer to the nearest year.
A) in the year 2008
B) in the year 2018
C) in the year 2013
D) in the year 2011
E) in the year 2009
, where t is the number of years past 1960 (Source: U.S. Department of Health and Human Services). If this model remains accurate, in what year will national health care expenditures reach $3 trillion (that is, $3000 billion)? Round your answer to the nearest year. A) in the year 2008
B) in the year 2018
C) in the year 2013
D) in the year 2011
E) in the year 2009
Question
The monthly sales S for a product is given by  , where x is the number of months that have passed since the end of a promotional campaign. Determine the monthly sales 4 months after the promotional campaign. Round your answer to the nearest cent.
A) $36,243.76
B) $2,038.11
C) $38,296.42
D) $1,226,626.51
E) $65,280.26
, where x is the number of months that have passed since the end of a promotional campaign. Determine the monthly sales 4 months after the promotional campaign. Round your answer to the nearest cent. A) $36,243.76
B) $2,038.11
C) $38,296.42
D) $1,226,626.51
E) $65,280.26
Question
Solve the logarithmic equation  . Round your answer to three decimal places.
A)
B)
C)
D)
E)
. Round your answer to three decimal places. A)
B)
C)
D)
E)
Question
Between the years 1960 and 2002, the percent of women in the work force is given by  , where x is the number of years past 1950 (Source: U.S. Bureau of Labor Statistics). What does this model estimate to be the percent of women in the work force in 2019? Round your answer to two decimal places.
A) 64.24
B) 61.69
C) 66.61
D) 75.71
E) 51.70
, where x is the number of years past 1950 (Source: U.S. Bureau of Labor Statistics). What does this model estimate to be the percent of women in the work force in 2019? Round your answer to two decimal places. A) 64.24
B) 61.69
C) 66.61
D) 75.71
E) 51.70
Question
Solve the logarithmic equation  .
.
A)
B)
C)
D)
E)
. A)
B)
C)
D)
E)
Question
The population y of a certain country was 100,000 in 1990 and 149,182 in 2000. Assume the formula  applies to the growth of the country's population. Estimate the population of the country in 2010. Round your answer to the nearest human.
A) 149,182
B) 332,012
C) 222,554
D) 67,032
E) 44,933
applies to the growth of the country's population. Estimate the population of the country in 2010. Round your answer to the nearest human. A) 149,182
B) 332,012
C) 222,554
D) 67,032
E) 44,933
Question
Between the years 1960 and 2002, the percent of women in the work force is given by 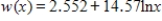 , where x is the number of years past 1950 (Source: U.S. Bureau of Labor Statistics). Graph this function with a graphing utility and use the graph drawn to estimate the year in which the percent reached 50. Round your answer to the nearest year.
A) 1964
B) 1970
C) 1976
D) 1984
E) 1989
, where x is the number of years past 1950 (Source: U.S. Bureau of Labor Statistics). Graph this function with a graphing utility and use the graph drawn to estimate the year in which the percent reached 50. Round your answer to the nearest year. A) 1964
B) 1970
C) 1976
D) 1984
E) 1989
Question
Use the formula 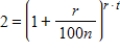 to find the doubling time t, in years, for an investment at r% compounded n times per year. Suppose you make an investment of $1,300 at interest rate 11% compounded quarterly. How long will it take for your investment to double? Round your answer to two decimal places.
A) 2.13 years
B) 12.78 years
C) 3.19 years
D) 3.32 years
E) 6.39 years
to find the doubling time t, in years, for an investment at r% compounded n times per year. Suppose you make an investment of $1,300 at interest rate 11% compounded quarterly. How long will it take for your investment to double? Round your answer to two decimal places. A) 2.13 years
B) 12.78 years
C) 3.19 years
D) 3.32 years
E) 6.39 years
Question
The demand function for a certain commodity is given by  , where q is number of units. At what price per unit will the quantity demanded equal 6 units? Round your answer to the nearest cent.
A) $0.25
B) $0.40
C) $2.01
D) $4.98
E) $0.74
, where q is number of units. At what price per unit will the quantity demanded equal 6 units? Round your answer to the nearest cent. A) $0.25
B) $0.40
C) $2.01
D) $4.98
E) $0.74
Question
The demand function for a certain commodity is given by  , where q is number of units. If the price is $1.11 per unit, how many units will be demanded, to the nearest unit?
A) 9 units
B) 7 units
C) 11 units
D) 10 units
E) 12 units
, where q is number of units. If the price is $1.11 per unit, how many units will be demanded, to the nearest unit? A) 9 units
B) 7 units
C) 11 units
D) 10 units
E) 12 units

Unlock Deck
Sign up to unlock the cards in this deck!
Unlock Deck
Unlock Deck
1/109
Play
Full screen (f)
Deck 5: Exponential and Logarithmic Functions
1
If $1,200 is invested for x years at an annual rate of 7%, compounded quarterly, the future value that will result is
Determine the value of the investment after 8 years. Round your answer to two decimal places, if necessary.
A) $5,229.16
B) $10,458.32
C) $2,061.82
D) $9,258.32
E) $672
Determine the value of the investment after 8 years. Round your answer to two decimal places, if necessary.
A) $5,229.16
B) $10,458.32
C) $2,061.82
D) $9,258.32
E) $672
$10,458.32
2
The percent concentration y of a certain drug in the bloodstream at any time t in minutes is given by the equation .
Graph this equation for 0 ≤ t ≤ 30.
A)
B)
C)
D)
E)
.
Graph this equation for 0 ≤ t ≤ 30.
A)
B)
C)
D)
E)
3
Graph the function.
A)
B)
C)
D)
E)
A)
B)
C)
D)
E)
4
Graph the function.
A)
B)
C)
D)
E)
A)
B)
C)
D)
E)
Unlock Deck
Unlock for access to all 109 flashcards in this deck.
Unlock Deck
k this deck
5
Graph the function.
A)
B)
C)
D)
E)
A)
B)
C)
D)
E)
Unlock Deck
Unlock for access to all 109 flashcards in this deck.
Unlock Deck
k this deck
6
Let . Use a graphing utility to graph the functions and where . Identify the graphs of and below.
A)
B)
C)
D)
E)
. Use a graphing utility to graph the functions and where . Identify the graphs of and below. A)
B)
C)
D)
E)
Unlock Deck
Unlock for access to all 109 flashcards in this deck.
Unlock Deck
k this deck
7
A starfish population can be modeled by , where is the number of individuals at time , r is the yearly rate of growth, and t is the number of years. Sketch the graph for to when the growth rate is 2.1% and is 5.5 billion. All numbers on the vertical axis are in billions.
A)
B)
C)
D)
E)
, where is the number of individuals at time , r is the yearly rate of growth, and t is the number of years. Sketch the graph for to when the growth rate is 2.1% and is 5.5 billion. All numbers on the vertical axis are in billions. A)
B)
C)
D)
E)
Unlock Deck
Unlock for access to all 109 flashcards in this deck.
Unlock Deck
k this deck
8
Graph the function .
A)
B)
C)
D)
E)
. A)
B)
C)
D)
E)
Unlock Deck
Unlock for access to all 109 flashcards in this deck.
Unlock Deck
k this deck
9
Is the function a growth exponential or decay exponential?
A) growth exponential
B) decay exponential
a growth exponential or decay exponential? A) growth exponential
B) decay exponential
Unlock Deck
Unlock for access to all 109 flashcards in this deck.
Unlock Deck
k this deck
10
Express in the form with an appropriate value of .
A)
B)
C)
D) -
E) -
in the form with an appropriate value of . A)
B)
C)
D) -
E) -
Unlock Deck
Unlock for access to all 109 flashcards in this deck.
Unlock Deck
k this deck
11
Given . Graph and for .
A)
B)
C)
D)
E)
. Graph and for . A)
B)
C)
D)
E)
Unlock Deck
Unlock for access to all 109 flashcards in this deck.
Unlock Deck
k this deck
12
Use a calculator to evaluate the expression. Round your answer to two decimal places, if necessary.
A) 46,656
B) 1
C) 1.35
D) 8.09
E) 36
A) 46,656
B) 1
C) 1.35
D) 8.09
E) 36
Unlock Deck
Unlock for access to all 109 flashcards in this deck.
Unlock Deck
k this deck
13
Use a calculator to evaluate the expression. Round your answer to six decimal places.
A) -0.041235
B) -24.251465
C) -9.200000
D) 27.984100
E) 0.041235
A) -0.041235
B) -24.251465
C) -9.200000
D) 27.984100
E) 0.041235
Unlock Deck
Unlock for access to all 109 flashcards in this deck.
Unlock Deck
k this deck
14
Use a calculator to evaluate the expression. Round your answer to four decimal places, if necessary.
A) 0.0002
B) 3.4641
C) 0.2887
D) 8,192
E) 6
A) 0.0002
B) 3.4641
C) 0.2887
D) 8,192
E) 6
Unlock Deck
Unlock for access to all 109 flashcards in this deck.
Unlock Deck
k this deck
15
Let . Using a graphing utility, graph for and . What effect does c have on the graphs?
A) As c changes, the graph is shifted horizontally by c units.
B) As c changes, the graph is shifted vertically by c units.
C) As c changes, the y-intercept and the horizontal asymptote change.
D) As c changes, the graph is rotated c degrees.
E) As c changes, the graph is reflected over the line .
. Using a graphing utility, graph for and . What effect does c have on the graphs?
A) As c changes, the graph is shifted horizontally by c units.
B) As c changes, the graph is shifted vertically by c units.
C) As c changes, the y-intercept and the horizontal asymptote change.
D) As c changes, the graph is rotated c degrees.
E) As c changes, the graph is reflected over the line
. Unlock Deck
Unlock for access to all 109 flashcards in this deck.
Unlock Deck
k this deck
16
The following figure, from Investor's Business Daily (March 5, 1998), shows how quickly the U.S. metal processing industry isconsolidating. The linear equation that is the best fit for the number of metal processors as a function of years after 1990 is , and the best exponential fit is . The linear equation seems to give a much better fit for the data points than the exponential equation. Why then is the exponential equation a more useful model to predict the number of metal processors in ?
A) The quantity of metal processing units as a function of time is exponential for the first five years, and linear for the next five years.
B) As the quantity of metal processors decreases, they decrease at an increasingly logarithmic rate as a function of time.
C) The number of metal processing units will probably start to increase in 2007.
D) The linear model gives a negative number of processors in 2010. The exponential model is always non-negative.
E) The number of metal processing units follows a parabolic model.
, and the best exponential fit is . The linear equation seems to give a much better fit for the data points than the exponential equation. Why then is the exponential equation a more useful model to predict the number of metal processors in ? A) The quantity of metal processing units as a function of time is exponential for the first five years, and linear for the next five years.
B) As the quantity of metal processors decreases, they decrease at an increasingly logarithmic rate as a function of time.
C) The number of metal processing units will probably start to increase in 2007.
D) The linear model gives a negative number of processors in 2010. The exponential model is always non-negative.
E) The number of metal processing units follows a parabolic model.
Unlock Deck
Unlock for access to all 109 flashcards in this deck.
Unlock Deck
k this deck
17
We will show in the next chapter that if $P is invested for n years at an annual rate of 3% compounded continuously, the future value of the investment is given by
Use and graph this function for .
A)
B)
C)
D)
E)
Use
and graph this function for .
A)
B)
C)
D)
E)
Unlock Deck
Unlock for access to all 109 flashcards in this deck.
Unlock Deck
k this deck
18
The percent concentration y of a certain drug in the bloodstream at any time t in minutes is given by the equation . Graph this function with a graphing utility. Which of the following statements best describes the situation after 10 hours?
A) After 10 hours, 50% of the drug is in the blood stream.
B) After 10 hours, 10% of the drug is in the blood stream.
C) After 10 hours, there are almost 100 units of the drug in the blood stream.
D) After 10 hours, the drug has almost completely dissipated.
E) After 10 hours, the drug is almost completely in the blood stream.
. Graph this function with a graphing utility. Which of the following statements best describes the situation after 10 hours? A) After 10 hours, 50% of the drug is in the blood stream.
B) After 10 hours, 10% of the drug is in the blood stream.
C) After 10 hours, there are almost 100 units of the drug in the blood stream.
D) After 10 hours, the drug has almost completely dissipated.
E) After 10 hours, the drug is almost completely in the blood stream.
Unlock Deck
Unlock for access to all 109 flashcards in this deck.
Unlock Deck
k this deck
19
Use a calculator to evaluate the expression. Round your answer to two decimal places.
A) 20.09
B) 8.15
C) 19.81
D) 54.60
E) 16.31
A) 20.09
B) 8.15
C) 19.81
D) 54.60
E) 16.31
Unlock Deck
Unlock for access to all 109 flashcards in this deck.
Unlock Deck
k this deck
20
Graph the function.
A)
B)
C)
D)
E)
A)
B)
C)
D)
E)
Unlock Deck
Unlock for access to all 109 flashcards in this deck.
Unlock Deck
k this deck
21
Solve for x by writing the equation in exponential form. Round your answer two decimal places, if necessary.
A) 20
B) 1,024
C) 625
D) 54.60
E) 3,125
A) 20
B) 1,024
C) 625
D) 54.60
E) 3,125
Unlock Deck
Unlock for access to all 109 flashcards in this deck.
Unlock Deck
k this deck
22
Use properties of logarithms or a definition to simplify the expression.
If find .
A)
B)
C)
D)
E)
If
find .
A)
B)
C)
D)
E)
Unlock Deck
Unlock for access to all 109 flashcards in this deck.
Unlock Deck
k this deck
23
The following table gives the average number of students per computer in public schools for the school years that ended in 1985 through 2002. Let x be the number of years past 1980. Find an exponential model for these data. Round your answer to three decimal places.
Source: Quality Education Data, Inc., Denver, Colorado
A)
B)
C)
D)
E)
Source: Quality Education Data, Inc., Denver, Colorado
A)
B)
C)
D)
E)
Unlock Deck
Unlock for access to all 109 flashcards in this deck.
Unlock Deck
k this deck
24
Total personal income in the United States (in billions of dollars) for selected years from 1960 to 2002 is given in the following table.
Source: Bureau of Economic Analysis, U.S. Department of Commerce
These data can be modeled by an exponential function. Write the equation of this function, with x as the number of years past 1960. If this model is accurate, what will be the total U.S. personal income in 2010? Round your answer to two decimal places.
A) $13,899.68 billions
B) $15,216.17 billions
C) $17,199.23 billions
D) $18,464.37 billions
E) $20,698.13 billions
Unlock Deck
Unlock for access to all 109 flashcards in this deck.
Unlock Deck
k this deck
25
The consumer price index (CPI) is calculated by averaging the prices of various items after assigning a weight to each item. The following table gives the consumer price indexes for selected years from 1940 through 2002, reflecting buying patterns of all urban consumers, with x representing years past 1900. Find an equation that models these data. If it's necessary, round your calculations to four decimal places.
Source: U.S. Bureau of the Census
A)
B)
C)
D)
E)
Source: U.S. Bureau of the Census
A)
B)
C)
D)
E)
Unlock Deck
Unlock for access to all 109 flashcards in this deck.
Unlock Deck
k this deck
26
Total personal income in the United States (in billions of dollars) for selected years from 1960 to 2002 is given in the following table.
Source: Bureau of Economic Analysis, U.S. Department of Commerce
These data can be modeled by an exponential function. Write the equation of this function, with x as the number of years past 1960. If it's necessary round your calculations to four decimal places.
A)
B)
C)
D)
E)
Source: Bureau of Economic Analysis, U.S. Department of Commerce
These data can be modeled by an exponential function. Write the equation of this function, with x as the number of years past 1960. If it's necessary round your calculations to four decimal places.
A)
B)
C)
D)
E)
Unlock Deck
Unlock for access to all 109 flashcards in this deck.
Unlock Deck
k this deck
27
Use properties of logarithms or a definition to simplify the expression.
If , find .
A)
B)
C)
D)
E)
If
, find .
A)
B)
C)
D)
E)
Unlock Deck
Unlock for access to all 109 flashcards in this deck.
Unlock Deck
k this deck
28
The consumer price index (CPI) is calculated by averaging the prices of various items after assigning a weight to each item. The following table gives the consumer price indexes for selected years from 1940 through 2002, reflecting buying patterns of all urban consumers. Find an equation that models these data and use it to determine when the consumer price index will pass 349.
Source: U.S. Bureau of the Census
A) The 2011 - 2012 year
B) The 2012 - 2013 year
C) The 2014 - 2015 year
D) The 2016 - 2017 year
E) The 2019 - 2020 year
Source: U.S. Bureau of the Census
A) The 2011 - 2012 year
B) The 2012 - 2013 year
C) The 2014 - 2015 year
D) The 2016 - 2017 year
E) The 2019 - 2020 year
Unlock Deck
Unlock for access to all 109 flashcards in this deck.
Unlock Deck
k this deck
29
Write the equation in logarithmic form.
A)
B)
C)
D)
E)
A)
B)
C)
D)
E)
Unlock Deck
Unlock for access to all 109 flashcards in this deck.
Unlock Deck
k this deck
30
Write the equation in logarithmic form.
A)
B)
C)
D)
E)
A)
B)
C)
D)
E)
Unlock Deck
Unlock for access to all 109 flashcards in this deck.
Unlock Deck
k this deck
31
The consumer price index (CPI) is calculated by averaging the prices of various items after assigning a weight to each item. The following table gives the consumer price indexes for selected years from 1940 through 2002, reflecting buying patterns of all urban consumers. Find an equation that models these data and use it to predict the consumer price index in 2015. Use the model to predict the consumer price index in 2015. Round your answer to two decimal places.
Source: U.S. Bureau of the Census
A) 76.47
B) 129.14
C) 169.33
D) 216.39
E) 326.77
Source: U.S. Bureau of the Census
A) 76.47
B) 129.14
C) 169.33
D) 216.39
E) 326.77
Unlock Deck
Unlock for access to all 109 flashcards in this deck.
Unlock Deck
k this deck
32
Use properties of logarithms or a definition to simplify the expression. Check the result with a change-of-base formula and a calculator.
A) 8
B) 1
C) 4
D) -1
E) no solution
A) 8
B) 1
C) 4
D) -1
E) no solution
Unlock Deck
Unlock for access to all 109 flashcards in this deck.
Unlock Deck
k this deck
33
The following table gives the average number of students per computer in public schools for the school years that ended in 1985 through 2002. Find an exponential model for these data. How many students per computer in public schools does this model predict for 2005? Round your answer to two decimal places.
A) 1.92
B) 2.42
C) 4.32
D) 3.42
E) 4.92
A) 1.92
B) 2.42
C) 4.32
D) 3.42
E) 4.92
Unlock Deck
Unlock for access to all 109 flashcards in this deck.
Unlock Deck
k this deck
34
Use properties of logarithms or a definition to simplify the expression. Check the result with a change-of-base formula and a calculator. Round your answer two decimal places.
A) 20.09
B) 4.00
C) 64.00
D) 243.00
E) no solution
A) 20.09
B) 4.00
C) 64.00
D) 243.00
E) no solution
Unlock Deck
Unlock for access to all 109 flashcards in this deck.
Unlock Deck
k this deck
35
Graph the function.
A)
B)
C)
D)
E)
A)
B)
C)
D)
E)
Unlock Deck
Unlock for access to all 109 flashcards in this deck.
Unlock Deck
k this deck
36
Write the equation in exponential form.
A)
B)
C)
D)
E)
A)
B)
C)
D)
E)
Unlock Deck
Unlock for access to all 109 flashcards in this deck.
Unlock Deck
k this deck
37
Graph the function.
A)
B)
C)
D)
E)
A)
B)
C)
D)
E)
Unlock Deck
Unlock for access to all 109 flashcards in this deck.
Unlock Deck
k this deck
38
Write the equation in exponential form.
A)
B)
C)
D)
E)
A)
B)
C)
D)
E)
Unlock Deck
Unlock for access to all 109 flashcards in this deck.
Unlock Deck
k this deck
39
Solve for x by writing the equation in exponential form.
A)
B)
C) 124
D) 5
E) 45
A)
B)
C) 124
D) 5
E) 45
Unlock Deck
Unlock for access to all 109 flashcards in this deck.
Unlock Deck
k this deck
40
Solve for x by writing the equation in exponential form. Round your answer to two decimal places, if necessary.
A)
B)
C)
D)
E)
A)
B)
C)
D)
E)
Unlock Deck
Unlock for access to all 109 flashcards in this deck.
Unlock Deck
k this deck
41
Use a change-of-base formula to rewrite the logarithm in terms of natural logarithms.
A)
B)
C)
D)
E)
A)
B)
C)
D)
E)
Unlock Deck
Unlock for access to all 109 flashcards in this deck.
Unlock Deck
k this deck
42
Use the formula .
The San Francisco earthquake of 1906 measured 8.25 on the Richter scale, and the San Francisco earthquake of 1989 measured 7.1. How much more intense was the 1906 quake?
A) 0.3 times as severe.
B) 1.5 times as severe
C) 5.7 times as severe
D) 10.8 times as severe
E) 14.1 times as severe
. The San Francisco earthquake of 1906 measured 8.25 on the Richter scale, and the San Francisco earthquake of 1989 measured 7.1. How much more intense was the 1906 quake?
A) 0.3 times as severe.
B) 1.5 times as severe
C) 5.7 times as severe
D) 10.8 times as severe
E) 14.1 times as severe
Unlock Deck
Unlock for access to all 109 flashcards in this deck.
Unlock Deck
k this deck
43
Use the properties of logarithms to write the expression as a single logarithm.
A)
B)
C)
D)
E)
A)
B)
C)
D)
E)
Unlock Deck
Unlock for access to all 109 flashcards in this deck.
Unlock Deck
k this deck
44
Given , use a graphing calculator to graph for and .
A)
B)
C)
D)
E)
, use a graphing calculator to graph for and . A)
B)
C)
D)
E)
Unlock Deck
Unlock for access to all 109 flashcards in this deck.
Unlock Deck
k this deck
45
Use properties of logarithms or a definition to simplify the expression.
If , find .
A) 5
B) 10
C)
D) 100,000
E) 50
If
, find .
A) 5
B) 10
C)
D) 100,000
E) 50
Unlock Deck
Unlock for access to all 109 flashcards in this deck.
Unlock Deck
k this deck
46
Use a calculator to determine whether expression (a) is equivalent to expression (b).
A) equivalent
B) not equivalent
A) equivalent
B) not equivalent
Unlock Deck
Unlock for access to all 109 flashcards in this deck.
Unlock Deck
k this deck
47
Use the following information. Chemists use the pH (hydrogen potential) of a solution to measure its acidity or basicity. The pH is given by the formula , where is the concentration of hydrogen ions in moles per liter. What value of is associated with pH level 12?
A)
B)
C)
D)
E)
, where is the concentration of hydrogen ions in moles per liter. What value of is associated with pH level 12? A)
B)
C)
D)
E)
Unlock Deck
Unlock for access to all 109 flashcards in this deck.
Unlock Deck
k this deck
48
Evaluate the logarithm by using properties of logarithms and the following facts. Round your answer two decimal places.
A) 1.48
B) 1.10
C) 4.40
D) 1.45
E) 0.67
A) 1.48
B) 1.10
C) 4.40
D) 1.45
E) 0.67
Unlock Deck
Unlock for access to all 109 flashcards in this deck.
Unlock Deck
k this deck
49
Evaluate the logarithm by using properties of logarithms and the following facts. Round your answer to two decimal places.
A) 1.15
B) 8.37
C) 1.14
D) 0.40
E) 5.80
A) 1.15
B) 8.37
C) 1.14
D) 0.40
E) 5.80
Unlock Deck
Unlock for access to all 109 flashcards in this deck.
Unlock Deck
k this deck
50
Evaluate the logarithm by using properties of logarithms and the following fact. Round your answer two decimal places.
A) 10.40
B) 1.91
C) 4.60
D) 6.76
E) 5.20
A) 10.40
B) 1.91
C) 4.60
D) 6.76
E) 5.20
Unlock Deck
Unlock for access to all 109 flashcards in this deck.
Unlock Deck
k this deck
51
Use a calculator to determine whether expression (a) is equivalent to expression (b).
A) equivalent
B) not equivalent
A) equivalent
B) not equivalent
Unlock Deck
Unlock for access to all 109 flashcards in this deck.
Unlock Deck
k this deck
52
Use the fact that the loudness of sound (in decibels) perceived by the human ear depends on intensity levels according to , where is the threshold of hearing for the average human ear. Find the loudness when I is 1,000 times .
A) 3
B) 30
C) 4
D) 300
E) 100
, where is the threshold of hearing for the average human ear. Find the loudness when I is 1,000 times . A) 3
B) 30
C) 4
D) 300
E) 100
Unlock Deck
Unlock for access to all 109 flashcards in this deck.
Unlock Deck
k this deck
53
Find an equivalent expression for the given logarithm using the change-of-base formula.
A)
B)
C)
D)
E)
A)
B)
C)
D)
E)
Unlock Deck
Unlock for access to all 109 flashcards in this deck.
Unlock Deck
k this deck
54
Evaluate the logarithm by using properties of logarithms and the following facts. Round your answer two decimal places.
A) 7.70
B) 14.82
C) 0.10
D) 1.82
E) 1.03
A) 7.70
B) 14.82
C) 0.10
D) 1.82
E) 1.03
Unlock Deck
Unlock for access to all 109 flashcards in this deck.
Unlock Deck
k this deck
55
Write the expression as the sum or difference of two logarithmic functions containing no exponents.
A)
B)
C)
D)
E)
A)
B)
C)
D)
E)
Unlock Deck
Unlock for access to all 109 flashcards in this deck.
Unlock Deck
k this deck
56
Use the formula .
In October 2004, an earthquake measuring 6.8 on the Richter scale occurred in Japan. The largest quake in Japan since 1990 was one in 1993 that registered 7.7. How many times more severe was the 1993 shock than the one in 2004 on the Richter scale? Round your answer to one decimal place.
A) 0.7 times as severe
B) 1.9 times as severe
C) 7.9 times as severe
D) 9.3 times as severe
E) 19.1 times as severe
. In October 2004, an earthquake measuring 6.8 on the Richter scale occurred in Japan. The largest quake in Japan since 1990 was one in 1993 that registered 7.7. How many times more severe was the 1993 shock than the one in 2004 on the Richter scale? Round your answer to one decimal place.
A) 0.7 times as severe
B) 1.9 times as severe
C) 7.9 times as severe
D) 9.3 times as severe
E) 19.1 times as severe
Unlock Deck
Unlock for access to all 109 flashcards in this deck.
Unlock Deck
k this deck
57
Write the expression as the sum or difference of two logarithmic functions containing no exponents.
A)
B)
C)
D)
E)
A)
B)
C)
D)
E)
Unlock Deck
Unlock for access to all 109 flashcards in this deck.
Unlock Deck
k this deck
58
Which answer choice is a graph of the function?
A)
B)
C)
D)
E)
A)
B)
C)
D)
E)
Unlock Deck
Unlock for access to all 109 flashcards in this deck.
Unlock Deck
k this deck
59
Use a change-of-base formula to evaluate with a calculator or other technology. Round your answer to four decimal places.
A) 0.3801
B) 3.1754
C) 2.6309
D) 3.9890
E) 3.0445
with a calculator or other technology. Round your answer to four decimal places. A) 0.3801
B) 3.1754
C) 2.6309
D) 3.9890
E) 3.0445
Unlock Deck
Unlock for access to all 109 flashcards in this deck.
Unlock Deck
k this deck
60
Use the properties of logarithms to write the expression as a single logarithm.
A)
B)
C)
D)
E)
A)
B)
C)
D)
E)
Unlock Deck
Unlock for access to all 109 flashcards in this deck.
Unlock Deck
k this deck
61
The monthly sales S for a product is given by , where x is the number of months that have passed since the end of a promotional campaign. How many months after the end of the campaign will sales drop below 6,000, if no new campaign is initiated? Round to two decimal places.
A) 2.65 months
B) 4.32 months
C) 5.12 months
D) 6.16 months
E) 7.36 months
, where x is the number of months that have passed since the end of a promotional campaign. How many months after the end of the campaign will sales drop below 6,000, if no new campaign is initiated? Round to two decimal places. A) 2.65 months
B) 4.32 months
C) 5.12 months
D) 6.16 months
E) 7.36 months
Unlock Deck
Unlock for access to all 109 flashcards in this deck.
Unlock Deck
k this deck
62
Solve the exponential equation. Round your answer to three decimal places, if necessary.
A) 125
B) 0.667
C) 0.861
D) 0.408
E) 63
A) 125
B) 0.667
C) 0.861
D) 0.408
E) 63
Unlock Deck
Unlock for access to all 109 flashcards in this deck.
Unlock Deck
k this deck
63
The purchasing power P (in dollars) of an annual amount of A dollars after t years of 4% inflation decays according to . How long will it be before a pension of $60,000 per year has a purchasing power of $30,000? Round your answer to one decimal place.
A) 1.0 year
B) 9.7 years
C) 15.8 years
D) 35.7 years
E) 17.3 years
. How long will it be before a pension of $60,000 per year has a purchasing power of $30,000? Round your answer to one decimal place. A) 1.0 year
B) 9.7 years
C) 15.8 years
D) 35.7 years
E) 17.3 years
Unlock Deck
Unlock for access to all 109 flashcards in this deck.
Unlock Deck
k this deck
64
Solve the exponential equation. Give the answer correct to 3 decimal places.
A) 0.802
B) 1.605
C) 2.493
D) 0.936
E) 3.744
A) 0.802
B) 1.605
C) 2.493
D) 0.936
E) 3.744
Unlock Deck
Unlock for access to all 109 flashcards in this deck.
Unlock Deck
k this deck
65
Solve the exponential equation. Give answers correct to 3 decimal places.
A) 1.159
B) 0.093
C) 10.714
D) -0.093
E) -0.424
A) 1.159
B) 0.093
C) 10.714
D) -0.093
E) -0.424
Unlock Deck
Unlock for access to all 109 flashcards in this deck.
Unlock Deck
k this deck
66
Solve the logarithmic equation . Round your answer to three decimal places.
A)
B)
C)
D)
E)
. Round your answer to three decimal places. A)
B)
C)
D)
E)
Unlock Deck
Unlock for access to all 109 flashcards in this deck.
Unlock Deck
k this deck
67
An initial amount of 300 g of the radioactive isotope thorium-234 decays according to , where t is in years. How long does it take for half of the initial amount to disintegrate? This time is called the half-life of this isotope. Round your answer to one decimal place.
A) 240.5 years
B) 170.7 years
C) 24.5 years
D) 27.5 years
E) 245.1 years
, where t is in years. How long does it take for half of the initial amount to disintegrate? This time is called the half-life of this isotope. Round your answer to one decimal place. A) 240.5 years
B) 170.7 years
C) 24.5 years
D) 27.5 years
E) 245.1 years
Unlock Deck
Unlock for access to all 109 flashcards in this deck.
Unlock Deck
k this deck
68
Solve the exponential equation. Give the answer correct to 3 decimal places.
A) -0.545
B) 9.639
C) 6.053
D) -9.639
E) -3.896
A) -0.545
B) 9.639
C) 6.053
D) -9.639
E) -3.896
Unlock Deck
Unlock for access to all 109 flashcards in this deck.
Unlock Deck
k this deck
69
Solve the exponential equation. Give the answer correct to 3 decimal places.
A) -2.258
B) -0.523
C) 2.516
D) -0.503
E) 11.291
A) -2.258
B) -0.523
C) 2.516
D) -0.503
E) 11.291
Unlock Deck
Unlock for access to all 109 flashcards in this deck.
Unlock Deck
k this deck
70
The purchasing power P (in dollars) of an annual amount of A dollars after t years of 4% inflation decays according to . Determine how large a pension A needs to be so that the purchasing power P is $70,000 after 25 years? Round your answer to the nearest dollar.
A) $260,683
B) $190,280
C) $115,410
D) $156,191
E) $95,141
. Determine how large a pension A needs to be so that the purchasing power P is $70,000 after 25 years? Round your answer to the nearest dollar. A) $260,683
B) $190,280
C) $115,410
D) $156,191
E) $95,141
Unlock Deck
Unlock for access to all 109 flashcards in this deck.
Unlock Deck
k this deck
71
For selected years from 1960 to 2001, the national health care expenditures H, in billions of dollars, can be modeled by , where t is the number of years past 1960 (Source: U.S. Department of Health and Human Services). If this model remains accurate, in what year will national health care expenditures reach $3 trillion (that is, $3000 billion)? Round your answer to the nearest year.
A) in the year 2008
B) in the year 2018
C) in the year 2013
D) in the year 2011
E) in the year 2009
, where t is the number of years past 1960 (Source: U.S. Department of Health and Human Services). If this model remains accurate, in what year will national health care expenditures reach $3 trillion (that is, $3000 billion)? Round your answer to the nearest year. A) in the year 2008
B) in the year 2018
C) in the year 2013
D) in the year 2011
E) in the year 2009
Unlock Deck
Unlock for access to all 109 flashcards in this deck.
Unlock Deck
k this deck
72
The monthly sales S for a product is given by , where x is the number of months that have passed since the end of a promotional campaign. Determine the monthly sales 4 months after the promotional campaign. Round your answer to the nearest cent.
A) $36,243.76
B) $2,038.11
C) $38,296.42
D) $1,226,626.51
E) $65,280.26
, where x is the number of months that have passed since the end of a promotional campaign. Determine the monthly sales 4 months after the promotional campaign. Round your answer to the nearest cent. A) $36,243.76
B) $2,038.11
C) $38,296.42
D) $1,226,626.51
E) $65,280.26
Unlock Deck
Unlock for access to all 109 flashcards in this deck.
Unlock Deck
k this deck
73
Solve the logarithmic equation . Round your answer to three decimal places.
A)
B)
C)
D)
E)
. Round your answer to three decimal places. A)
B)
C)
D)
E)
Unlock Deck
Unlock for access to all 109 flashcards in this deck.
Unlock Deck
k this deck
74
Between the years 1960 and 2002, the percent of women in the work force is given by , where x is the number of years past 1950 (Source: U.S. Bureau of Labor Statistics). What does this model estimate to be the percent of women in the work force in 2019? Round your answer to two decimal places.
A) 64.24
B) 61.69
C) 66.61
D) 75.71
E) 51.70
, where x is the number of years past 1950 (Source: U.S. Bureau of Labor Statistics). What does this model estimate to be the percent of women in the work force in 2019? Round your answer to two decimal places. A) 64.24
B) 61.69
C) 66.61
D) 75.71
E) 51.70
Unlock Deck
Unlock for access to all 109 flashcards in this deck.
Unlock Deck
k this deck
75
Solve the logarithmic equation .
A)
B)
C)
D)
E)
. A)
B)
C)
D)
E)
Unlock Deck
Unlock for access to all 109 flashcards in this deck.
Unlock Deck
k this deck
76
The population y of a certain country was 100,000 in 1990 and 149,182 in 2000. Assume the formula applies to the growth of the country's population. Estimate the population of the country in 2010. Round your answer to the nearest human.
A) 149,182
B) 332,012
C) 222,554
D) 67,032
E) 44,933
applies to the growth of the country's population. Estimate the population of the country in 2010. Round your answer to the nearest human. A) 149,182
B) 332,012
C) 222,554
D) 67,032
E) 44,933
Unlock Deck
Unlock for access to all 109 flashcards in this deck.
Unlock Deck
k this deck
77
Between the years 1960 and 2002, the percent of women in the work force is given by , where x is the number of years past 1950 (Source: U.S. Bureau of Labor Statistics). Graph this function with a graphing utility and use the graph drawn to estimate the year in which the percent reached 50. Round your answer to the nearest year.
A) 1964
B) 1970
C) 1976
D) 1984
E) 1989
, where x is the number of years past 1950 (Source: U.S. Bureau of Labor Statistics). Graph this function with a graphing utility and use the graph drawn to estimate the year in which the percent reached 50. Round your answer to the nearest year. A) 1964
B) 1970
C) 1976
D) 1984
E) 1989
Unlock Deck
Unlock for access to all 109 flashcards in this deck.
Unlock Deck
k this deck
78
Use the formula to find the doubling time t, in years, for an investment at r% compounded n times per year. Suppose you make an investment of $1,300 at interest rate 11% compounded quarterly. How long will it take for your investment to double? Round your answer to two decimal places.
A) 2.13 years
B) 12.78 years
C) 3.19 years
D) 3.32 years
E) 6.39 years
to find the doubling time t, in years, for an investment at r% compounded n times per year. Suppose you make an investment of $1,300 at interest rate 11% compounded quarterly. How long will it take for your investment to double? Round your answer to two decimal places. A) 2.13 years
B) 12.78 years
C) 3.19 years
D) 3.32 years
E) 6.39 years
Unlock Deck
Unlock for access to all 109 flashcards in this deck.
Unlock Deck
k this deck
79
The demand function for a certain commodity is given by , where q is number of units. At what price per unit will the quantity demanded equal 6 units? Round your answer to the nearest cent.
A) $0.25
B) $0.40
C) $2.01
D) $4.98
E) $0.74
, where q is number of units. At what price per unit will the quantity demanded equal 6 units? Round your answer to the nearest cent. A) $0.25
B) $0.40
C) $2.01
D) $4.98
E) $0.74
Unlock Deck
Unlock for access to all 109 flashcards in this deck.
Unlock Deck
k this deck
80
The demand function for a certain commodity is given by , where q is number of units. If the price is $1.11 per unit, how many units will be demanded, to the nearest unit?
A) 9 units
B) 7 units
C) 11 units
D) 10 units
E) 12 units
, where q is number of units. If the price is $1.11 per unit, how many units will be demanded, to the nearest unit? A) 9 units
B) 7 units
C) 11 units
D) 10 units
E) 12 units
Unlock Deck
Unlock for access to all 109 flashcards in this deck.
Unlock Deck
k this deck
Unlock Deck
Unlock for access to all 109 flashcards in this deck.


