Deck 9: Regression
Full screen (f)
Question
Question
Question
A consumer researcher was interested in what factors influence people's fear responses to horror films. She measured gender (0 = female, 1 = male) and how much a person is prone to believe in things that are not real (fantasy proneness) on a scale from 0 to 4 (0 = not at all fantasy prone, 4 = very fantasy prone). Fear responses were measured on a scale from 0 (not at all scared) to 15 (the most scared I have ever felt). What is the likely population value of the parameter describing the relationship between gender and fear? 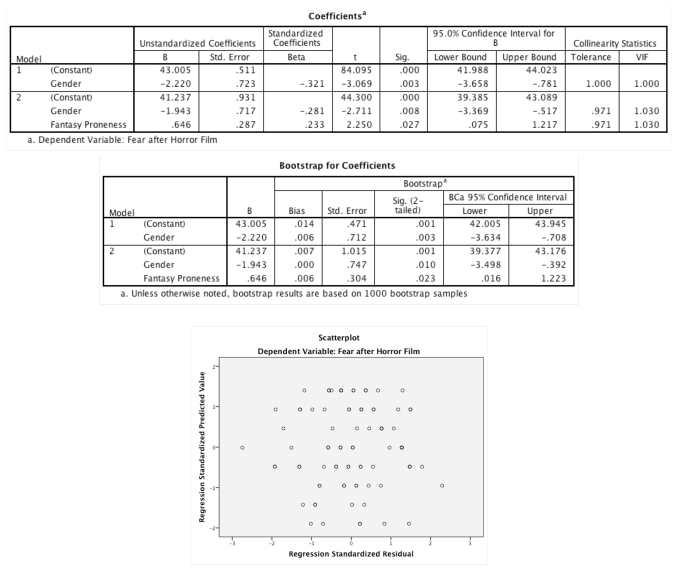
A)Somewhere between -3.498 and -0.392
B)Somewhere between -3.369 and -0.517
C)-1.943
D).008
A)Somewhere between -3.498 and -0.392
B)Somewhere between -3.369 and -0.517
C)-1.943
D).008
Question
Question
Recent research has shown that lecturers are among the most stressed workers. A researcher wanted to know exactly what it was about being a lecturer that created this stress and subsequent burnout. She recruited 75 lecturers and administered several questionnaires that measured: Burnout (high score = burnt out), Perceived Control (high score = low perceived control), Coping Ability (high score = low ability to cope with stress), Stress from Teaching (high score = teaching creates a lot of stress for the person), Stress from Research (high score = research creates a lot of stress for the person), and Stress from Providing Pastoral Care (high score = providing pastoral care creates a lot of stress for the person). The outcome of interest was burnout, and Cooper's (1988) model of stress indicates that perceived control and coping style are important predictors of this variable. The remaining predictors were measured to see the unique contribution of different aspects of a lecturer's work to their burnout. What analysis has been carried out?
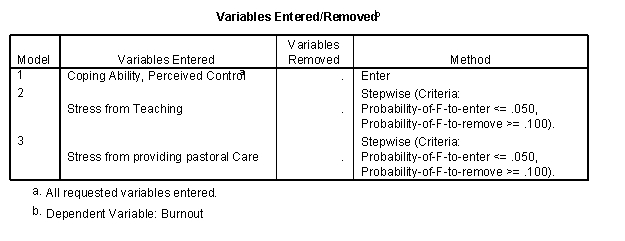
A)Multilevel model
B)Reliability analysis
C)Factor analysis
D)Hierarchical multiple regression
A)Multilevel model
B)Reliability analysis
C)Factor analysis
D)Hierarchical multiple regression
Question
Question
Question
Question
A psychologist was interested in whether the amount of news people watch (minutes per day) predicts how depressed they are (from 0 = not depressed to 7 = very depressed). What does the standardized beta tell us in the output? 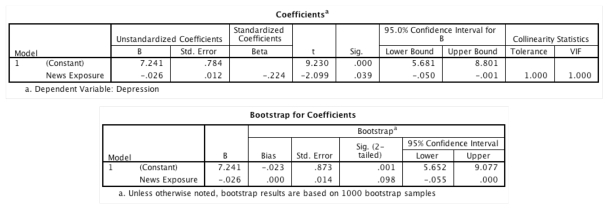
A)As news exposure decreases by 0.224 standard deviations, depression increases by 1 standard deviation.
B)As news exposure increases by 1 standard deviation, depression decreases by 0.224 of a standard deviation.
C)As news exposure increases by 1 minute, depression decreases by 0.224 units.d.Your fourth answer option goes here.
D)As news exposure decreases by 0.224 minutes, depression increases by 1 unit.
Question
What does the graph below show? 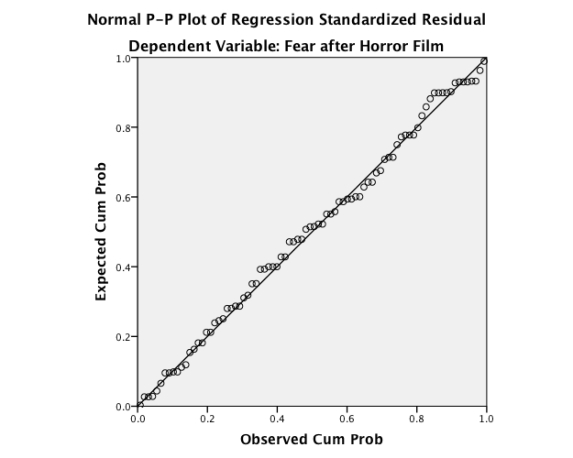
A)Linearity
B)Homoscedasticity
C)Multicollinearity
D)Normality of residuals
A)Linearity
B)Homoscedasticity
C)Multicollinearity
D)Normality of residuals
Question
A psychologist was interested in whether the amount of news people watch predicts how depressed they are. Based on the output, is news exposure a significant predictor of depression? 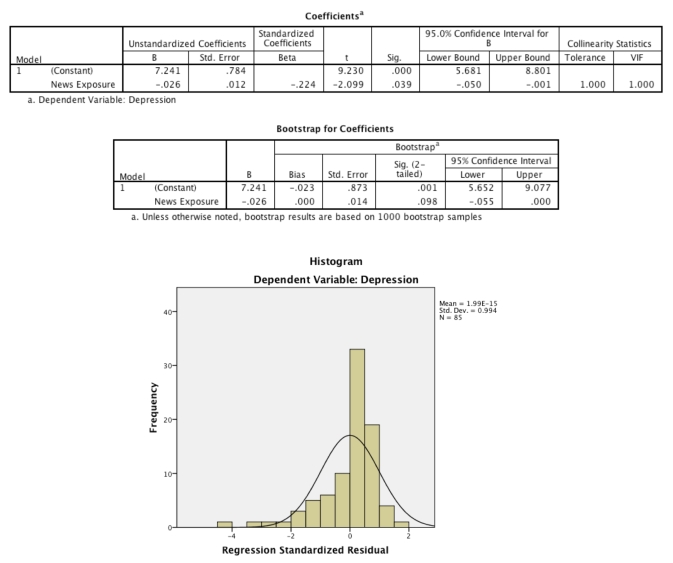
A)No, because the bootstrap significance value of news exposure is greater than .05.
B)Yes, because the p-value for news exposure is .039, which is less than .05.
C)Yes, because the bootstrapped confidence interval for news exposure contains zero.
D)No, because the confidence interval for news exposure does not contain zero.
Question
Question
The following graph shows: 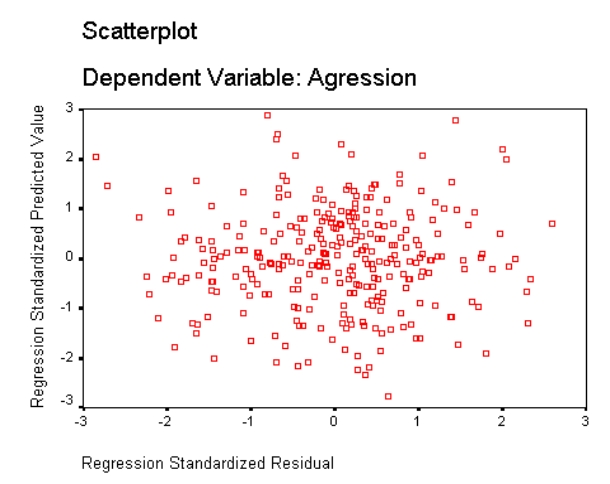
A)Heteroscedasticity.
B)Regression assumptions that have been met
C)Non-linearity
D)Heteroscedasticity and non-linearity
A)Heteroscedasticity.
B)Regression assumptions that have been met
C)Non-linearity
D)Heteroscedasticity and non-linearity
Question
A psychologist was interested in predicting how depressed people are from the amount of news they watch. Based on the output, do you think the psychologist will end up with a model that can be generalized beyond the sample? 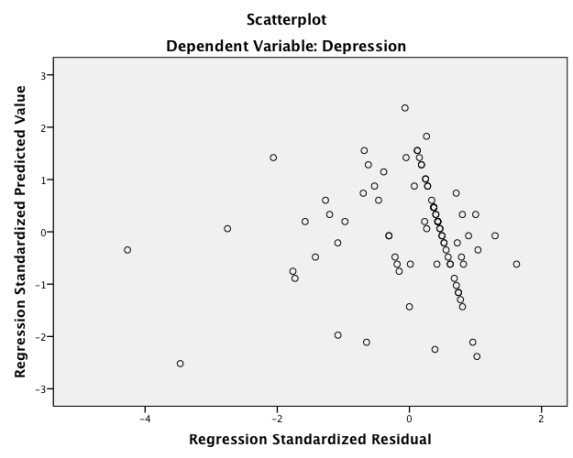
A)No, because the errors lack linearity.
B)Yes, because errors are normally distributed
C)Yes, because errors are independent.
D)No, because the errors show heteroscedasticity
A)No, because the errors lack linearity.
B)Yes, because errors are normally distributed
C)Yes, because errors are independent.
D)No, because the errors show heteroscedasticity
Question
Recent research has shown that lecturers are among the most stressed workers. A researcher wanted to know exactly what it was about being a lecturer that created this stress and subsequent burnout. She recruited 75 lecturers and administered several questionnaires that measured: Burnout (high score = burnt out), Perceived Control (high score = low perceived control), Coping Ability (high score = low ability to cope with stress), Stress from Teaching (high score = teaching creates a lot of stress for the person), Stress from Research (high score = research creates a lot of stress for the person), and Stress from Providing Pastoral Care (high score = providing pastoral care creates a lot of stress for the person). The outcome of interest was burnout, and Cooper's (1988) model of stress indicates that perceived control and coping style are important predictors of this variable. The remaining predictors were measured to see the unique contribution of different aspects of a lecturer's work to their burnout.
-Which of the predictor variables does not predict burnout?

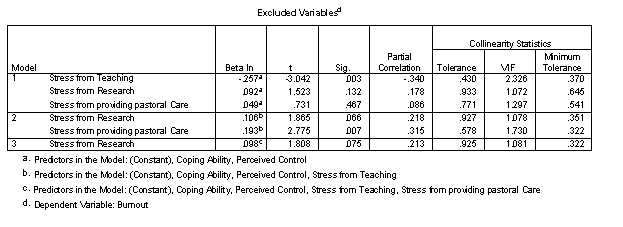
A)Stress from research
B)Perceived control
C)Stress from teaching
D)Stress from providing pastoral care
-Which of the predictor variables does not predict burnout?
A)Stress from research
B)Perceived control
C)Stress from teaching
D)Stress from providing pastoral care
Question
A psychologist was interested in whether the amount of news people watch predicts how depressed they are. Based on the output below, is there evidence that a meaningful relationship exists in the population? 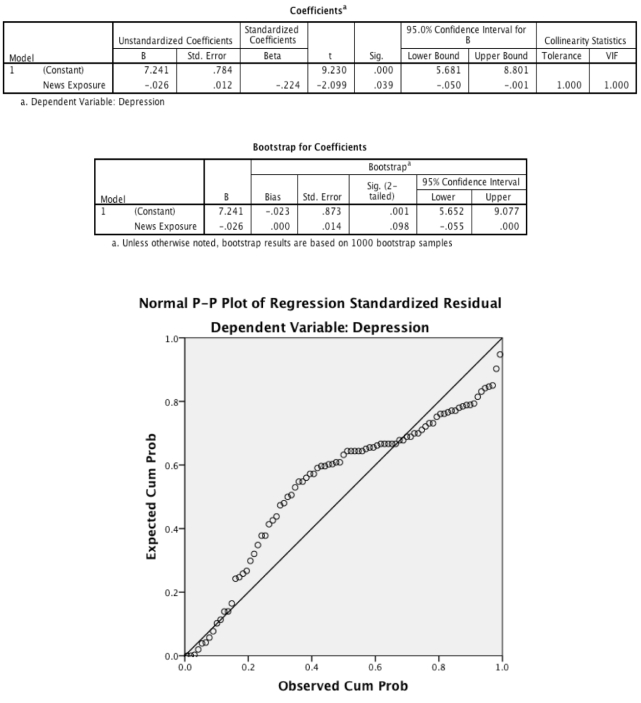
A)Yes, because the p-value for news exposure is .039, which is less than .05.
B)Yes, because the confidence interval for news exposure does not contains zero.
C)No, because the b-value for news exposure is close to zero
D)No, because the confidence interval for news exposure does not contain zero.
A)Yes, because the p-value for news exposure is .039, which is less than .05.
B)Yes, because the confidence interval for news exposure does not contains zero.
C)No, because the b-value for news exposure is close to zero
D)No, because the confidence interval for news exposure does not contain zero.
Question
Question
Question
Question
A consumer researcher was interested in what factors influence people's fear responses to horror films. She measured gender (0 = female, 1 = male) and how much a person is prone to believe in things that are not real (fantasy proneness) on a scale from 0 to 4 (0 = not at all fantasy prone, 4 = very fantasy prone). Fear responses were measured on a scale from 0 (not at all scared) to 15 (the most scared I have ever felt). How much variance (as a percentage) in fear is shared by gender and fantasy proneness in the population? 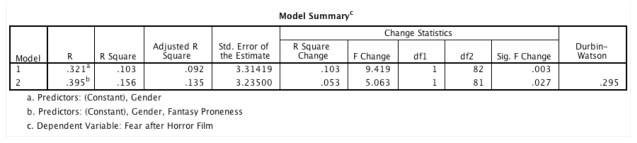
A)15.6%
B)13.5%
C)39.5%
D)7.4%
A)15.6%
B)13.5%
C)39.5%
D)7.4%
Question
Question
Question
Question
Question
Question
Question
Question
Recent research has shown that lecturers are among the most stressed workers. A researcher wanted to know exactly what it was about being a lecturer that created this stress and subsequent burnout. She recruited 75 lecturers and administered several questionnaires that measured: Burnout (high score = burnt out), Perceived Control (high score = low perceived control), Coping Ability (high score = low ability to cope with stress), Stress from Teaching (high score = teaching creates a lot of stress for the person), Stress from Research (high score = research creates a lot of stress for the person), and Stress from Providing Pastoral Care (high score = providing pastoral care creates a lot of stress for the person). The outcome of interest was burnout, and Cooper's (1988) model of stress indicates that perceived control and coping style are important predictors of this variable. The remaining predictors were measured to see the unique contribution of different aspects of a lecturer's work to their burnout.
-How would you interpret the beta value for 'stress from teaching'?
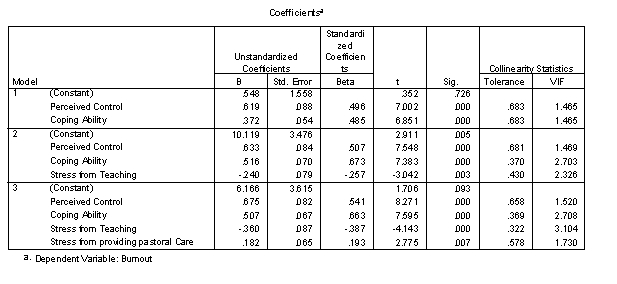
A)People with burnout are 36% more likely to be stressed when they teach.
B)As stress from teaching increases by a unit, burnout decreases by 0.36 of a unit.Therefore, stress from teaching protects against burnout.
C)As stress from teaching increases by 0.36 of a standard deviation, burnout also increases by 0.36 of a standard deviation.
D)As stress from teaching increases by a unit, burnout decreases by 0.36 of a unit.Therefore, stress from teaching protects against burnout
-How would you interpret the beta value for 'stress from teaching'?
A)People with burnout are 36% more likely to be stressed when they teach.
B)As stress from teaching increases by a unit, burnout decreases by 0.36 of a unit.Therefore, stress from teaching protects against burnout.
C)As stress from teaching increases by 0.36 of a standard deviation, burnout also increases by 0.36 of a standard deviation.
D)As stress from teaching increases by a unit, burnout decreases by 0.36 of a unit.Therefore, stress from teaching protects against burnout
Question
Question
Question
Question
Recent research has shown that lecturers are among the most stressed workers. A researcher wanted to know exactly what it was about being a lecturer that created this stress and subsequent burnout. She recruited 75 lecturers and administered several questionnaires that measured: Burnout (high score = burnt out), Perceived Control (high score = low perceived control), Coping Ability (high score = low ability to cope with stress), Stress from Teaching (high score = teaching creates a lot of stress for the person), Stress from Research (high score = research creates a lot of stress for the person), and Stress from Providing Pastoral Care (high score = providing pastoral care creates a lot of stress for the person). The outcome of interest was burnout, and Cooper's (1988) model of stress indicates that perceived control and coping style are important predictors of this variable. The remaining predictors were measured to see the unique contribution of different aspects of a lecturer's work to their burnout.
-What does the scatterplot show?
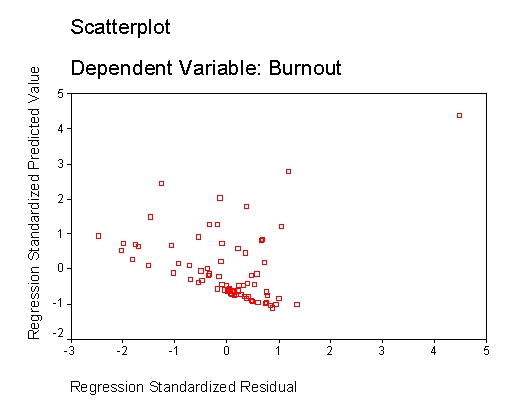
A)Homoscedasticity of errors
B)Independence of errors and homoscedasticity
C)Heteroscedasticity of errors
D)Normality of errors
-What does the scatterplot show?
A)Homoscedasticity of errors
B)Independence of errors and homoscedasticity
C)Heteroscedasticity of errors
D)Normality of errors
Question

Unlock Deck
Sign up to unlock the cards in this deck!
Unlock Deck
Unlock Deck
1/33
Play
Full screen (f)
Deck 9: Regression
1
R2 is:
A)The percentage of variance in the predictor accounted for by the outcome variable.
B)The proportion of variance in the predictor accounted for by the outcome variable.
C)The proportion of variance in the outcome accounted for by the predictor variable or variables
D)The percentage of variance in the outcome accounted for by the predictor variable or variables.
C
2
What is multicollinearity?
A)When predictor variables correlate very highly with each other
B)When predictor variables have a linear relationship with the outcome variable
C)When predictor variables are correlated with variables not in the regression model
D)When predictor variables are independent
A)When predictor variables correlate very highly with each other
B)When predictor variables have a linear relationship with the outcome variable
C)When predictor variables are correlated with variables not in the regression model
D)When predictor variables are independent
A
3
A consumer researcher was interested in what factors influence people's fear responses to horror films. She measured gender (0 = female, 1 = male) and how much a person is prone to believe in things that are not real (fantasy proneness) on a scale from 0 to 4 (0 = not at all fantasy prone, 4 = very fantasy prone). Fear responses were measured on a scale from 0 (not at all scared) to 15 (the most scared I have ever felt). What is the likely population value of the parameter describing the relationship between gender and fear?
A)Somewhere between -3.498 and -0.392
B)Somewhere between -3.369 and -0.517
C)-1.943
D).008
A)Somewhere between -3.498 and -0.392
B)Somewhere between -3.369 and -0.517
C)-1.943
D).008
Somewhere between -3.369 and -0.517
4
A psychologist was interested in whether the amount of news people watch predicts how depressed they are. In this table, what does the value 4.404 represent? ANOVA
a. Dependent Variable: Depression
b. Predictors: (Constant), News Exposure
A)The ratio of how much the prediction of depression has improved by fitting the model, compared to how much variability there is in depression scores
B)The ratio of how much error there is in the model, compared to how much variability there is in depression scores.
C)The ratio of how much the prediction of depression has improved by fitting the model, compared to how much variability there is in depression scores,
D)The ratio of how much the prediction of depression has improved by fitting the model, compared to how much error still remains
Unlock Deck
Unlock for access to all 33 flashcards in this deck.
Unlock Deck
k this deck
5
Recent research has shown that lecturers are among the most stressed workers. A researcher wanted to know exactly what it was about being a lecturer that created this stress and subsequent burnout. She recruited 75 lecturers and administered several questionnaires that measured: Burnout (high score = burnt out), Perceived Control (high score = low perceived control), Coping Ability (high score = low ability to cope with stress), Stress from Teaching (high score = teaching creates a lot of stress for the person), Stress from Research (high score = research creates a lot of stress for the person), and Stress from Providing Pastoral Care (high score = providing pastoral care creates a lot of stress for the person). The outcome of interest was burnout, and Cooper's (1988) model of stress indicates that perceived control and coping style are important predictors of this variable. The remaining predictors were measured to see the unique contribution of different aspects of a lecturer's work to their burnout. What analysis has been carried out?
A)Multilevel model
B)Reliability analysis
C)Factor analysis
D)Hierarchical multiple regression
A)Multilevel model
B)Reliability analysis
C)Factor analysis
D)Hierarchical multiple regression
Unlock Deck
Unlock for access to all 33 flashcards in this deck.
Unlock Deck
k this deck
6
A psychologist was interested in whether the amount of news people watch predicts how depressed they are. In this table, what does the value 3.030 represent? ANOVA
a. Dependent Variable: Depression
b. Predictors: (Constant), News Exposure
A)The improvement in the prediction of depression by fitting the model
B)The ratio of how much the prediction of depression has improved by fitting the model, compared to how much error still remains
C)The ratio of how much error there is in the model, compared to how much variability there is in depression scores
D)The proportion of variance in depression explained by news exposure
Unlock Deck
Unlock for access to all 33 flashcards in this deck.
Unlock Deck
k this deck
7
Which of the following statements about the t-statistic in regression is not true?
A)The t-statistic tests whether the regression coefficient, b, is equal to 0.
B)The t-statistic is equal to the regression coefficient divided by its standard deviation.
C)The t-statistic provides some idea of how well a predictor predicts the outcome variable.
D)The t-statistic can be used to see whether a predictor variables makes a statistically significant contribution to the regression model.
Unlock Deck
Unlock for access to all 33 flashcards in this deck.
Unlock Deck
k this deck
8
Which of the following statements about the F-ratio is true?
A)The F-ratio is the ratio of error variance to the total variance.
B)The F-ratio is the ratio of variance explained by the model to the error in the model.
C)The F-ratio is the ratio of variance explained by the model to the total variance in the outcome variable.
D)The F-ratio is the proportion of variance explained by the regression model.
Unlock Deck
Unlock for access to all 33 flashcards in this deck.
Unlock Deck
k this deck
9
A psychologist was interested in whether the amount of news people watch (minutes per day) predicts how depressed they are (from 0 = not depressed to 7 = very depressed). What does the standardized beta tell us in the output?
A)As news exposure decreases by 0.224 standard deviations, depression increases by 1 standard deviation.
B)As news exposure increases by 1 standard deviation, depression decreases by 0.224 of a standard deviation.
C)As news exposure increases by 1 minute, depression decreases by 0.224 units.d.Your fourth answer option goes here.
D)As news exposure decreases by 0.224 minutes, depression increases by 1 unit.
Unlock Deck
Unlock for access to all 33 flashcards in this deck.
Unlock Deck
k this deck
10
What does the graph below show?
A)Linearity
B)Homoscedasticity
C)Multicollinearity
D)Normality of residuals
A)Linearity
B)Homoscedasticity
C)Multicollinearity
D)Normality of residuals
Unlock Deck
Unlock for access to all 33 flashcards in this deck.
Unlock Deck
k this deck
11
A psychologist was interested in whether the amount of news people watch predicts how depressed they are. Based on the output, is news exposure a significant predictor of depression?
A)No, because the bootstrap significance value of news exposure is greater than .05.
B)Yes, because the p-value for news exposure is .039, which is less than .05.
C)Yes, because the bootstrapped confidence interval for news exposure contains zero.
D)No, because the confidence interval for news exposure does not contain zero.
Unlock Deck
Unlock for access to all 33 flashcards in this deck.
Unlock Deck
k this deck
12
A consumer researcher was interested in what factors influence people's fear responses to horror films. She measured gender and how much a person is prone to believe in things that are not real (fantasy proneness). Fear responses were measured too. In this table, what does the value 847.685 represent? ANOVA
a. Dependent Variable: Fear after Horror Film
b. Predictors: (Constant), Gender
c. Predictors: (Constant), Gender, Fantasy Proneness
A)The improvement in prediction of fear resulting from including both gender and fantasy proneness as predictors in the model
B)The improvement in prediction of fear resulting from adding fantasy proneness to the model
C)The total error in predicting fear scores when both gender and fantasy proneness are included as predictors in the model
D)The reduction in the error in predicting fear scores when fantasy proneness is added to the model
Unlock Deck
Unlock for access to all 33 flashcards in this deck.
Unlock Deck
k this deck
13
The following graph shows:
A)Heteroscedasticity.
B)Regression assumptions that have been met
C)Non-linearity
D)Heteroscedasticity and non-linearity
A)Heteroscedasticity.
B)Regression assumptions that have been met
C)Non-linearity
D)Heteroscedasticity and non-linearity
Unlock Deck
Unlock for access to all 33 flashcards in this deck.
Unlock Deck
k this deck
14
A psychologist was interested in predicting how depressed people are from the amount of news they watch. Based on the output, do you think the psychologist will end up with a model that can be generalized beyond the sample?
A)No, because the errors lack linearity.
B)Yes, because errors are normally distributed
C)Yes, because errors are independent.
D)No, because the errors show heteroscedasticity
A)No, because the errors lack linearity.
B)Yes, because errors are normally distributed
C)Yes, because errors are independent.
D)No, because the errors show heteroscedasticity
Unlock Deck
Unlock for access to all 33 flashcards in this deck.
Unlock Deck
k this deck
15
Recent research has shown that lecturers are among the most stressed workers. A researcher wanted to know exactly what it was about being a lecturer that created this stress and subsequent burnout. She recruited 75 lecturers and administered several questionnaires that measured: Burnout (high score = burnt out), Perceived Control (high score = low perceived control), Coping Ability (high score = low ability to cope with stress), Stress from Teaching (high score = teaching creates a lot of stress for the person), Stress from Research (high score = research creates a lot of stress for the person), and Stress from Providing Pastoral Care (high score = providing pastoral care creates a lot of stress for the person). The outcome of interest was burnout, and Cooper's (1988) model of stress indicates that perceived control and coping style are important predictors of this variable. The remaining predictors were measured to see the unique contribution of different aspects of a lecturer's work to their burnout.
-Which of the predictor variables does not predict burnout?
A)Stress from research
B)Perceived control
C)Stress from teaching
D)Stress from providing pastoral care
-Which of the predictor variables does not predict burnout?
A)Stress from research
B)Perceived control
C)Stress from teaching
D)Stress from providing pastoral care
Unlock Deck
Unlock for access to all 33 flashcards in this deck.
Unlock Deck
k this deck
16
A psychologist was interested in whether the amount of news people watch predicts how depressed they are. Based on the output below, is there evidence that a meaningful relationship exists in the population?
A)Yes, because the p-value for news exposure is .039, which is less than .05.
B)Yes, because the confidence interval for news exposure does not contains zero.
C)No, because the b-value for news exposure is close to zero
D)No, because the confidence interval for news exposure does not contain zero.
A)Yes, because the p-value for news exposure is .039, which is less than .05.
B)Yes, because the confidence interval for news exposure does not contains zero.
C)No, because the b-value for news exposure is close to zero
D)No, because the confidence interval for news exposure does not contain zero.
Unlock Deck
Unlock for access to all 33 flashcards in this deck.
Unlock Deck
k this deck
17
Recent research has shown that lecturers are among the most stressed workers. A researcher wanted to know exactly what it was about being a lecturer that created this stress and subsequent burnout. She recruited 75 lecturers and administered several questionnaires that measured: Burnout (high score = burnt out), Perceived Control (high score = low perceived control), Coping Ability (high score = low ability to cope with stress), Stress from Teaching (high score = teaching creates a lot of stress for the person), Stress from Research (high score = research creates a lot of stress for the person), and Stress from Providing Pastoral Care (high score = providing pastoral care creates a lot of stress for the person). The outcome of interest was burnout, and Cooper's (1988) model of stress indicates that perceived control and coping style are important predictors of this variable. The remaining predictors were measured to see the unique contribution of different aspects of a lecturer's work to their burnout.
-Which of the predictor variables does not predict burnout?
A)Multilevel model
B)Reliability analysis
C)Factor analysis
D)Hierarchical multiple regression
-Which of the predictor variables does not predict burnout?
A)Multilevel model
B)Reliability analysis
C)Factor analysis
D)Hierarchical multiple regression
Unlock Deck
Unlock for access to all 33 flashcards in this deck.
Unlock Deck
k this deck
18
Which of these statements is not true?
A)If the average variance inflation factor is greater than 1 then the regression model might be biased.
B)Multicollinearity in the data is shown by a VIF (variance inflation factor) greater than 10.
C)Tolerance values above 0.2 may indicate multicollinearity in the data.
D)The tolerance is 1 divided by the VIF (variance inflation factor).
Unlock Deck
Unlock for access to all 33 flashcards in this deck.
Unlock Deck
k this deck
19
Which of the following is not a reason why multicollinearity a problem in regression?
A)It limits the size of R.
B)It makes it difficult to assess the importance of individual predictors.
C)When predictor variables are correlated with variables not in the regression model
D)It leads to unstable regression coefficients.
A)It limits the size of R.
B)It makes it difficult to assess the importance of individual predictors.
C)When predictor variables are correlated with variables not in the regression model
D)It leads to unstable regression coefficients.
Unlock Deck
Unlock for access to all 33 flashcards in this deck.
Unlock Deck
k this deck
20
A consumer researcher was interested in what factors influence people's fear responses to horror films. She measured gender (0 = female, 1 = male) and how much a person is prone to believe in things that are not real (fantasy proneness) on a scale from 0 to 4 (0 = not at all fantasy prone, 4 = very fantasy prone). Fear responses were measured on a scale from 0 (not at all scared) to 15 (the most scared I have ever felt). How much variance (as a percentage) in fear is shared by gender and fantasy proneness in the population?
A)15.6%
B)13.5%
C)39.5%
D)7.4%
A)15.6%
B)13.5%
C)39.5%
D)7.4%
Unlock Deck
Unlock for access to all 33 flashcards in this deck.
Unlock Deck
k this deck
21
A researcher was interested in examining what factors influenced children's scores in a fitness test. He ran a multiple linear regression, which included four predictors ('hours spent taking part in physical activity per day', 'calories consumed per day', 'BMI', and 'hours spent watching TV per day'). His model had a R2 of .665, an adjusted R2 of .661, an F-statistic of 112.56 (p 0.00). How would you interpret his findings
A)It is not a significant model.
B)It is a significant model where the four predictors account for 66% of the variance in the children's scores in the fitness test.
C)It is a significant model where the four predictors account for 112% of the variance in the children's scores in the fitness test.
D)It is an significant model where the four predictors account for 0.661 of the variance in the children's scores in the fitness test..
Unlock Deck
Unlock for access to all 33 flashcards in this deck.
Unlock Deck
k this deck
22
What is cross-validation?
A)It is the assessment of a model's level of errors across different samples, which is useful as it allows us to assess how many errors there might be in a model using different samples.
B)It is the comparison of your findings with the work of others, using the same data.
C)It is the use of theoretical literature to build your valid data model.
D)It is the assessment of a model's accuracy across different samples, which is useful as it allows us to assess how well our model might predict the outcome in different samples.
Unlock Deck
Unlock for access to all 33 flashcards in this deck.
Unlock Deck
k this deck
23
A medical researcher was interested in examining what factors influenced patient's scores in a fitness test. He ran a multiple linear regression, which included four predictors ('hours spent taking part in physical activity per day', 'calories consumed per day', 'BMI', and 'hours spent sitting per day'). His model had a R2 of .665, an adjusted R2 of .661, an F-statistic of 112.56 (p 0.00). How would you interpret his findings?
A)It is not a significant model.
B)It becomes difficult to assess the individual importance of predictors and it increases the standard errors of the b coefficients making them unreliable.
C)It is a significant model where the four predictors account for 112% of the variance in the patient's scores in the fitness test.
D)It is an significant model where the four predictors account for 0.661 of the variance in the patient's scores in the fitness test.
Unlock Deck
Unlock for access to all 33 flashcards in this deck.
Unlock Deck
k this deck
24
The head of retail sales at a large cosmetic company was interested in determining what the best marketing model was for launching a forthcoming new product to ensure high sales. She ran two separate simple linear regressions; the first used money spent on social media marketing as a predictor and the second had money spent on print media as a predictor. The model featuring social media marketing as a predictor had a R2 of .665, an adjusted R2 of .661, an F-statistic of 112.56 (p 0.00).
The model featuring print media marketing as a predictor had a R2 of .665, an adjusted R2 of .15, an F-statistic of 34 (p 0.00).
Which marketing model should she invest in, based on these findings, in order to generate predicted higher sales?
A)The model featuring print media marketing as a predictor is the better of the two models.
B)The model featuring social media marketing as a predictor is the better of the two models.
C)Neither model is effective.
D)The model featuring social media as a predictor is better but biased.
Unlock Deck
Unlock for access to all 33 flashcards in this deck.
Unlock Deck
k this deck
25
Which of the following is a means to cross-validate your model?
A)Adjusted R2.
B)F-statistic.
C)t-statistic.
D)R2.
A)Adjusted R2.
B)F-statistic.
C)t-statistic.
D)R2.
Unlock Deck
Unlock for access to all 33 flashcards in this deck.
Unlock Deck
k this deck
26
Recent research has shown that lecturers are among the most stressed workers. A researcher wanted to know exactly what it was about being a lecturer that created this stress and subsequent burnout. She recruited 75 lecturers and administered several questionnaires that measured: Burnout (high score = burnt out), Perceived Control (high score = low perceived control), Coping Ability (high score = low ability to cope with stress), Stress from Teaching (high score = teaching creates a lot of stress for the person), Stress from Research (high score = research creates a lot of stress for the person), and Stress from Providing Pastoral Care (high score = providing pastoral care creates a lot of stress for the person). The outcome of interest was burnout, and Cooper's (1988) model of stress indicates that perceived control and coping style are important predictors of this variable. The remaining predictors were measured to see the unique contribution of different aspects of a lecturer's work to their burnout.
-How much variance in burnout does the final model explain for the sample?
Model Summ ary
a. Predictors: (Constant), Coping Ability, Perceived Control
b. Predictors: (Constant), Coping Ability, Perceived Control, Stress from Teaching
C. Predictors: (Constant), Coping Ability, Perceived Control, Stress from Teaching, Stress from providing pastoral Care
d. Dependent Variable: Burnout
A)79.2%
B)8.3%
C)80.3%
D)89.6%
Unlock Deck
Unlock for access to all 33 flashcards in this deck.
Unlock Deck
k this deck
27
When assessing the influence of a predictor in a linear model which of the following would you review.
A)R2.
B)t-statistic.
C)Z score.
D)Chi Square.
A)R2.
B)t-statistic.
C)Z score.
D)Chi Square.
Unlock Deck
Unlock for access to all 33 flashcards in this deck.
Unlock Deck
k this deck
28
Recent research has shown that lecturers are among the most stressed workers. A researcher wanted to know exactly what it was about being a lecturer that created this stress and subsequent burnout. She recruited 75 lecturers and administered several questionnaires that measured: Burnout (high score = burnt out), Perceived Control (high score = low perceived control), Coping Ability (high score = low ability to cope with stress), Stress from Teaching (high score = teaching creates a lot of stress for the person), Stress from Research (high score = research creates a lot of stress for the person), and Stress from Providing Pastoral Care (high score = providing pastoral care creates a lot of stress for the person). The outcome of interest was burnout, and Cooper's (1988) model of stress indicates that perceived control and coping style are important predictors of this variable. The remaining predictors were measured to see the unique contribution of different aspects of a lecturer's work to their burnout.
-How would you interpret the beta value for 'stress from teaching'?
A)People with burnout are 36% more likely to be stressed when they teach.
B)As stress from teaching increases by a unit, burnout decreases by 0.36 of a unit.Therefore, stress from teaching protects against burnout.
C)As stress from teaching increases by 0.36 of a standard deviation, burnout also increases by 0.36 of a standard deviation.
D)As stress from teaching increases by a unit, burnout decreases by 0.36 of a unit.Therefore, stress from teaching protects against burnout
Unlock Deck
Unlock for access to all 33 flashcards in this deck.
Unlock Deck
k this deck
29
Why is bootstrapping a good way to ensure robust confidence intervals and significance values?
A)Because it does not rely on assumptions of Type I errors.
B)Because it relies on assumptions of normality and error.
C)Because it does not rely on assumptions of normality or homoscedasticity.
D)Because it relies on assumptions of heteroscedasticity and normality.
A)Because it does not rely on assumptions of Type I errors.
B)Because it relies on assumptions of normality and error.
C)Because it does not rely on assumptions of normality or homoscedasticity.
D)Because it relies on assumptions of heteroscedasticity and normality.
Unlock Deck
Unlock for access to all 33 flashcards in this deck.
Unlock Deck
k this deck
30
Which of the following are potential sources of bias in a linear model?
A)Outliers and influential cases.
B)Influential cases and Z scores.
C)Outliers and Z scores.
D)Coefficients and influential cases
A)Outliers and influential cases.
B)Influential cases and Z scores.
C)Outliers and Z scores.
D)Coefficients and influential cases
Unlock Deck
Unlock for access to all 33 flashcards in this deck.
Unlock Deck
k this deck
31
Why is multicollinearity a potential problem in a multiple linear regression?
A)It becomes difficult to assess the individual importance of predictors and it decreases the standard errors of the b coefficients making them redundant.
B)It becomes difficult to assess the individual importance of predictors and it increases the standard errors of the b coefficients making them unreliable.
C)It becomes difficult to assess the collective power of predictors as it increases the levels of error in the model.
D)It becomes too easy to assess the individual importance of predictors, making the b coefficients unreliable.
Unlock Deck
Unlock for access to all 33 flashcards in this deck.
Unlock Deck
k this deck
32
Recent research has shown that lecturers are among the most stressed workers. A researcher wanted to know exactly what it was about being a lecturer that created this stress and subsequent burnout. She recruited 75 lecturers and administered several questionnaires that measured: Burnout (high score = burnt out), Perceived Control (high score = low perceived control), Coping Ability (high score = low ability to cope with stress), Stress from Teaching (high score = teaching creates a lot of stress for the person), Stress from Research (high score = research creates a lot of stress for the person), and Stress from Providing Pastoral Care (high score = providing pastoral care creates a lot of stress for the person). The outcome of interest was burnout, and Cooper's (1988) model of stress indicates that perceived control and coping style are important predictors of this variable. The remaining predictors were measured to see the unique contribution of different aspects of a lecturer's work to their burnout.
-What does the scatterplot show?
A)Homoscedasticity of errors
B)Independence of errors and homoscedasticity
C)Heteroscedasticity of errors
D)Normality of errors
-What does the scatterplot show?
A)Homoscedasticity of errors
B)Independence of errors and homoscedasticity
C)Heteroscedasticity of errors
D)Normality of errors
Unlock Deck
Unlock for access to all 33 flashcards in this deck.
Unlock Deck
k this deck
33
When we want to determine the goodness of fit in a Linear regression model, we need to review which two items.
A)R 2 and the F statistic.
B)R2 and the b statistic.
C)B1 and the Alpha test.
D)The F statistic and the Z score.
A)R 2 and the F statistic.
B)R2 and the b statistic.
C)B1 and the Alpha test.
D)The F statistic and the Z score.
Unlock Deck
Unlock for access to all 33 flashcards in this deck.
Unlock Deck
k this deck
Unlock Deck
Unlock for access to all 33 flashcards in this deck.


