Deck 13: Data Processing, Data Analysis, and Statistical Testing
Full screen (f)
Question
Question
Question
Question
Question
Question
Question
Question
Question
Question
Question
Question
Question
Question
Question
Question
Question
Question
Question
Question
Question
Question
Question
Question
Question
Question
Question
Question
Question
Question
Question
Question
Question
Question
Question
Question
Question
Question
Question
Question
Question
Question
Question
Question
Question
Question
Question
Question
Question
Question
Question
Question
Question
Question
Question
Question
Question
Question
Question
Question
Question
Question
Question
Question
Question
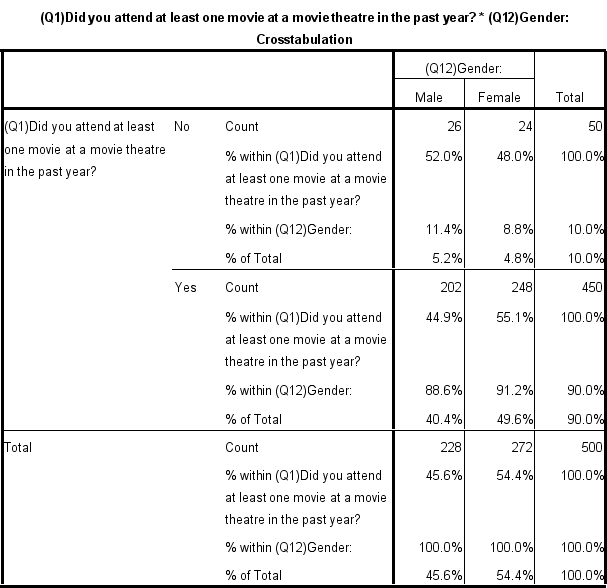
Given the following cross tabulation output, answer the questions below:
 Questions:
1) What percentage of males did not attend at least one movie at a movie theatre in the last year?
2) What percent of all respondents were female and attended at least one movie at a movie theatre?
3) What percent of all respondents that did not go to at least one movie at a movie theatre in the last year were female?
Questions:1) What percentage of males did not attend at least one movie at a movie theatre in the last year?
2) What percent of all respondents were female and attended at least one movie at a movie theatre?
3) What percent of all respondents that did not go to at least one movie at a movie theatre in the last year were female?
Question
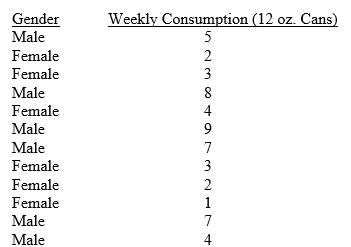
Using the data below compare and contrast male and female soft drink consumption. You will need to compute the proper measure of central tendency and dispersion to support your answer.
Question
Question
Question
Question
Question
Question
Question
Question

Unlock Deck
Sign up to unlock the cards in this deck!
Unlock Deck
Unlock Deck
1/74
Play
Full screen (f)
Deck 13: Data Processing, Data Analysis, and Statistical Testing
1
This type of chart is the simplest form of chart and is useful for presenting a measurement taken at several points over time.
A) line chart
B) bar chart
C) pie chart
D) (b) and (c) are equally useful
E) All are equally useful.
A) line chart
B) bar chart
C) pie chart
D) (b) and (c) are equally useful
E) All are equally useful.
A
2
If we conclude that the average weekly amount of soft drink consumption by males and females is about the same, but that the standard deviation among males is greater than that for females, what would this mean?
A) Males and females pretty much agree as to how many soft drinks they consume per week.
B) Males consume more soft drinks per week than females.
C) Even though males and females consume, on average, about the same number of soft drinks, there is more diversity of consumption among males.
D) none of the above
C
3
The process of converting information into a form that can be read by a computer is known as _______.
A) scanning
B) coding
C) machine cleaning
D) data entry
E) none of the above
A) scanning
B) coding
C) machine cleaning
D) data entry
E) none of the above
D
4
Checking to determine whether the proper screener questions were invoked would be part of which step in the data analysis procedure?
A) validation
B) coding
C) machine cleaning
D) data entry
E) none of the above
A) validation
B) coding
C) machine cleaning
D) data entry
E) none of the above
Unlock Deck
Unlock for access to all 74 flashcards in this deck.
Unlock Deck
k this deck
5
The process of converting information to an electronic format.
A) Editing
B) Validating
C) Data Entry
D) Research
A) Editing
B) Validating
C) Data Entry
D) Research
Unlock Deck
Unlock for access to all 74 flashcards in this deck.
Unlock Deck
k this deck
6
The process of ascertaining that interviews were actually conducted is known as:
A) validation.
B) coding.
C) machine cleaning.
D) data entry.
E) none of the above
A) validation.
B) coding.
C) machine cleaning.
D) data entry.
E) none of the above
Unlock Deck
Unlock for access to all 74 flashcards in this deck.
Unlock Deck
k this deck
7
Checking to be sure that all the questionnaires are filled out properly and completely is part of which step in the data analysis procedure?
A) first step
B) second step
C) third step
D) fourth step
E) fifth step
A) first step
B) second step
C) third step
D) fourth step
E) fifth step
Unlock Deck
Unlock for access to all 74 flashcards in this deck.
Unlock Deck
k this deck
8
The sum of the values for all observations of a variable divided by the number of observations.
A) central tendency
B) median
C) mode
D) mean
A) central tendency
B) median
C) mode
D) mean
Unlock Deck
Unlock for access to all 74 flashcards in this deck.
Unlock Deck
k this deck
9
Which of the following is a table showing the number of respondents choosing each answer to the survey question?
A) cross tabulation
B) line chart
C) one way frequency chart
D) graph chart
A) cross tabulation
B) line chart
C) one way frequency chart
D) graph chart
Unlock Deck
Unlock for access to all 74 flashcards in this deck.
Unlock Deck
k this deck
10
During validation, the researcher confirms that a question wasn't answered. All respondents should have answered the question and there is no way to contact the respondent. What will the researcher do?
A) contact the research firm
B) try to find the respondent
C) discard the questionnaire
D) use the survey's other answers
A) contact the research firm
B) try to find the respondent
C) discard the questionnaire
D) use the survey's other answers
Unlock Deck
Unlock for access to all 74 flashcards in this deck.
Unlock Deck
k this deck
11
Which of the following is not a measure of dispersion?
A) mean
B) standard deviation
C) variance
D) range
A) mean
B) standard deviation
C) variance
D) range
Unlock Deck
Unlock for access to all 74 flashcards in this deck.
Unlock Deck
k this deck
12
Appropriate for displaying marketing research results in a wide range of situations.
A) Line charts
B) Pie charts
C) Bar charts
D) None of the above
A) Line charts
B) Pie charts
C) Bar charts
D) None of the above
Unlock Deck
Unlock for access to all 74 flashcards in this deck.
Unlock Deck
k this deck
13
Which type of analysis cannot be computed with nominal data?
A) mean
B) mode
C) frequency
D) percentage
A) mean
B) mode
C) frequency
D) percentage
Unlock Deck
Unlock for access to all 74 flashcards in this deck.
Unlock Deck
k this deck
14
This measure of central tendency can be computed only from interval or ratio data.
A) mode
B) median
C) mean
D) All of the above must be computed from interval or ratio data.
E) None of the above can be computed from interval or ratio data.
A) mode
B) median
C) mean
D) All of the above must be computed from interval or ratio data.
E) None of the above can be computed from interval or ratio data.
Unlock Deck
Unlock for access to all 74 flashcards in this deck.
Unlock Deck
k this deck
15
This analytical procedure shows the responses to one question relative to the responses of another question.
A) one-way frequencies
B) cross tabulation
C) t-test
D) z-test
E) none of the above
A) one-way frequencies
B) cross tabulation
C) t-test
D) z-test
E) none of the above
Unlock Deck
Unlock for access to all 74 flashcards in this deck.
Unlock Deck
k this deck
16
Which of the following is the most flexible type of graph?
A) line chart
B) bar chart
C) pie chart
D) (a) and (b)
E) All are equally flexible.
A) line chart
B) bar chart
C) pie chart
D) (a) and (b)
E) All are equally flexible.
Unlock Deck
Unlock for access to all 74 flashcards in this deck.
Unlock Deck
k this deck
17
Which type of data entry ensures that data is entered properly?
A) scanning
B) coding
C) intelligent
D) marginal
E) none of the above
A) scanning
B) coding
C) intelligent
D) marginal
E) none of the above
Unlock Deck
Unlock for access to all 74 flashcards in this deck.
Unlock Deck
k this deck
18
What is the first step in data analysis procedure?
A) coding.
B) machine cleaning of data.
C) tabulation and statistical analysis.
D) interpretation of the results.
E) validation and editing
A) coding.
B) machine cleaning of data.
C) tabulation and statistical analysis.
D) interpretation of the results.
E) validation and editing
Unlock Deck
Unlock for access to all 74 flashcards in this deck.
Unlock Deck
k this deck
19
If the research firm is validating questionnaires by phone, they will want to make sure__________________.
A) The person was actually interviewed
B) The person interviewed actually qualified for the screening
C) The interview was conducted in the required manner
D) The interviewer went over the full survey
E) All of these would be validated
A) The person was actually interviewed
B) The person interviewed actually qualified for the screening
C) The interview was conducted in the required manner
D) The interviewer went over the full survey
E) All of these would be validated
Unlock Deck
Unlock for access to all 74 flashcards in this deck.
Unlock Deck
k this deck
20
The last step in the data analysis procedure is:
A) coding.
B) machine cleaning of data.
C) tabulation and statistical analysis.
D) interpretation of the results.
E) none of the above
A) coding.
B) machine cleaning of data.
C) tabulation and statistical analysis.
D) interpretation of the results.
E) none of the above
Unlock Deck
Unlock for access to all 74 flashcards in this deck.
Unlock Deck
k this deck
21
Validation of data is an attempt to check the accuracy of the work done by _______
A) analysts
B) project managers
C) interviewers
D) panel recruiters
E) none of the above
A) analysts
B) project managers
C) interviewers
D) panel recruiters
E) none of the above
Unlock Deck
Unlock for access to all 74 flashcards in this deck.
Unlock Deck
k this deck
22
_____________ is a form of data entry in which responses on questionnaires are read in automatically by the data entry device.
A) Automatic Entry
B) Automatic Delivery
C) Scanning Technology
D) None of the above
A) Automatic Entry
B) Automatic Delivery
C) Scanning Technology
D) None of the above
Unlock Deck
Unlock for access to all 74 flashcards in this deck.
Unlock Deck
k this deck
23
Which of the following is not a measure of dispersion?
A) standard deviation
B) median
C) variance
D) all of the above
E) none of the above
A) standard deviation
B) median
C) variance
D) all of the above
E) none of the above
Unlock Deck
Unlock for access to all 74 flashcards in this deck.
Unlock Deck
k this deck
24
The coding step pertains to only closed-ended responses on questionnaires.
Unlock Deck
Unlock for access to all 74 flashcards in this deck.
Unlock Deck
k this deck
25
Error checking routines and marginal reports are part of which of the following processes?
A) determination of proper graphical aides in data analysis
B) determination of proper statistical techniques in data analysis
C) machine cleaning of the database
D) validation of questionnaires
E) coding of open-ended questions on questionnaires.
A) determination of proper graphical aides in data analysis
B) determination of proper statistical techniques in data analysis
C) machine cleaning of the database
D) validation of questionnaires
E) coding of open-ended questions on questionnaires.
Unlock Deck
Unlock for access to all 74 flashcards in this deck.
Unlock Deck
k this deck
26
The mode of a distribution of responses is the middle response in the distribution, meaning half of the responses are larger and half of the responses are smaller than the mode.
Unlock Deck
Unlock for access to all 74 flashcards in this deck.
Unlock Deck
k this deck
27
The quality control aspect of the data analysis procedure refers to:
A) statistical analysis of data.
B) properly training interviewers.
C) validation and editing.
D) coding questionnaires.
E) none of the above
A) statistical analysis of data.
B) properly training interviewers.
C) validation and editing.
D) coding questionnaires.
E) none of the above
Unlock Deck
Unlock for access to all 74 flashcards in this deck.
Unlock Deck
k this deck
28
Which of the following does validation typically address?
A) validity of measures used
B) measures of central tendency
C) whether respondents were actually interviewed
D) none of the above
A) validity of measures used
B) measures of central tendency
C) whether respondents were actually interviewed
D) none of the above
Unlock Deck
Unlock for access to all 74 flashcards in this deck.
Unlock Deck
k this deck
29
If an interviewer did not properly follow skip patterns specified in a questionnaire, the ______________ step in data analysis would reveal the problem.
A) validation
B) editing
C) coding
D) analyzing
E) data cleaning
A) validation
B) editing
C) coding
D) analyzing
E) data cleaning
Unlock Deck
Unlock for access to all 74 flashcards in this deck.
Unlock Deck
k this deck
30
The median can be computed for all types of data except nominal data.
Unlock Deck
Unlock for access to all 74 flashcards in this deck.
Unlock Deck
k this deck
31
The idea behind this type of statistical analysis is to look at the responses to one question in relation to the responses to one or more other questions.
A) one-way frequencies
B) cross tabulations
C) analysis using measures of central tendency
D) analysis using measures of dispersion
E) analysis using line and/or bar charts
A) one-way frequencies
B) cross tabulations
C) analysis using measures of central tendency
D) analysis using measures of dispersion
E) analysis using line and/or bar charts
Unlock Deck
Unlock for access to all 74 flashcards in this deck.
Unlock Deck
k this deck
32
Failing to reject the null hypothesis when it is actually false.
A) type I error
B) type II error
C) test error
D) two-tailed test
A) type I error
B) type II error
C) test error
D) two-tailed test
Unlock Deck
Unlock for access to all 74 flashcards in this deck.
Unlock Deck
k this deck
33
Which of the following graphic representation is the most visually pleasing for presenting cross tabulation information?
A) multiple row-three dimensional bar chart
B) three dimensional pie chart
C) clustered bar chart
D) stacked bar chart
E) clustered line chart
A) multiple row-three dimensional bar chart
B) three dimensional pie chart
C) clustered bar chart
D) stacked bar chart
E) clustered line chart
Unlock Deck
Unlock for access to all 74 flashcards in this deck.
Unlock Deck
k this deck
34
Means can be calculated using nominal, ordinal, or interval data.
Unlock Deck
Unlock for access to all 74 flashcards in this deck.
Unlock Deck
k this deck
35
Out of the following, which would typically have the largest base size?
A) total respondents
B) total asked
C) total answering
D) total skipping
A) total respondents
B) total asked
C) total answering
D) total skipping
Unlock Deck
Unlock for access to all 74 flashcards in this deck.
Unlock Deck
k this deck
36
____________ is the process of grouping and assigning numeric codes to the various responses to a question.
A) Alignment
B) Coding
C) Decoding
D) Arrangement
A) Alignment
B) Coding
C) Decoding
D) Arrangement
Unlock Deck
Unlock for access to all 74 flashcards in this deck.
Unlock Deck
k this deck
37
Which of the following is not part of the coding process regarding open-ended questions?
A) list responses
B) consolidate responses
C) set codes
D) enter codes
E) All are part of the coding process.
A) list responses
B) consolidate responses
C) set codes
D) enter codes
E) All are part of the coding process.
Unlock Deck
Unlock for access to all 74 flashcards in this deck.
Unlock Deck
k this deck
38
____________ is the process of ascertaining that questionnaires were filled out properly and completely.
A) Editing
B) Revision
C) Review
D) None of the above
A) Editing
B) Revision
C) Review
D) None of the above
Unlock Deck
Unlock for access to all 74 flashcards in this deck.
Unlock Deck
k this deck
39
Finding the value that occurs most frequently determines the__________.
A) standard deviation
B) mode
C) variance
D) mean
E) none of the above
A) standard deviation
B) mode
C) variance
D) mean
E) none of the above
Unlock Deck
Unlock for access to all 74 flashcards in this deck.
Unlock Deck
k this deck
40
With one-way frequency tables, the base size for a question would not take into consideration:
A) total respondents.
B) the number of people asked a particular question.
C) the number of people who answered the question.
D) population size.
A) total respondents.
B) the number of people asked a particular question.
C) the number of people who answered the question.
D) population size.
Unlock Deck
Unlock for access to all 74 flashcards in this deck.
Unlock Deck
k this deck
41
Error checking routines and marginal reports are two ways of machine cleaning the data.
Unlock Deck
Unlock for access to all 74 flashcards in this deck.
Unlock Deck
k this deck
42
A variable with a large standard deviation would have a large variance as well.
Unlock Deck
Unlock for access to all 74 flashcards in this deck.
Unlock Deck
k this deck
43
Open-ended questions are tabulated on a point system.
Unlock Deck
Unlock for access to all 74 flashcards in this deck.
Unlock Deck
k this deck
44
The first step in the data analysis process is coding.
Unlock Deck
Unlock for access to all 74 flashcards in this deck.
Unlock Deck
k this deck
45
Logical or machine cleaning of data is done with the assistance of computer programs.
Unlock Deck
Unlock for access to all 74 flashcards in this deck.
Unlock Deck
k this deck
46
Interviewers are often asked to paraphrase the responses to open-ended questions.
Unlock Deck
Unlock for access to all 74 flashcards in this deck.
Unlock Deck
k this deck
47
Reviewing questionnaires to make sure all the questions have been answered is part of the data entry step.
Unlock Deck
Unlock for access to all 74 flashcards in this deck.
Unlock Deck
k this deck
48
Categorical data is typically analyzed with percentages rather than means.
Unlock Deck
Unlock for access to all 74 flashcards in this deck.
Unlock Deck
k this deck
49
The median is always equal to the mean.
Unlock Deck
Unlock for access to all 74 flashcards in this deck.
Unlock Deck
k this deck
50
The mode is always equal to the mean.
Unlock Deck
Unlock for access to all 74 flashcards in this deck.
Unlock Deck
k this deck
51
The most complex tabulation is the one-way frequency table.
Unlock Deck
Unlock for access to all 74 flashcards in this deck.
Unlock Deck
k this deck
52
Anything that can be shown in a line graph or pie chart also can be shown in a bar chart.
Unlock Deck
Unlock for access to all 74 flashcards in this deck.
Unlock Deck
k this deck
53
Line charts are particularly useful for presenting a measurement over several points in time.
Unlock Deck
Unlock for access to all 74 flashcards in this deck.
Unlock Deck
k this deck
54
Checking to ensure that skip patterns were followed occurs during the data editing stage.
Unlock Deck
Unlock for access to all 74 flashcards in this deck.
Unlock Deck
k this deck
55
Once a respondent is interviewed in a phone survey, they should never be contacted again regarding that particular study.
Unlock Deck
Unlock for access to all 74 flashcards in this deck.
Unlock Deck
k this deck
56
Assigning numeric codes to various responses is called tabulating.
Unlock Deck
Unlock for access to all 74 flashcards in this deck.
Unlock Deck
k this deck
57
Pie charts are useful for depicting changes over time.
Unlock Deck
Unlock for access to all 74 flashcards in this deck.
Unlock Deck
k this deck
58
Cross tabulations look at differences in mean values.
Unlock Deck
Unlock for access to all 74 flashcards in this deck.
Unlock Deck
k this deck
59
The person doing the editing must accept all responses to open-ended questions.
Unlock Deck
Unlock for access to all 74 flashcards in this deck.
Unlock Deck
k this deck
60
A researcher calls every tenth respondent to a local questionnaire as a part of the validation process.
Unlock Deck
Unlock for access to all 74 flashcards in this deck.
Unlock Deck
k this deck
61
Charting the answers to open-ended questions is standard.
Unlock Deck
Unlock for access to all 74 flashcards in this deck.
Unlock Deck
k this deck
62
Open-ended questions are often necessary even in surveys whose major objective is to produce quantitative data. Given the open-ended responses below, how would you summarize them for analytical purposes?
QUESTION: How do you think the taste of Pepsi compares with Coca Cola?
Responses: The taste of Pepsi was
1) Better
2) Sweeter
3) Too sweet
4) Not as refreshing
5) More refreshing
6) Sweeter is better
7) Bolder taste
8) They taste about the same
9) I don't know
10) I don't have any idea
11) I don't drink soft drinks
12) Soft drinks are not good for you
13) Sweeter is better
14) Not a refreshing as Coca Cola
15) Coca Cola has always been my favorite brand
Unlock Deck
Unlock for access to all 74 flashcards in this deck.
Unlock Deck
k this deck
63
The TextSmart module of SPSS is not an example of the new breed of automated coding systems.
Unlock Deck
Unlock for access to all 74 flashcards in this deck.
Unlock Deck
k this deck
64
Data entry must always be done manually.
Unlock Deck
Unlock for access to all 74 flashcards in this deck.
Unlock Deck
k this deck
65
Given the following cross tabulation output, answer the questions below:
Questions:
1) What percentage of males did not attend at least one movie at a movie theatre in the last year?
2) What percent of all respondents were female and attended at least one movie at a movie theatre?
3) What percent of all respondents that did not go to at least one movie at a movie theatre in the last year were female?
Questions:1) What percentage of males did not attend at least one movie at a movie theatre in the last year?
2) What percent of all respondents were female and attended at least one movie at a movie theatre?
3) What percent of all respondents that did not go to at least one movie at a movie theatre in the last year were female?
Unlock Deck
Unlock for access to all 74 flashcards in this deck.
Unlock Deck
k this deck
66
Using the data below compare and contrast male and female soft drink consumption. You will need to compute the proper measure of central tendency and dispersion to support your answer.
Unlock Deck
Unlock for access to all 74 flashcards in this deck.
Unlock Deck
k this deck
67
Stacked bar charts are not helpful in graphically representing cross-tabulation results.
Unlock Deck
Unlock for access to all 74 flashcards in this deck.
Unlock Deck
k this deck
68
Illustrate a condition in which a "SKIP PATTERN" is needed.
Unlock Deck
Unlock for access to all 74 flashcards in this deck.
Unlock Deck
k this deck
69
Scanning data is the most frequently used questionnaire tool.
Unlock Deck
Unlock for access to all 74 flashcards in this deck.
Unlock Deck
k this deck
70
A common way of setting up cross-tabulation is to use columns to represent factors such as demographics and lifestyle characteristics, which are expected to be predictors of the state of mind, behavior, or intentions data, shown as rows of the table.
Unlock Deck
Unlock for access to all 74 flashcards in this deck.
Unlock Deck
k this deck
71
Means are not included in a cross tabulation.
Unlock Deck
Unlock for access to all 74 flashcards in this deck.
Unlock Deck
k this deck
72
Open-ended questions are often necessary even in surveys whose major objective is to produce quantitative data. Given the open-ended responses below, which answers would you discard?
QUESTION: What do you like about McDonald's French Fries compared to other restaurant French fries?
Responses: I like that they are
1) Saltier
2) Crisper
3) Fresher and hotter
4) Crunchy
5) I don't eat them
6) I don't like them
7) Burger King's are better
8) Depends on when they were cooked
9) Super sized
10) Salty
11) Messy
12) Hot
13) Crunchy
14) Greasy
15) Ewww
Unlock Deck
Unlock for access to all 74 flashcards in this deck.
Unlock Deck
k this deck
73
Give the five steps in the analysis process.
Unlock Deck
Unlock for access to all 74 flashcards in this deck.
Unlock Deck
k this deck
74
The purpose of the first edit, or field edit, is to identify problems when there is still time to recontact the respondent and determine the appropriate answer to questions that were not asked.
Unlock Deck
Unlock for access to all 74 flashcards in this deck.
Unlock Deck
k this deck
Unlock Deck
Unlock for access to all 74 flashcards in this deck.


