Deck 16: Multiple Regression and Correlation
Full screen (f)
Question
Question
Question
Question
Question
Question
Question
Question
Question
Question
Question
Question
Question
Question
Question
Question
Question
Question
Question
Question
Question
Question
A multiple regression model has three independent variables.The following values of y are given:  Compute the total sum of squares (SST).
SST = ____________________
Compute the total sum of squares (SST).SST = ____________________
Question
Question
Consider the multiple regression equation,  = 80 + 15x1 - 5 x2 + 100x3.If x1 = 10,x2 = 4,x3 = 12,what is the estimated value of y?
= 80 + 15x1 - 5 x2 + 100x3.If x1 = 10,x2 = 4,x3 = 12,what is the estimated value of y? Question
Question
Question
Question
Question
In a multiple regression problem,the regression equation is given by  = 58.0 - 5.66x1 + 0.61 x2.Compute the point estimate for y when x1 = 3 and x2 = 4.
= 58.0 - 5.66x1 + 0.61 x2.Compute the point estimate for y when x1 = 3 and x2 = 4. Question
NARRBEGIN: States
Concern over the number of car thefts grew into a project to determine the relationship between car thefts by state and these variables:
x1 = Police per 10,000 persons,by state
x2 = Expenditure by local government for police protection,in thousands,by state
x3 = New passenger car registrations,in thousands,by state.
Data from 13 states were collected.The MINITAB regression results are:
How much of the variation in thefts is explained by the model?
Question
NARRBEGIN: States
Concern over the number of car thefts grew into a project to determine the relationship between car thefts by state and these variables:
x1 = Police per 10,000 persons,by state
x2 = Expenditure by local government for police protection,in thousands,by state
x3 = New passenger car registrations,in thousands,by state.
Data from 13 states were collected.The MINITAB regression results are:
Compute the multiple standard error of estimate (se)from the regression results.
Question
In a regression model involving 25 observations,the following estimated regression model was obtained:  = 60 + 2.8x1 + 1.2x2 - x3.For this model,SST = 600 and SSE = 150.Calculate the value of the F statistic for testing the significance of this model.
F = ____________________
= 60 + 2.8x1 + 1.2x2 - x3.For this model,SST = 600 and SSE = 150.Calculate the value of the F statistic for testing the significance of this model.F = ____________________
Question
Question
Question
In a regression model involving 40 observations, the following estimated regression model was obtained  = 10 + 3x1 + 5x2 + 6x3. For this model, SSR = 300 and SSE = 75. Then, the value of MSR is:
A) 100.
B) 225.
C) 25.
D) 75.
= 10 + 3x1 + 5x2 + 6x3. For this model, SSR = 300 and SSE = 75. Then, the value of MSR is:A) 100.
B) 225.
C) 25.
D) 75.
Question
Question
Question
Question
NARRBEGIN: Motor Vehicle
In order to predict motor vehicle purchases for the U.S.,the coefficients of a multiple regression equation were estimated using 25 years of data.The variables were:
y = motor vehicle purchases (billions of dollars)
x1 = disposable personal income (billions of dollars)
x2 = U.S.population (millions of persons)
x3 = automobile installment credit (billions of dollars)
Part of the results using MINITAB was: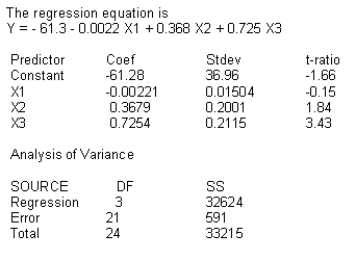
Use the values in the analysis of variance table to compute R2 using the values for SST and SSE or SSR.
Question
NARRBEGIN: Motor Vehicle
In order to predict motor vehicle purchases for the U.S.,the coefficients of a multiple regression equation were estimated using 25 years of data.The variables were:
y = motor vehicle purchases (billions of dollars)
x1 = disposable personal income (billions of dollars)
x2 = U.S.population (millions of persons)
x3 = automobile installment credit (billions of dollars)
Part of the results using MINITAB was:
Use the values in the analysis of variance table to compute the multiple standard error of the estimate.
Question
NARRBEGIN: Equation
The regression equation, = 4 + 1.5x1 + 2.5x2 has been fitted to 25 data points.The means of x1 and x2 are 30 and 46,respectively.The sum of the squared differences between observed and predicted values of y has been calculated as SSE = 175,and the sum of the squared differences between y values and mean of y is SST = 525.
What is the approximate 95% confidence interval for the mean of y whenever x1 = 20 and x2 = 25.
The regression equation,
= 4 + 1.5x1 + 2.5x2 has been fitted to 25 data points.The means of x1 and x2 are 30 and 46,respectively.The sum of the squared differences between observed and predicted values of y has been calculated as SSE = 175,and the sum of the squared differences between y values and mean of y is SST = 525.What is the approximate 95% confidence interval for the mean of y whenever x1 = 20 and x2 = 25.
Question
Consider the multiple regression equation,  = 80 + 15x1 - 5 x2 + 100x3.Identify the y-intercept and partial regression coefficients:
y-intercept: ____________________
x1: ____________________
x2: ____________________
x3: ____________________
= 80 + 15x1 - 5 x2 + 100x3.Identify the y-intercept and partial regression coefficients:y-intercept: ____________________
x1: ____________________
x2: ____________________
x3: ____________________
Question
NARRBEGIN: Grade
A statistics teacher collected the following data to determine if the number of hours a student studied during the semester and the number of classes missed could be used to predict the final grade for the course.The following table shows the results of the model being applied to 8 students.

Calculate the multiple standard error of estimate.
A statistics teacher collected the following data to determine if the number of hours a student studied during the semester and the number of classes missed could be used to predict the final grade for the course.The following table shows the results of the model being applied to 8 students.
Calculate the multiple standard error of estimate.
Question
NARRBEGIN: Equation
The regression equation, = 4 + 1.5x1 + 2.5x2 has been fitted to 25 data points.The means of x1 and x2 are 30 and 46,respectively.The sum of the squared differences between observed and predicted values of y has been calculated as SSE = 175,and the sum of the squared differences between y values and mean of y is SST = 525.
Determine the multiple standard error of estimate.
The regression equation,
= 4 + 1.5x1 + 2.5x2 has been fitted to 25 data points.The means of x1 and x2 are 30 and 46,respectively.The sum of the squared differences between observed and predicted values of y has been calculated as SSE = 175,and the sum of the squared differences between y values and mean of y is SST = 525.Determine the multiple standard error of estimate.
Question
NARRBEGIN: Salary
Data was collected from 40 employees to develop a regression model to predict the employee's annual salary using their years with the company (Years),their starting salary (Starting),and their Gender (Male = 0,Female = 1).The results from Excel regression analysis are shown below:

In testing the significance of the partial regression coefficient associated with the Starting variable at the 0.05 significance level,what is the appropriate conclusion?
Data was collected from 40 employees to develop a regression model to predict the employee's annual salary using their years with the company (Years),their starting salary (Starting),and their Gender (Male = 0,Female = 1).The results from Excel regression analysis are shown below:
In testing the significance of the partial regression coefficient associated with the Starting variable at the 0.05 significance level,what is the appropriate conclusion?
Question
NARRBEGIN: Regression Model
A multiple regression model was developed to predict the grade point average (GPA)for MBA students based on two entrance exam scores,verbal (VGMAT)and math (MGMAT).The following table shows the actual GPA and predicted GPA for 7 students.

Calculate the residual sum of squares.
A multiple regression model was developed to predict the grade point average (GPA)for MBA students based on two entrance exam scores,verbal (VGMAT)and math (MGMAT).The following table shows the actual GPA and predicted GPA for 7 students.
Calculate the residual sum of squares.
Question
NARRBEGIN: Salary
Data was collected from 40 employees to develop a regression model to predict the employee's annual salary using their years with the company (Years),their starting salary (Starting),and their Gender (Male = 0,Female = 1).The results from Excel regression analysis are shown below:
In testing the significance of the partial regression coefficient associated with the Gender variable at the 0.05 significance level,what is the appropriate conclusion?
Question
Explain each of the terms in the multiple regression model:  .
.
. Question
NARRBEGIN: Equation
The regression equation, = 4 + 1.5x1 + 2.5x2 has been fitted to 25 data points.The means of x1 and x2 are 30 and 46,respectively.The sum of the squared differences between observed and predicted values of y has been calculated as SSE = 175,and the sum of the squared differences between y values and mean of y is SST = 525.
What is the approximate 95% prediction interval for an individual y whenever x1 = 20 and x2 = 25?
The regression equation,
= 4 + 1.5x1 + 2.5x2 has been fitted to 25 data points.The means of x1 and x2 are 30 and 46,respectively.The sum of the squared differences between observed and predicted values of y has been calculated as SSE = 175,and the sum of the squared differences between y values and mean of y is SST = 525.What is the approximate 95% prediction interval for an individual y whenever x1 = 20 and x2 = 25?
Question
A multiple regression model has three independent variables.The following values of y and  are given:
 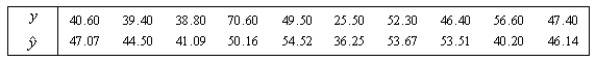 Compute the multiple standard error of the estimate.
are given: Compute the multiple standard error of the estimate. Question
NARRBEGIN: Grade
A statistics teacher collected the following data to determine if the number of hours a student studied during the semester and the number of classes missed could be used to predict the final grade for the course.The following table shows the results of the model being applied to 8 students.
Calculate the coefficient of multiple determination.
Question
NARRBEGIN: Salary
Data was collected from 40 employees to develop a regression model to predict the employee's annual salary using their years with the company (Years),their starting salary (Starting),and their Gender (Male = 0,Female = 1).The results from Excel regression analysis are shown below:
In testing the null hypothesis that the regression equation is not significant at the 0.05 level,what is the appropriate conclusion?
Question
NARRBEGIN: Regression Model
A multiple regression model was developed to predict the grade point average (GPA)for MBA students based on two entrance exam scores,verbal (VGMAT)and math (MGMAT).The following table shows the actual GPA and predicted GPA for 7 students.
Calculate the coefficient of multiple determination.
A multiple regression model was developed to predict the grade point average (GPA)for MBA students based on two entrance exam scores,verbal (VGMAT)and math (MGMAT).The following table shows the actual GPA and predicted GPA for 7 students.
Calculate the coefficient of multiple determination.
Question
Consider the multiple regression equation,  = 80 + 15x1 - 5x2 + 100x3.If x3 were to increase by 5,what change would be necessary in x2 in order for the estimated value of y to remain unchanged?
x2 would ____________________ by ____________________.
= 80 + 15x1 - 5x2 + 100x3.If x3 were to increase by 5,what change would be necessary in x2 in order for the estimated value of y to remain unchanged?x2 would ____________________ by ____________________.
Question
NARRBEGIN: Salary
Data was collected from 40 employees to develop a regression model to predict the employee's annual salary using their years with the company (Years),their starting salary (Starting),and their Gender (Male = 0,Female = 1).The results from Excel regression analysis are shown below:
In testing the significance of the partial regression coefficient associated with the Years variable at the 0.05 significance level,what is the appropriate conclusion?
Question
NARRBEGIN: Grade
A statistics teacher collected the following data to determine if the number of hours a student studied during the semester and the number of classes missed could be used to predict the final grade for the course.The following table shows the results of the model being applied to 8 students.
Calculate the residual sum of squares.
Question
NARRBEGIN: Salary
Data was collected from 40 employees to develop a regression model to predict the employee's annual salary using their years with the company (Years),their starting salary (Starting),and their Gender (Male = 0,Female = 1).The results from Excel regression analysis are shown below:
What is the regression equation?
Question
A multiple regression model was developed to predict the grade point average (GPA)for MBA students based on two entrance exam scores,verbal (VGMAT)and math (MGMAT).The following table shows the actual GPA and predicted GPA for 7 students.
 Calculate the multiple standard error of estimate.
Calculate the multiple standard error of estimate. Question
NARRBEGIN: Grade
A statistics teacher collected the following data to determine if the number of hours a student studied during the semester and the number of classes missed could be used to predict the final grade for the course.The following table shows the results of the model being applied to 8 students.
Calculate the total sum of squares.
Question
NARRBEGIN: Regression Model
A multiple regression model was developed to predict the grade point average (GPA)for MBA students based on two entrance exam scores,verbal (VGMAT)and math (MGMAT).The following table shows the actual GPA and predicted GPA for 7 students.
Calculate the total sum of squares.
A multiple regression model was developed to predict the grade point average (GPA)for MBA students based on two entrance exam scores,verbal (VGMAT)and math (MGMAT).The following table shows the actual GPA and predicted GPA for 7 students.
Calculate the total sum of squares.
Question
NARRBEGIN: Nutritionist
A nutritionist is analyzing the cost of an 8 oz.serving of pasta.The nutritionist anticipates that cost is related to:
x1 = Grams of protein/8 oz.
x2 = Grams of carbohydrates/8 oz.
x3 = Grams of fat/8 oz.
Using MINITAB,the nutritionist obtained the following results: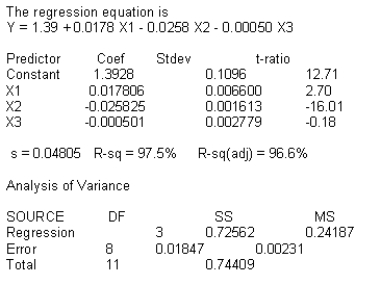
From these regression results,compute a 95% prediction interval for y when x1 = 4,x2 = 5,and x3 = 3.
Question
NARRBEGIN: Marketing Analyst
A marketing analyst is interested in predicting prospective buyer's knowledge about compact disc players.A random sample of 36 buyers was taken,a questionnaire about compact disc players completed,and information about education,income and age was obtained.In estimating the equation,the variables were:
y = knowledge about compact disc players
x1 = education (years)
x2 = age
x3 = income (thousands of dollars)
The resulting output using MINITAB was: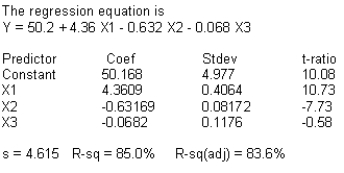
Identify the coefficient of multiple determination,R2.
Interpret the value.
Question
NARRBEGIN: Professor
A statistics professor investigated some of the factors that affect an individual student's final grade in his course.He proposed the multiple regression model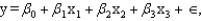 where:
y = final mark (out of 100)
x1 = number of lectures skipped
x2 = number of late assignments
x3 = mid-term test mark (out of 100)
The professor recorded the data for 50 randomly selected students.The computer output is shown below.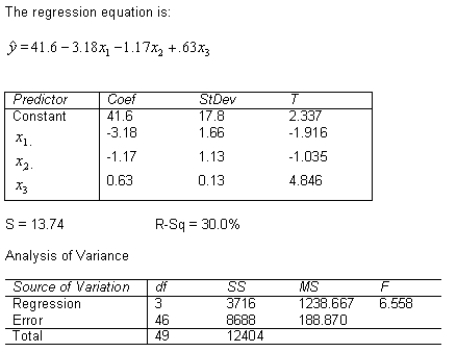
Do these data provide enough evidence at the 1% significance level to conclude that the final mark and the mid-term mark are positively linearly related?
Test statistic = ____________________
Critical Value = ____________________
Conclusion: ____________________
A statistics professor investigated some of the factors that affect an individual student's final grade in his course.He proposed the multiple regression model
where:y = final mark (out of 100)
x1 = number of lectures skipped
x2 = number of late assignments
x3 = mid-term test mark (out of 100)
The professor recorded the data for 50 randomly selected students.The computer output is shown below.
Do these data provide enough evidence at the 1% significance level to conclude that the final mark and the mid-term mark are positively linearly related?
Test statistic = ____________________
Critical Value = ____________________
Conclusion: ____________________
Question
NARRBEGIN: States
Concern over the number of car thefts grew into a project to determine the relationship between car thefts by state and these variables:
x1 = Police per 10,000 persons,by state
x2 = Expenditure by local government for police protection,in thousands,by state
x3 = New passenger car registrations,in thousands,by state.
Data from 13 states were collected.The MINITAB regression results are: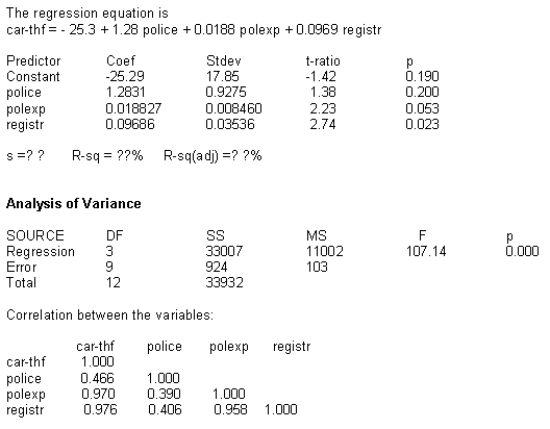
Test the significance of the regression equation at the 0.01 level of significance.
Test statistic = ____________________
Critical Value = ____________________
Conclusion: ____________________
Question
NARRBEGIN: Salary
Data was collected from 40 employees to develop a regression model to predict the employee's annual salary using their years with the company (Years),their starting salary (Starting),and their Gender (Male = 0,Female = 1).The results from Excel regression analysis are shown below:
For a male employee with 5 years of experience and a starting salary of $30,000,what is the approximate 95% confidence interval for his annual salary?
Question
NARRBEGIN: States
Concern over the number of car thefts grew into a project to determine the relationship between car thefts by state and these variables:
x1 = Police per 10,000 persons,by state
x2 = Expenditure by local government for police protection,in thousands,by state
x3 = New passenger car registrations,in thousands,by state.
Data from 13 states were collected.The MINITAB regression results are:
What,if any,multicollinearity do you detect?
Question
The computer output for the multiple regression model 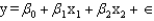 is shown below.However,because of a printer malfunction some of the results are not shown.These are indicated by the boldface letters a to i.Fill in the missing results (up to three decimal places).
 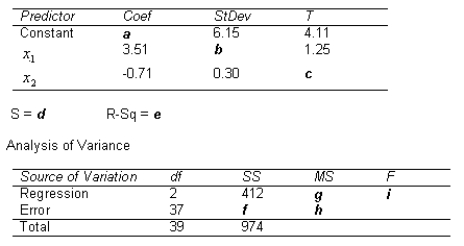 a = ____________________
b = ____________________
c = ____________________
d = ____________________
e = ____________________
f = ____________________
g = ____________________
h = ____________________
i = ____________________
is shown below.However,because of a printer malfunction some of the results are not shown.These are indicated by the boldface letters a to i.Fill in the missing results (up to three decimal places). a = ____________________b = ____________________
c = ____________________
d = ____________________
e = ____________________
f = ____________________
g = ____________________
h = ____________________
i = ____________________
Question
NARRBEGIN: Motor Vehicle
In order to predict motor vehicle purchases for the U.S.,the coefficients of a multiple regression equation were estimated using 25 years of data.The variables were:
y = motor vehicle purchases (billions of dollars)
x1 = disposable personal income (billions of dollars)
x2 = U.S.population (millions of persons)
x3 = automobile installment credit (billions of dollars)
Part of the results using MINITAB was:
Use the values in the analysis of variance table to find MSR and MSE.
MSR = ____________________
MSE = ____________________
Question
NARRBEGIN: Professor
A statistics professor investigated some of the factors that affect an individual student's final grade in his course.He proposed the multiple regression model where:
y = final mark (out of 100)
x1 = number of lectures skipped
x2 = number of late assignments
x3 = mid-term test mark (out of 100)
The professor recorded the data for 50 randomly selected students.The computer output is shown below.
What is the coefficient of determination?
What does this statistic tell you?
A statistics professor investigated some of the factors that affect an individual student's final grade in his course.He proposed the multiple regression model
where:y = final mark (out of 100)
x1 = number of lectures skipped
x2 = number of late assignments
x3 = mid-term test mark (out of 100)
The professor recorded the data for 50 randomly selected students.The computer output is shown below.
What is the coefficient of determination?
What does this statistic tell you?
Question
NARRBEGIN: States
Concern over the number of car thefts grew into a project to determine the relationship between car thefts by state and these variables:
x1 = Police per 10,000 persons,by state
x2 = Expenditure by local government for police protection,in thousands,by state
x3 = New passenger car registrations,in thousands,by state.
Data from 13 states were collected.The MINITAB regression results are:
Do the partial regression coefficients have the algebraic sign you might expect?
Question
NARRBEGIN: Marketing Analyst
A marketing analyst is interested in predicting prospective buyer's knowledge about compact disc players.A random sample of 36 buyers was taken,a questionnaire about compact disc players completed,and information about education,income and age was obtained.In estimating the equation,the variables were:
y = knowledge about compact disc players
x1 = education (years)
x2 = age
x3 = income (thousands of dollars)
The resulting output using MINITAB was:
Identify b0,b1,and b3.
b0 = ____________________
b1 = ____________________
b3 = ____________________
Question
NARRBEGIN: Professor
A statistics professor investigated some of the factors that affect an individual student's final grade in his course.He proposed the multiple regression model where:
y = final mark (out of 100)
x1 = number of lectures skipped
x2 = number of late assignments
x3 = mid-term test mark (out of 100)
The professor recorded the data for 50 randomly selected students.The computer output is shown below.
Interpret the coefficients b1 and b3.
b1 = ____________________
Interpretation: _____________________________________________________
b3 = ____________________
Interpretation: _____________________________________________________
A statistics professor investigated some of the factors that affect an individual student's final grade in his course.He proposed the multiple regression model
where:y = final mark (out of 100)
x1 = number of lectures skipped
x2 = number of late assignments
x3 = mid-term test mark (out of 100)
The professor recorded the data for 50 randomly selected students.The computer output is shown below.
Interpret the coefficients b1 and b3.
b1 = ____________________
Interpretation: _____________________________________________________
b3 = ____________________
Interpretation: _____________________________________________________
Question
Question
NARRBEGIN: Marketing Analyst
A marketing analyst is interested in predicting prospective buyer's knowledge about compact disc players.A random sample of 36 buyers was taken,a questionnaire about compact disc players completed,and information about education,income and age was obtained.In estimating the equation,the variables were:
y = knowledge about compact disc players
x1 = education (years)
x2 = age
x3 = income (thousands of dollars)
The resulting output using MINITAB was:
Predict the questionnaire score for a buyer who is 41 years of age,has 13 years of education,and $39,000 income.
Question
Question
NARRBEGIN: Professor
A statistics professor investigated some of the factors that affect an individual student's final grade in his course.He proposed the multiple regression model where:
y = final mark (out of 100)
x1 = number of lectures skipped
x2 = number of late assignments
x3 = mid-term test mark (out of 100)
The professor recorded the data for 50 randomly selected students.The computer output is shown below.
Do these data provide enough evidence to conclude at the 5% significance level that the model is useful in predicting the final mark?
Test statistic = ____________________
Critical Value = ____________________
Conclusion: ____________________
A statistics professor investigated some of the factors that affect an individual student's final grade in his course.He proposed the multiple regression model
where:y = final mark (out of 100)
x1 = number of lectures skipped
x2 = number of late assignments
x3 = mid-term test mark (out of 100)
The professor recorded the data for 50 randomly selected students.The computer output is shown below.
Do these data provide enough evidence to conclude at the 5% significance level that the model is useful in predicting the final mark?
Test statistic = ____________________
Critical Value = ____________________
Conclusion: ____________________
Question
NARRBEGIN: Professor
A statistics professor investigated some of the factors that affect an individual student's final grade in his course.He proposed the multiple regression model where:
y = final mark (out of 100)
x1 = number of lectures skipped
x2 = number of late assignments
x3 = mid-term test mark (out of 100)
The professor recorded the data for 50 randomly selected students.The computer output is shown below.
Do these data provide enough evidence at the 5% significance level to conclude that the final mark and the number of late assignments are negatively linearly related?
Test statistic = ____________________
Critical Value = ____________________
Conclusion: ____________________
A statistics professor investigated some of the factors that affect an individual student's final grade in his course.He proposed the multiple regression model
where:y = final mark (out of 100)
x1 = number of lectures skipped
x2 = number of late assignments
x3 = mid-term test mark (out of 100)
The professor recorded the data for 50 randomly selected students.The computer output is shown below.
Do these data provide enough evidence at the 5% significance level to conclude that the final mark and the number of late assignments are negatively linearly related?
Test statistic = ____________________
Critical Value = ____________________
Conclusion: ____________________
Question
Question
NARRBEGIN: Professor
A statistics professor investigated some of the factors that affect an individual student's final grade in his course.He proposed the multiple regression model where:
y = final mark (out of 100)
x1 = number of lectures skipped
x2 = number of late assignments
x3 = mid-term test mark (out of 100)
The professor recorded the data for 50 randomly selected students.The computer output is shown below.
Do these data provide enough evidence to conclude at the 5% significance level that the final mark and the number of skipped lectures are linearly related?
Test statistic = ____________________
Critical Value = ____________________
Conclusion: ____________________
A statistics professor investigated some of the factors that affect an individual student's final grade in his course.He proposed the multiple regression model
where:y = final mark (out of 100)
x1 = number of lectures skipped
x2 = number of late assignments
x3 = mid-term test mark (out of 100)
The professor recorded the data for 50 randomly selected students.The computer output is shown below.
Do these data provide enough evidence to conclude at the 5% significance level that the final mark and the number of skipped lectures are linearly related?
Test statistic = ____________________
Critical Value = ____________________
Conclusion: ____________________
Question
NARRBEGIN: Nutritionist
A nutritionist is analyzing the cost of an 8 oz.serving of pasta.The nutritionist anticipates that cost is related to:
x1 = Grams of protein/8 oz.
x2 = Grams of carbohydrates/8 oz.
x3 = Grams of fat/8 oz.
Using MINITAB,the nutritionist obtained the following results:
From these regression results,compute a 95% confidence interval for y when x1 = 4,x2 = 5,and x3 = 3.

Unlock Deck
Sign up to unlock the cards in this deck!
Unlock Deck
Unlock Deck
1/98
Play
Full screen (f)
Deck 16: Multiple Regression and Correlation
1
In reference to the equation: = -0.25 + 0.08x1 + 0.10x2,the value 0.08 is the:
A) predicted value of y.
B) estimated change in y when x1 increases by one unit.
C) estimated change in y when x2 increases by one unit.
D) predicted value of y when x1 = 0 and x2 = 0.
E) predicted value of y when x1= 2 and x2 = 1.
A) predicted value of y.
B) estimated change in y when x1 increases by one unit.
C) estimated change in y when x2 increases by one unit.
D) predicted value of y when x1 = 0 and x2 = 0.
E) predicted value of y when x1= 2 and x2 = 1.
estimated change in y when x1 increases by one unit.
2
The adjusted multiple coefficient of determination is adjusted for the:
A) number of regression parameters including the y-intercept.
B) number of dependent variables and the sample size.
C) number of independent variables and the sample size.
D) coefficient of correlation and the significance level.
A) number of regression parameters including the y-intercept.
B) number of dependent variables and the sample size.
C) number of independent variables and the sample size.
D) coefficient of correlation and the significance level.
number of independent variables and the sample size.
3
A multiple regression equation includes 3 independent variables,and the coefficient of multiple determination is 0.64.The percentage of the variation in y that is explained by the regression equation is:
A) 64%.
B) 80%.
C) 36%.
D) 21%.
A) 64%.
B) 80%.
C) 36%.
D) 21%.
64%.
4
For the multiple regression model = 50 + 25x1 - 10x2 + 8x3,if x2 were to increase by 5,holding x1 and x3 constant,the value of y would:
A) increase by 5.
B) increase by 50.
C) decrease on average by 5.
D) decrease on average by 50.
A) increase by 5.
B) increase by 50.
C) decrease on average by 5.
D) decrease on average by 50.
Unlock Deck
Unlock for access to all 98 flashcards in this deck.
Unlock Deck
k this deck
5
True or False The purpose of the multiple correlation analysis is to measure the strength of the relationship between the dependent (y)and the set of independent (x)variables.
Unlock Deck
Unlock for access to all 98 flashcards in this deck.
Unlock Deck
k this deck
6
A multiple regression analysis includes 25 data points and 4 independent variables results in SST = 200 and SSR = 150.The multiple standard error of estimate will be:
A) 1.333.
B) 6.124.
C) 2.500.
D) 1.581.
A) 1.333.
B) 6.124.
C) 2.500.
D) 1.581.
Unlock Deck
Unlock for access to all 98 flashcards in this deck.
Unlock Deck
k this deck
7
True or False A dummy variable is used to incorporate qualitative data into the analysis.
Unlock Deck
Unlock for access to all 98 flashcards in this deck.
Unlock Deck
k this deck
8
True or False Multicollinearity is a situation in which two or more of the independent variables are highly correlated with each other.
Unlock Deck
Unlock for access to all 98 flashcards in this deck.
Unlock Deck
k this deck
9
In a multiple regression model,the following statistics are given: SSE = 100,R2 = 0.995,k = 5,n = 15.The multiple coefficient of determination adjusted for degrees of freedom is:
A) 0.955.
B) 0.992.
C) 0.900.
D) 0.855.
A) 0.955.
B) 0.992.
C) 0.900.
D) 0.855.
Unlock Deck
Unlock for access to all 98 flashcards in this deck.
Unlock Deck
k this deck
10
True or False It is a good idea to make point estimates based on x values that lie beyond the range of the underlying data.
Unlock Deck
Unlock for access to all 98 flashcards in this deck.
Unlock Deck
k this deck
11
In reference to the equation: = -0.25 + 0.08x1 + 0.10x2,the value -0.25 is the:
A) predicted value of y.
B) partial regression coefficient for x1.
C) partial regression coefficient for x2.
D) predicted value of y when x1 = 0 and x2 = 0.
E) predicted value of when x1 = 2 and x2 = 1.
A) predicted value of y.
B) partial regression coefficient for x1.
C) partial regression coefficient for x2.
D) predicted value of y when x1 = 0 and x2 = 0.
E) predicted value of when x1 = 2 and x2 = 1.
Unlock Deck
Unlock for access to all 98 flashcards in this deck.
Unlock Deck
k this deck
12
In reference to the equation: = -0.25 + 0.08x1 + 0.10x2,the value 0.01 is the:
A) predicted value of y.
B) partial regression coefficient for x1.
C) partial regression coefficient for x2.
D) predicted value y when x1 = 0 and x2 = 0.
E) predicted value of y when x1 = 2 and x2 = 1.
A) predicted value of y.
B) partial regression coefficient for x1.
C) partial regression coefficient for x2.
D) predicted value y when x1 = 0 and x2 = 0.
E) predicted value of y when x1 = 2 and x2 = 1.
Unlock Deck
Unlock for access to all 98 flashcards in this deck.
Unlock Deck
k this deck
13
In a multiple regression analysis involving 40 observations and 4 independent variables,SST = 375 and SSE = 75.The multiple coefficient of determination is:
A) 0.8333.
B) 0.8000.
C) 0.1875.
D) 0.9375.
A) 0.8333.
B) 0.8000.
C) 0.1875.
D) 0.9375.
Unlock Deck
Unlock for access to all 98 flashcards in this deck.
Unlock Deck
k this deck
14
A multiple regression model has the form: = 5.25 + 2.5x1 + 4x2.As x2 increases by 1 unit,holding x1 constant,then the value of y will increase by:
A) 2.5 units.
B) 7.75 units.
C) 4 units on average.
D) 11.75 units on average.
A) 2.5 units.
B) 7.75 units.
C) 4 units on average.
D) 11.75 units on average.
Unlock Deck
Unlock for access to all 98 flashcards in this deck.
Unlock Deck
k this deck
15
True or False In interpreting the multiple regression equation,it can be a mistake to conclude that one independent variable is more important than another just because its partial regression coefficient happens to be large.
Unlock Deck
Unlock for access to all 98 flashcards in this deck.
Unlock Deck
k this deck
16
A multiple regression model has the form = b0 + b1x1 + b2x2.The coefficient b1 is interpreted as the:
A) estimated change in y per unit change in x1.
B) estimated change in y per unit change in x1,holding x2constant.
C) estimated change in y per unit change in x1,when x1 and x2 values are correlated.
D) estimated change in y per unit change in x2,holding x1 constant.
A) estimated change in y per unit change in x1.
B) estimated change in y per unit change in x1,holding x2constant.
C) estimated change in y per unit change in x1,when x1 and x2 values are correlated.
D) estimated change in y per unit change in x2,holding x1 constant.
Unlock Deck
Unlock for access to all 98 flashcards in this deck.
Unlock Deck
k this deck
17
True or False Multiple regression analysis examines the linear relationship between a dependent variable (y)and two or more independent variables (x1,x2,and so on).
Unlock Deck
Unlock for access to all 98 flashcards in this deck.
Unlock Deck
k this deck
18
For each y term in the multiple regression equation,the corresponding is referred to as the partial regression coefficient.
Unlock Deck
Unlock for access to all 98 flashcards in this deck.
Unlock Deck
k this deck
19
The amount of variation in the dependent variable that is not explained by the multiple regression equation is known as:
A) total sum of squares.
B) residual sum of squares.
C) regression sum of squares.
D) treatment sum of squares.
A) total sum of squares.
B) residual sum of squares.
C) regression sum of squares.
D) treatment sum of squares.
Unlock Deck
Unlock for access to all 98 flashcards in this deck.
Unlock Deck
k this deck
20
For the multiple regression model = 3 - 4x1 + 5x2 + 2x3,a unit increase in x1,holding x2 and x3 constant,results in:
A) an increase of 4 units in the value of y.
B) a decrease of 4 units in the value of y.
C) a decrease of 4 units,on average,in the value of y.
D) an increase of 6 units in the value of y.
A) an increase of 4 units in the value of y.
B) a decrease of 4 units in the value of y.
C) a decrease of 4 units,on average,in the value of y.
D) an increase of 6 units in the value of y.
Unlock Deck
Unlock for access to all 98 flashcards in this deck.
Unlock Deck
k this deck
21
A dummy variable will have a value of either ____________________ or ____________________,depending on whether a given characteristic is present or absent.
Unlock Deck
Unlock for access to all 98 flashcards in this deck.
Unlock Deck
k this deck
22
A multiple regression model has three independent variables.The following values of y are given: Compute the total sum of squares (SST).
SST = ____________________
Compute the total sum of squares (SST).SST = ____________________
Unlock Deck
Unlock for access to all 98 flashcards in this deck.
Unlock Deck
k this deck
23
A health science-kinesiology program to lose weight collected data from ten students.Sex was coded as 1 = female and 0 = male.The regression equation obtained was given by: Pounds lost = 15.8 + 0.65 time + 6.00 sex What is the estimated weight loss of a female who stayed in the program for 5 time periods?
Unlock Deck
Unlock for access to all 98 flashcards in this deck.
Unlock Deck
k this deck
24
Consider the multiple regression equation, = 80 + 15x1 - 5 x2 + 100x3.If x1 = 10,x2 = 4,x3 = 12,what is the estimated value of y?
= 80 + 15x1 - 5 x2 + 100x3.If x1 = 10,x2 = 4,x3 = 12,what is the estimated value of y? Unlock Deck
Unlock for access to all 98 flashcards in this deck.
Unlock Deck
k this deck
25
For a multiple regression model the following statistics are given: SSE = 40,SST = 200,k = 4,n = 20.Calculate the coefficient of determination adjusted for degrees of freedom.
Unlock Deck
Unlock for access to all 98 flashcards in this deck.
Unlock Deck
k this deck
26
In a regression model involving 50 observations,the following estimated regression model was obtained. = 51.4 + 0.70x1 + 0.679x2 - 0.378x3.For this model SST = 120,524 and SSR = 85,400.Then,the value of MSE is:
A) 763.565.
B) 702.480.
C) 1708.0.
D) 2410.48.
A) 763.565.
B) 702.480.
C) 1708.0.
D) 2410.48.
Unlock Deck
Unlock for access to all 98 flashcards in this deck.
Unlock Deck
k this deck
27
In testing the significance of a multiple regression model in which there are three independent variables,the null hypothesis is:
A)
B)
C)
D)
A)
B)
C)
D)
Unlock Deck
Unlock for access to all 98 flashcards in this deck.
Unlock Deck
k this deck
28
With four or more variables,the regression equation becomes a mathematical entity called a ____________________.
Unlock Deck
Unlock for access to all 98 flashcards in this deck.
Unlock Deck
k this deck
29
In a multiple regression problem,the regression equation is given by = 58.0 - 5.66x1 + 0.61 x2.Compute the point estimate for y when x1 = 3 and x2 = 4.
= 58.0 - 5.66x1 + 0.61 x2.Compute the point estimate for y when x1 = 3 and x2 = 4. Unlock Deck
Unlock for access to all 98 flashcards in this deck.
Unlock Deck
k this deck
30
NARRBEGIN: States
Concern over the number of car thefts grew into a project to determine the relationship between car thefts by state and these variables:
x1 = Police per 10,000 persons,by state
x2 = Expenditure by local government for police protection,in thousands,by state
x3 = New passenger car registrations,in thousands,by state.
Data from 13 states were collected.The MINITAB regression results are:
How much of the variation in thefts is explained by the model?
Unlock Deck
Unlock for access to all 98 flashcards in this deck.
Unlock Deck
k this deck
31
NARRBEGIN: States
Concern over the number of car thefts grew into a project to determine the relationship between car thefts by state and these variables:
x1 = Police per 10,000 persons,by state
x2 = Expenditure by local government for police protection,in thousands,by state
x3 = New passenger car registrations,in thousands,by state.
Data from 13 states were collected.The MINITAB regression results are:
Compute the multiple standard error of estimate (se)from the regression results.
Unlock Deck
Unlock for access to all 98 flashcards in this deck.
Unlock Deck
k this deck
32
In a regression model involving 25 observations,the following estimated regression model was obtained: = 60 + 2.8x1 + 1.2x2 - x3.For this model,SST = 600 and SSE = 150.Calculate the value of the F statistic for testing the significance of this model.
F = ____________________
= 60 + 2.8x1 + 1.2x2 - x3.For this model,SST = 600 and SSE = 150.Calculate the value of the F statistic for testing the significance of this model.F = ____________________
Unlock Deck
Unlock for access to all 98 flashcards in this deck.
Unlock Deck
k this deck
33
In a multiple regression analysis involving k independent variables and n data points,the degrees of freedom associated with the error sum of squares is:
A) k - 1.
B) n - k - 1.
C) n - 1.
D) n - k.
A) k - 1.
B) n - k - 1.
C) n - 1.
D) n - k.
Unlock Deck
Unlock for access to all 98 flashcards in this deck.
Unlock Deck
k this deck
34
A health science-kinesiology program to lose weight collected data from ten students.Sex was coded as 1 = female and 0 = male.The regression equation obtained was given by: Pounds lost = 15.8 + 0.65 time + 6.00 sex.For the same length of time in the program,compare the weight loss of a female to a male.What is your conclusion?
Unlock Deck
Unlock for access to all 98 flashcards in this deck.
Unlock Deck
k this deck
35
In a regression model involving 40 observations, the following estimated regression model was obtained = 10 + 3x1 + 5x2 + 6x3. For this model, SSR = 300 and SSE = 75. Then, the value of MSR is:
A) 100.
B) 225.
C) 25.
D) 75.
= 10 + 3x1 + 5x2 + 6x3. For this model, SSR = 300 and SSE = 75. Then, the value of MSR is:A) 100.
B) 225.
C) 25.
D) 75.
Unlock Deck
Unlock for access to all 98 flashcards in this deck.
Unlock Deck
k this deck
36
A health science-kinesiology program to lose weight collected data from ten students.Sex was coded as 1 = female and 0 = male.The regression equation obtained was given by: Pounds lost = 15.8 + 0.65 time + 6.00 sex.What is the estimated weight loss of a male who stayed in the program for 5 time periods?
Unlock Deck
Unlock for access to all 98 flashcards in this deck.
Unlock Deck
k this deck
37
The ____________________ is the proportion of the variation in y that is explained by the multiple regression equation.
Unlock Deck
Unlock for access to all 98 flashcards in this deck.
Unlock Deck
k this deck
38
In order to test the significance of a multiple regression model involving 4 independent variables and 30 observations,the numerator and denominator degrees of freedom (respectively)for the critical value of F are:
A) 4 and 30.
B) 3 and 29.
C) 4 and 25.
D) 5 and 31.
A) 4 and 30.
B) 3 and 29.
C) 4 and 25.
D) 5 and 31.
Unlock Deck
Unlock for access to all 98 flashcards in this deck.
Unlock Deck
k this deck
39
NARRBEGIN: Motor Vehicle
In order to predict motor vehicle purchases for the U.S.,the coefficients of a multiple regression equation were estimated using 25 years of data.The variables were:
y = motor vehicle purchases (billions of dollars)
x1 = disposable personal income (billions of dollars)
x2 = U.S.population (millions of persons)
x3 = automobile installment credit (billions of dollars)
Part of the results using MINITAB was:
Use the values in the analysis of variance table to compute R2 using the values for SST and SSE or SSR.
Unlock Deck
Unlock for access to all 98 flashcards in this deck.
Unlock Deck
k this deck
40
NARRBEGIN: Motor Vehicle
In order to predict motor vehicle purchases for the U.S.,the coefficients of a multiple regression equation were estimated using 25 years of data.The variables were:
y = motor vehicle purchases (billions of dollars)
x1 = disposable personal income (billions of dollars)
x2 = U.S.population (millions of persons)
x3 = automobile installment credit (billions of dollars)
Part of the results using MINITAB was:
Use the values in the analysis of variance table to compute the multiple standard error of the estimate.
Unlock Deck
Unlock for access to all 98 flashcards in this deck.
Unlock Deck
k this deck
41
NARRBEGIN: Equation
The regression equation, = 4 + 1.5x1 + 2.5x2 has been fitted to 25 data points.The means of x1 and x2 are 30 and 46,respectively.The sum of the squared differences between observed and predicted values of y has been calculated as SSE = 175,and the sum of the squared differences between y values and mean of y is SST = 525.
What is the approximate 95% confidence interval for the mean of y whenever x1 = 20 and x2 = 25.
The regression equation,
= 4 + 1.5x1 + 2.5x2 has been fitted to 25 data points.The means of x1 and x2 are 30 and 46,respectively.The sum of the squared differences between observed and predicted values of y has been calculated as SSE = 175,and the sum of the squared differences between y values and mean of y is SST = 525.What is the approximate 95% confidence interval for the mean of y whenever x1 = 20 and x2 = 25.
Unlock Deck
Unlock for access to all 98 flashcards in this deck.
Unlock Deck
k this deck
42
Consider the multiple regression equation, = 80 + 15x1 - 5 x2 + 100x3.Identify the y-intercept and partial regression coefficients:
y-intercept: ____________________
x1: ____________________
x2: ____________________
x3: ____________________
= 80 + 15x1 - 5 x2 + 100x3.Identify the y-intercept and partial regression coefficients:y-intercept: ____________________
x1: ____________________
x2: ____________________
x3: ____________________
Unlock Deck
Unlock for access to all 98 flashcards in this deck.
Unlock Deck
k this deck
43
NARRBEGIN: Grade
A statistics teacher collected the following data to determine if the number of hours a student studied during the semester and the number of classes missed could be used to predict the final grade for the course.The following table shows the results of the model being applied to 8 students.
Calculate the multiple standard error of estimate.
Unlock Deck
Unlock for access to all 98 flashcards in this deck.
Unlock Deck
k this deck
44
NARRBEGIN: Equation
The regression equation, = 4 + 1.5x1 + 2.5x2 has been fitted to 25 data points.The means of x1 and x2 are 30 and 46,respectively.The sum of the squared differences between observed and predicted values of y has been calculated as SSE = 175,and the sum of the squared differences between y values and mean of y is SST = 525.
Determine the multiple standard error of estimate.
The regression equation,
= 4 + 1.5x1 + 2.5x2 has been fitted to 25 data points.The means of x1 and x2 are 30 and 46,respectively.The sum of the squared differences between observed and predicted values of y has been calculated as SSE = 175,and the sum of the squared differences between y values and mean of y is SST = 525.Determine the multiple standard error of estimate.
Unlock Deck
Unlock for access to all 98 flashcards in this deck.
Unlock Deck
k this deck
45
NARRBEGIN: Salary
Data was collected from 40 employees to develop a regression model to predict the employee's annual salary using their years with the company (Years),their starting salary (Starting),and their Gender (Male = 0,Female = 1).The results from Excel regression analysis are shown below:
In testing the significance of the partial regression coefficient associated with the Starting variable at the 0.05 significance level,what is the appropriate conclusion?
Unlock Deck
Unlock for access to all 98 flashcards in this deck.
Unlock Deck
k this deck
46
NARRBEGIN: Regression Model
A multiple regression model was developed to predict the grade point average (GPA)for MBA students based on two entrance exam scores,verbal (VGMAT)and math (MGMAT).The following table shows the actual GPA and predicted GPA for 7 students.
Calculate the residual sum of squares.
A multiple regression model was developed to predict the grade point average (GPA)for MBA students based on two entrance exam scores,verbal (VGMAT)and math (MGMAT).The following table shows the actual GPA and predicted GPA for 7 students.
Calculate the residual sum of squares.
Unlock Deck
Unlock for access to all 98 flashcards in this deck.
Unlock Deck
k this deck
47
NARRBEGIN: Salary
Data was collected from 40 employees to develop a regression model to predict the employee's annual salary using their years with the company (Years),their starting salary (Starting),and their Gender (Male = 0,Female = 1).The results from Excel regression analysis are shown below:
In testing the significance of the partial regression coefficient associated with the Gender variable at the 0.05 significance level,what is the appropriate conclusion?
Unlock Deck
Unlock for access to all 98 flashcards in this deck.
Unlock Deck
k this deck
48
Explain each of the terms in the multiple regression model: .
. Unlock Deck
Unlock for access to all 98 flashcards in this deck.
Unlock Deck
k this deck
49
NARRBEGIN: Equation
The regression equation, = 4 + 1.5x1 + 2.5x2 has been fitted to 25 data points.The means of x1 and x2 are 30 and 46,respectively.The sum of the squared differences between observed and predicted values of y has been calculated as SSE = 175,and the sum of the squared differences between y values and mean of y is SST = 525.
What is the approximate 95% prediction interval for an individual y whenever x1 = 20 and x2 = 25?
The regression equation,
= 4 + 1.5x1 + 2.5x2 has been fitted to 25 data points.The means of x1 and x2 are 30 and 46,respectively.The sum of the squared differences between observed and predicted values of y has been calculated as SSE = 175,and the sum of the squared differences between y values and mean of y is SST = 525.What is the approximate 95% prediction interval for an individual y whenever x1 = 20 and x2 = 25?
Unlock Deck
Unlock for access to all 98 flashcards in this deck.
Unlock Deck
k this deck
50
A multiple regression model has three independent variables.The following values of y and are given: Compute the multiple standard error of the estimate.
are given: Compute the multiple standard error of the estimate. Unlock Deck
Unlock for access to all 98 flashcards in this deck.
Unlock Deck
k this deck
51
NARRBEGIN: Grade
A statistics teacher collected the following data to determine if the number of hours a student studied during the semester and the number of classes missed could be used to predict the final grade for the course.The following table shows the results of the model being applied to 8 students.
Calculate the coefficient of multiple determination.
Unlock Deck
Unlock for access to all 98 flashcards in this deck.
Unlock Deck
k this deck
52
NARRBEGIN: Salary
Data was collected from 40 employees to develop a regression model to predict the employee's annual salary using their years with the company (Years),their starting salary (Starting),and their Gender (Male = 0,Female = 1).The results from Excel regression analysis are shown below:
In testing the null hypothesis that the regression equation is not significant at the 0.05 level,what is the appropriate conclusion?
Unlock Deck
Unlock for access to all 98 flashcards in this deck.
Unlock Deck
k this deck
53
NARRBEGIN: Regression Model
A multiple regression model was developed to predict the grade point average (GPA)for MBA students based on two entrance exam scores,verbal (VGMAT)and math (MGMAT).The following table shows the actual GPA and predicted GPA for 7 students.
Calculate the coefficient of multiple determination.
A multiple regression model was developed to predict the grade point average (GPA)for MBA students based on two entrance exam scores,verbal (VGMAT)and math (MGMAT).The following table shows the actual GPA and predicted GPA for 7 students.
Calculate the coefficient of multiple determination.
Unlock Deck
Unlock for access to all 98 flashcards in this deck.
Unlock Deck
k this deck
54
Consider the multiple regression equation, = 80 + 15x1 - 5x2 + 100x3.If x3 were to increase by 5,what change would be necessary in x2 in order for the estimated value of y to remain unchanged?
x2 would ____________________ by ____________________.
= 80 + 15x1 - 5x2 + 100x3.If x3 were to increase by 5,what change would be necessary in x2 in order for the estimated value of y to remain unchanged?x2 would ____________________ by ____________________.
Unlock Deck
Unlock for access to all 98 flashcards in this deck.
Unlock Deck
k this deck
55
NARRBEGIN: Salary
Data was collected from 40 employees to develop a regression model to predict the employee's annual salary using their years with the company (Years),their starting salary (Starting),and their Gender (Male = 0,Female = 1).The results from Excel regression analysis are shown below:
In testing the significance of the partial regression coefficient associated with the Years variable at the 0.05 significance level,what is the appropriate conclusion?
Unlock Deck
Unlock for access to all 98 flashcards in this deck.
Unlock Deck
k this deck
56
NARRBEGIN: Grade
A statistics teacher collected the following data to determine if the number of hours a student studied during the semester and the number of classes missed could be used to predict the final grade for the course.The following table shows the results of the model being applied to 8 students.
Calculate the residual sum of squares.
Unlock Deck
Unlock for access to all 98 flashcards in this deck.
Unlock Deck
k this deck
57
NARRBEGIN: Salary
Data was collected from 40 employees to develop a regression model to predict the employee's annual salary using their years with the company (Years),their starting salary (Starting),and their Gender (Male = 0,Female = 1).The results from Excel regression analysis are shown below:
What is the regression equation?
Unlock Deck
Unlock for access to all 98 flashcards in this deck.
Unlock Deck
k this deck
58
A multiple regression model was developed to predict the grade point average (GPA)for MBA students based on two entrance exam scores,verbal (VGMAT)and math (MGMAT).The following table shows the actual GPA and predicted GPA for 7 students.
Calculate the multiple standard error of estimate.
Calculate the multiple standard error of estimate. Unlock Deck
Unlock for access to all 98 flashcards in this deck.
Unlock Deck
k this deck
59
NARRBEGIN: Grade
A statistics teacher collected the following data to determine if the number of hours a student studied during the semester and the number of classes missed could be used to predict the final grade for the course.The following table shows the results of the model being applied to 8 students.
Calculate the total sum of squares.
Unlock Deck
Unlock for access to all 98 flashcards in this deck.
Unlock Deck
k this deck
60
NARRBEGIN: Regression Model
A multiple regression model was developed to predict the grade point average (GPA)for MBA students based on two entrance exam scores,verbal (VGMAT)and math (MGMAT).The following table shows the actual GPA and predicted GPA for 7 students.
Calculate the total sum of squares.
A multiple regression model was developed to predict the grade point average (GPA)for MBA students based on two entrance exam scores,verbal (VGMAT)and math (MGMAT).The following table shows the actual GPA and predicted GPA for 7 students.
Calculate the total sum of squares.
Unlock Deck
Unlock for access to all 98 flashcards in this deck.
Unlock Deck
k this deck
61
NARRBEGIN: Nutritionist
A nutritionist is analyzing the cost of an 8 oz.serving of pasta.The nutritionist anticipates that cost is related to:
x1 = Grams of protein/8 oz.
x2 = Grams of carbohydrates/8 oz.
x3 = Grams of fat/8 oz.
Using MINITAB,the nutritionist obtained the following results:
From these regression results,compute a 95% prediction interval for y when x1 = 4,x2 = 5,and x3 = 3.
Unlock Deck
Unlock for access to all 98 flashcards in this deck.
Unlock Deck
k this deck
62
NARRBEGIN: Marketing Analyst
A marketing analyst is interested in predicting prospective buyer's knowledge about compact disc players.A random sample of 36 buyers was taken,a questionnaire about compact disc players completed,and information about education,income and age was obtained.In estimating the equation,the variables were:
y = knowledge about compact disc players
x1 = education (years)
x2 = age
x3 = income (thousands of dollars)
The resulting output using MINITAB was:
Identify the coefficient of multiple determination,R2.
Interpret the value.
Unlock Deck
Unlock for access to all 98 flashcards in this deck.
Unlock Deck
k this deck
63
NARRBEGIN: Professor
A statistics professor investigated some of the factors that affect an individual student's final grade in his course.He proposed the multiple regression model where:
y = final mark (out of 100)
x1 = number of lectures skipped
x2 = number of late assignments
x3 = mid-term test mark (out of 100)
The professor recorded the data for 50 randomly selected students.The computer output is shown below.
Do these data provide enough evidence at the 1% significance level to conclude that the final mark and the mid-term mark are positively linearly related?
Test statistic = ____________________
Critical Value = ____________________
Conclusion: ____________________
A statistics professor investigated some of the factors that affect an individual student's final grade in his course.He proposed the multiple regression model
where:y = final mark (out of 100)
x1 = number of lectures skipped
x2 = number of late assignments
x3 = mid-term test mark (out of 100)
The professor recorded the data for 50 randomly selected students.The computer output is shown below.
Do these data provide enough evidence at the 1% significance level to conclude that the final mark and the mid-term mark are positively linearly related?
Test statistic = ____________________
Critical Value = ____________________
Conclusion: ____________________
Unlock Deck
Unlock for access to all 98 flashcards in this deck.
Unlock Deck
k this deck
64
NARRBEGIN: States
Concern over the number of car thefts grew into a project to determine the relationship between car thefts by state and these variables:
x1 = Police per 10,000 persons,by state
x2 = Expenditure by local government for police protection,in thousands,by state
x3 = New passenger car registrations,in thousands,by state.
Data from 13 states were collected.The MINITAB regression results are:
Test the significance of the regression equation at the 0.01 level of significance.
Test statistic = ____________________
Critical Value = ____________________
Conclusion: ____________________
Unlock Deck
Unlock for access to all 98 flashcards in this deck.
Unlock Deck
k this deck
65
NARRBEGIN: Salary
Data was collected from 40 employees to develop a regression model to predict the employee's annual salary using their years with the company (Years),their starting salary (Starting),and their Gender (Male = 0,Female = 1).The results from Excel regression analysis are shown below:
For a male employee with 5 years of experience and a starting salary of $30,000,what is the approximate 95% confidence interval for his annual salary?
Unlock Deck
Unlock for access to all 98 flashcards in this deck.
Unlock Deck
k this deck
66
NARRBEGIN: States
Concern over the number of car thefts grew into a project to determine the relationship between car thefts by state and these variables:
x1 = Police per 10,000 persons,by state
x2 = Expenditure by local government for police protection,in thousands,by state
x3 = New passenger car registrations,in thousands,by state.
Data from 13 states were collected.The MINITAB regression results are:
What,if any,multicollinearity do you detect?
Unlock Deck
Unlock for access to all 98 flashcards in this deck.
Unlock Deck
k this deck
67
The computer output for the multiple regression model is shown below.However,because of a printer malfunction some of the results are not shown.These are indicated by the boldface letters a to i.Fill in the missing results (up to three decimal places). a = ____________________
b = ____________________
c = ____________________
d = ____________________
e = ____________________
f = ____________________
g = ____________________
h = ____________________
i = ____________________
is shown below.However,because of a printer malfunction some of the results are not shown.These are indicated by the boldface letters a to i.Fill in the missing results (up to three decimal places). a = ____________________b = ____________________
c = ____________________
d = ____________________
e = ____________________
f = ____________________
g = ____________________
h = ____________________
i = ____________________
Unlock Deck
Unlock for access to all 98 flashcards in this deck.
Unlock Deck
k this deck
68
NARRBEGIN: Motor Vehicle
In order to predict motor vehicle purchases for the U.S.,the coefficients of a multiple regression equation were estimated using 25 years of data.The variables were:
y = motor vehicle purchases (billions of dollars)
x1 = disposable personal income (billions of dollars)
x2 = U.S.population (millions of persons)
x3 = automobile installment credit (billions of dollars)
Part of the results using MINITAB was:
Use the values in the analysis of variance table to find MSR and MSE.
MSR = ____________________
MSE = ____________________
Unlock Deck
Unlock for access to all 98 flashcards in this deck.
Unlock Deck
k this deck
69
NARRBEGIN: Professor
A statistics professor investigated some of the factors that affect an individual student's final grade in his course.He proposed the multiple regression model where:
y = final mark (out of 100)
x1 = number of lectures skipped
x2 = number of late assignments
x3 = mid-term test mark (out of 100)
The professor recorded the data for 50 randomly selected students.The computer output is shown below.
What is the coefficient of determination?
What does this statistic tell you?
A statistics professor investigated some of the factors that affect an individual student's final grade in his course.He proposed the multiple regression model
where:y = final mark (out of 100)
x1 = number of lectures skipped
x2 = number of late assignments
x3 = mid-term test mark (out of 100)
The professor recorded the data for 50 randomly selected students.The computer output is shown below.
What is the coefficient of determination?
What does this statistic tell you?
Unlock Deck
Unlock for access to all 98 flashcards in this deck.
Unlock Deck
k this deck
70
NARRBEGIN: States
Concern over the number of car thefts grew into a project to determine the relationship between car thefts by state and these variables:
x1 = Police per 10,000 persons,by state
x2 = Expenditure by local government for police protection,in thousands,by state
x3 = New passenger car registrations,in thousands,by state.
Data from 13 states were collected.The MINITAB regression results are:
Do the partial regression coefficients have the algebraic sign you might expect?
Unlock Deck
Unlock for access to all 98 flashcards in this deck.
Unlock Deck
k this deck
71
NARRBEGIN: Marketing Analyst
A marketing analyst is interested in predicting prospective buyer's knowledge about compact disc players.A random sample of 36 buyers was taken,a questionnaire about compact disc players completed,and information about education,income and age was obtained.In estimating the equation,the variables were:
y = knowledge about compact disc players
x1 = education (years)
x2 = age
x3 = income (thousands of dollars)
The resulting output using MINITAB was:
Identify b0,b1,and b3.
b0 = ____________________
b1 = ____________________
b3 = ____________________
Unlock Deck
Unlock for access to all 98 flashcards in this deck.
Unlock Deck
k this deck
72
NARRBEGIN: Professor
A statistics professor investigated some of the factors that affect an individual student's final grade in his course.He proposed the multiple regression model where:
y = final mark (out of 100)
x1 = number of lectures skipped
x2 = number of late assignments
x3 = mid-term test mark (out of 100)
The professor recorded the data for 50 randomly selected students.The computer output is shown below.
Interpret the coefficients b1 and b3.
b1 = ____________________
Interpretation: _____________________________________________________
b3 = ____________________
Interpretation: _____________________________________________________
A statistics professor investigated some of the factors that affect an individual student's final grade in his course.He proposed the multiple regression model
where:y = final mark (out of 100)
x1 = number of lectures skipped
x2 = number of late assignments
x3 = mid-term test mark (out of 100)
The professor recorded the data for 50 randomly selected students.The computer output is shown below.
Interpret the coefficients b1 and b3.
b1 = ____________________
Interpretation: _____________________________________________________
b3 = ____________________
Interpretation: _____________________________________________________
Unlock Deck
Unlock for access to all 98 flashcards in this deck.
Unlock Deck
k this deck
73
Nutritionist
A nutritionist is analyzing the cost of an 8 oz.serving of pasta.The nutritionist anticipates that cost is related to:
x1 = Grams of protein/8 oz.
x2 = Grams of carbohydrates/8 oz.
x3 = Grams of fat/8 oz.
Using MINITAB,the nutritionist obtained the following results: The regression equation is
Analysis of Variance
-Test the significance of the regression equation at = 0.01.
Test statistic = ____________________
Critical Value = ____________________
Conclusion: ____________________
Unlock Deck
Unlock for access to all 98 flashcards in this deck.
Unlock Deck
k this deck
74
NARRBEGIN: Marketing Analyst
A marketing analyst is interested in predicting prospective buyer's knowledge about compact disc players.A random sample of 36 buyers was taken,a questionnaire about compact disc players completed,and information about education,income and age was obtained.In estimating the equation,the variables were:
y = knowledge about compact disc players
x1 = education (years)
x2 = age
x3 = income (thousands of dollars)
The resulting output using MINITAB was:
Predict the questionnaire score for a buyer who is 41 years of age,has 13 years of education,and $39,000 income.
Unlock Deck
Unlock for access to all 98 flashcards in this deck.
Unlock Deck
k this deck
75
Nutritionist
A nutritionist is analyzing the cost of an 8 oz.serving of pasta.The nutritionist anticipates that cost is related to:
x1 = Grams of protein/8 oz.
x2 = Grams of carbohydrates/8 oz.
x3 = Grams of fat/8 oz.
Using MINITAB,the nutritionist obtained the following results: The regression equation is
Analysis of Variance
-From these regression results,compute a 95% confidence interval for 1, 2,and 3.
Unlock Deck
Unlock for access to all 98 flashcards in this deck.
Unlock Deck
k this deck
76
NARRBEGIN: Professor
A statistics professor investigated some of the factors that affect an individual student's final grade in his course.He proposed the multiple regression model where:
y = final mark (out of 100)
x1 = number of lectures skipped
x2 = number of late assignments
x3 = mid-term test mark (out of 100)
The professor recorded the data for 50 randomly selected students.The computer output is shown below.
Do these data provide enough evidence to conclude at the 5% significance level that the model is useful in predicting the final mark?
Test statistic = ____________________
Critical Value = ____________________
Conclusion: ____________________
A statistics professor investigated some of the factors that affect an individual student's final grade in his course.He proposed the multiple regression model
where:y = final mark (out of 100)
x1 = number of lectures skipped
x2 = number of late assignments
x3 = mid-term test mark (out of 100)
The professor recorded the data for 50 randomly selected students.The computer output is shown below.
Do these data provide enough evidence to conclude at the 5% significance level that the model is useful in predicting the final mark?
Test statistic = ____________________
Critical Value = ____________________
Conclusion: ____________________
Unlock Deck
Unlock for access to all 98 flashcards in this deck.
Unlock Deck
k this deck
77
NARRBEGIN: Professor
A statistics professor investigated some of the factors that affect an individual student's final grade in his course.He proposed the multiple regression model where:
y = final mark (out of 100)
x1 = number of lectures skipped
x2 = number of late assignments
x3 = mid-term test mark (out of 100)
The professor recorded the data for 50 randomly selected students.The computer output is shown below.
Do these data provide enough evidence at the 5% significance level to conclude that the final mark and the number of late assignments are negatively linearly related?
Test statistic = ____________________
Critical Value = ____________________
Conclusion: ____________________
A statistics professor investigated some of the factors that affect an individual student's final grade in his course.He proposed the multiple regression model
where:y = final mark (out of 100)
x1 = number of lectures skipped
x2 = number of late assignments
x3 = mid-term test mark (out of 100)
The professor recorded the data for 50 randomly selected students.The computer output is shown below.
Do these data provide enough evidence at the 5% significance level to conclude that the final mark and the number of late assignments are negatively linearly related?
Test statistic = ____________________
Critical Value = ____________________
Conclusion: ____________________
Unlock Deck
Unlock for access to all 98 flashcards in this deck.
Unlock Deck
k this deck
78
States
Concern over the number of car thefts grew into a project to determine the relationship between car thefts by state and these variables:
x1 = Police per 10,000 persons,by state
x2 = Expenditure by local government for police protection,in thousands,by state
x3 = New passenger car registrations,in thousands,by state.
Data from 13 states were collected.The MINITAB regression results are:
The regression equation is car-thf police polexp registr
Analysis of Variance
Correlation between the variables:
-Perform a test for each partial regression coefficient using a 0.05 significance level.Results:
Conclusion: _________________________________________________________
Unlock Deck
Unlock for access to all 98 flashcards in this deck.
Unlock Deck
k this deck
79
NARRBEGIN: Professor
A statistics professor investigated some of the factors that affect an individual student's final grade in his course.He proposed the multiple regression model where:
y = final mark (out of 100)
x1 = number of lectures skipped
x2 = number of late assignments
x3 = mid-term test mark (out of 100)
The professor recorded the data for 50 randomly selected students.The computer output is shown below.
Do these data provide enough evidence to conclude at the 5% significance level that the final mark and the number of skipped lectures are linearly related?
Test statistic = ____________________
Critical Value = ____________________
Conclusion: ____________________
A statistics professor investigated some of the factors that affect an individual student's final grade in his course.He proposed the multiple regression model
where:y = final mark (out of 100)
x1 = number of lectures skipped
x2 = number of late assignments
x3 = mid-term test mark (out of 100)
The professor recorded the data for 50 randomly selected students.The computer output is shown below.
Do these data provide enough evidence to conclude at the 5% significance level that the final mark and the number of skipped lectures are linearly related?
Test statistic = ____________________
Critical Value = ____________________
Conclusion: ____________________
Unlock Deck
Unlock for access to all 98 flashcards in this deck.
Unlock Deck
k this deck
80
NARRBEGIN: Nutritionist
A nutritionist is analyzing the cost of an 8 oz.serving of pasta.The nutritionist anticipates that cost is related to:
x1 = Grams of protein/8 oz.
x2 = Grams of carbohydrates/8 oz.
x3 = Grams of fat/8 oz.
Using MINITAB,the nutritionist obtained the following results:
From these regression results,compute a 95% confidence interval for y when x1 = 4,x2 = 5,and x3 = 3.
Unlock Deck
Unlock for access to all 98 flashcards in this deck.
Unlock Deck
k this deck
Unlock Deck
Unlock for access to all 98 flashcards in this deck.


