Deck 12: Data Analysis and Interpretation: Part Iitests of Statistical Significance and the Analysis Story
Full screen (f)
Question
Use the ANOVA Summary Table to answer the question that follow: 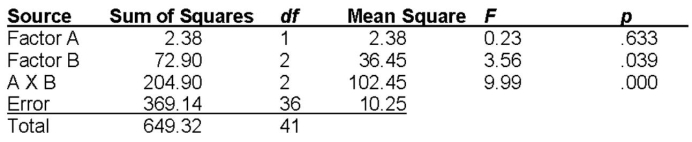
Which results are statistically significant? Explain how you arrived at this decision.
Which results are statistically significant? Explain how you arrived at this decision.
Question
Read the following research report and answer the question that follow.
A researcher compares men's and women's attitudes toward dating their best friend's former girl/boy friend.Specifically,college students are asked to read a story describing a situation in which their best friend breaks up with a partner and they later have an opportunity to date their best friend's former partner.Men and women rate the likelihood they would choose to date their best friend's former partner using a 10-point scale (0 = not at all likely and 9 = completely likely).In addition,participants rate the extent to which a similar situation has occurred to them using a 10-point scale (0 = not at all and 9 = completely).The mean ratings for each question for the two groups,men and women,are presented below:
The square root of 28 (the df)is approximately 5.3.What is Cohen's d for the difference between ratings for men and women for the question regarding the likelihood of dating? According to Cohen's criteria,how would you describe this effect?
Question
Question
Question
Question
Use the ANOVA Summary Table to answer the question that follow:  Describe the analysis that should be conducted next.
Describe the analysis that should be conducted next. Question
Question
Use the ANOVA Summary Table to answer the question that follow: 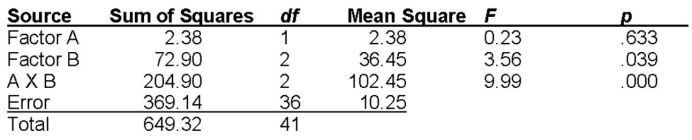 How many levels are there for Factor A and Factor B?
How many levels are there for Factor A and Factor B? Question
Question
Question
Read the following research report and answer the question that follow.
A researcher compares men's and women's attitudes toward dating their best friend's former girl/boy friend.Specifically,college students are asked to read a story describing a situation in which their best friend breaks up with a partner and they later have an opportunity to date their best friend's former partner.Men and women rate the likelihood they would choose to date their best friend's former partner using a 10-point scale (0 = not at all likely and 9 = completely likely).In addition,participants rate the extent to which a similar situation has occurred to them using a 10-point scale (0 = not at all and 9 = completely).The mean ratings for each question for the two groups,men and women,are presented below: Were the results statistically significant? Explain your decisions.
A researcher compares men's and women's attitudes toward dating their best friend's former girl/boy friend.Specifically,college students are asked to read a story describing a situation in which their best friend breaks up with a partner and they later have an opportunity to date their best friend's former partner.Men and women rate the likelihood they would choose to date their best friend's former partner using a 10-point scale (0 = not at all likely and 9 = completely likely).In addition,participants rate the extent to which a similar situation has occurred to them using a 10-point scale (0 = not at all and 9 = completely).The mean ratings for each question for the two groups,men and women,are presented below:
Were the results statistically significant? Explain your decisions. Question
Read the following research report and answer the question that follow.
A researcher compares men's and women's attitudes toward dating their best friend's former girl/boy friend.Specifically,college students are asked to read a story describing a situation in which their best friend breaks up with a partner and they later have an opportunity to date their best friend's former partner.Men and women rate the likelihood they would choose to date their best friend's former partner using a 10-point scale (0 = not at all likely and 9 = completely likely).In addition,participants rate the extent to which a similar situation has occurred to them using a 10-point scale (0 = not at all and 9 = completely).The mean ratings for each question for the two groups,men and women,are presented below: Describe whether a Type I error and whether a Type II error are possible in this study.
A researcher compares men's and women's attitudes toward dating their best friend's former girl/boy friend.Specifically,college students are asked to read a story describing a situation in which their best friend breaks up with a partner and they later have an opportunity to date their best friend's former partner.Men and women rate the likelihood they would choose to date their best friend's former partner using a 10-point scale (0 = not at all likely and 9 = completely likely).In addition,participants rate the extent to which a similar situation has occurred to them using a 10-point scale (0 = not at all and 9 = completely).The mean ratings for each question for the two groups,men and women,are presented below:
Describe whether a Type I error and whether a Type II error are possible in this study. Question
Question
Question
Question
Read the following research report and answer the question that follow.
A researcher compares men's and women's attitudes toward dating their best friend's former girl/boy friend.Specifically,college students are asked to read a story describing a situation in which their best friend breaks up with a partner and they later have an opportunity to date their best friend's former partner.Men and women rate the likelihood they would choose to date their best friend's former partner using a 10-point scale (0 = not at all likely and 9 = completely likely).In addition,participants rate the extent to which a similar situation has occurred to them using a 10-point scale (0 = not at all and 9 = completely).The mean ratings for each question for the two groups,men and women,are presented below: What do the p values associated with each t-test tell you besides whether the result is statistically significant?
A researcher compares men's and women's attitudes toward dating their best friend's former girl/boy friend.Specifically,college students are asked to read a story describing a situation in which their best friend breaks up with a partner and they later have an opportunity to date their best friend's former partner.Men and women rate the likelihood they would choose to date their best friend's former partner using a 10-point scale (0 = not at all likely and 9 = completely likely).In addition,participants rate the extent to which a similar situation has occurred to them using a 10-point scale (0 = not at all and 9 = completely).The mean ratings for each question for the two groups,men and women,are presented below:
What do the p values associated with each t-test tell you besides whether the result is statistically significant? Question
Read the following research report and answer the question that follow.
A researcher compares men's and women's attitudes toward dating their best friend's former girl/boy friend.Specifically,college students are asked to read a story describing a situation in which their best friend breaks up with a partner and they later have an opportunity to date their best friend's former partner.Men and women rate the likelihood they would choose to date their best friend's former partner using a 10-point scale (0 = not at all likely and 9 = completely likely).In addition,participants rate the extent to which a similar situation has occurred to them using a 10-point scale (0 = not at all and 9 = completely).The mean ratings for each question for the two groups,men and women,are presented below: How many men and women were there in this study (assuming equal numbers of men and women)?
A researcher compares men's and women's attitudes toward dating their best friend's former girl/boy friend.Specifically,college students are asked to read a story describing a situation in which their best friend breaks up with a partner and they later have an opportunity to date their best friend's former partner.Men and women rate the likelihood they would choose to date their best friend's former partner using a 10-point scale (0 = not at all likely and 9 = completely likely).In addition,participants rate the extent to which a similar situation has occurred to them using a 10-point scale (0 = not at all and 9 = completely).The mean ratings for each question for the two groups,men and women,are presented below:
How many men and women were there in this study (assuming equal numbers of men and women)? Question
Use the ANOVA Summary Table to answer the question that follow:  What is the total number of subjects,and assuming equal group size,how many subjects are there in each group?
What is the total number of subjects,and assuming equal group size,how many subjects are there in each group? Question
Question
Use the ANOVA Summary Table to answer the question that follow: 
What values form the numerator and denominator for the F-ratio (F-test)for each statistical effect?
What values form the numerator and denominator for the F-ratio (F-test)for each statistical effect?
Question
Question
Question
Question
Question
Question
Question
Question
Question
Question
Question
Question
Question
Question
Question
Question
Question
Question
Question
Question
Question
Question
Question
Question
Question
Question
Question
Question
Question
Question
Question
Question
Question
Question
Question
Question
Question
Question
Question
Question

Unlock Deck
Sign up to unlock the cards in this deck!
Unlock Deck
Unlock Deck
1/60
Play
Full screen (f)
Deck 12: Data Analysis and Interpretation: Part Iitests of Statistical Significance and the Analysis Story
1
Use the ANOVA Summary Table to answer the question that follow:
Which results are statistically significant? Explain how you arrived at this decision.
Which results are statistically significant? Explain how you arrived at this decision.
The main effect of Factor B and the interaction effect (A * B)are statistically significant because the probabilities associated with these effects (.039 and .000,respectively)are less than the conventional level of significance (p < .05).
2
Read the following research report and answer the question that follow.
A researcher compares men's and women's attitudes toward dating their best friend's former girl/boy friend.Specifically,college students are asked to read a story describing a situation in which their best friend breaks up with a partner and they later have an opportunity to date their best friend's former partner.Men and women rate the likelihood they would choose to date their best friend's former partner using a 10-point scale (0 = not at all likely and 9 = completely likely).In addition,participants rate the extent to which a similar situation has occurred to them using a 10-point scale (0 = not at all and 9 = completely).The mean ratings for each question for the two groups,men and women,are presented below:
The square root of 28 (the df)is approximately 5.3.What is Cohen's d for the difference between ratings for men and women for the question regarding the likelihood of dating? According to Cohen's criteria,how would you describe this effect?
The formula for computing d based on the t-statistic is 2t / df.In this example,2(2.65)= 5.3; therefore,Cohen's d = 1.0.This may be described as a large effect.
3
Null hypothesis significance testing is used to compare two means in an independent groups design.
(a)What is the null hypothesis?
(b)What is required to "reject" the null hypothesis?
(a)What is the null hypothesis?
(b)What is required to "reject" the null hypothesis?
(a)The null hypothesis when two means are compared is that the mean of the first population is the same as the mean of the second population.
(b)A "statistically significant" difference between two sample means is required to reject the null hypothesis.Specifically,it must be shown that there is a very low likelihood that a difference between the two sample means would occur by chance if the null hypothesis were true .
(b)A "statistically significant" difference between two sample means is required to reject the null hypothesis.Specifically,it must be shown that there is a very low likelihood that a difference between the two sample means would occur by chance if the null hypothesis were true .
4
The level of significance,or alpha,in psychological research is generally set at
A) .01.
B) .05.
C) .10.
D) .50.
A) .01.
B) .05.
C) .10.
D) .50.
Unlock Deck
Unlock for access to all 60 flashcards in this deck.
Unlock Deck
k this deck
5
What does NHST tell us when a "statistically significant" finding is obtained?
Unlock Deck
Unlock for access to all 60 flashcards in this deck.
Unlock Deck
k this deck
6
Use the ANOVA Summary Table to answer the question that follow: Describe the analysis that should be conducted next.
Describe the analysis that should be conducted next. Unlock Deck
Unlock for access to all 60 flashcards in this deck.
Unlock Deck
k this deck
7
(a)What is a Type I error and what is a Type II error when using NHST?
(b)Which is more common in psychological research?
(b)Which is more common in psychological research?
Unlock Deck
Unlock for access to all 60 flashcards in this deck.
Unlock Deck
k this deck
8
Use the ANOVA Summary Table to answer the question that follow: How many levels are there for Factor A and Factor B?
How many levels are there for Factor A and Factor B? Unlock Deck
Unlock for access to all 60 flashcards in this deck.
Unlock Deck
k this deck
9
The null hypothesis is the assumption that the independent variable
A) did not have an effect.
B) had an effect.
C) is a relevant variable.
D) is statistically significant.
A) did not have an effect.
B) had an effect.
C) is a relevant variable.
D) is statistically significant.
Unlock Deck
Unlock for access to all 60 flashcards in this deck.
Unlock Deck
k this deck
10
The probability we use to define a statistically significant outcome is called
A) an effect size.
B) the null hypothesis.
C) alpha.
D) a margin of error.
A) an effect size.
B) the null hypothesis.
C) alpha.
D) a margin of error.
Unlock Deck
Unlock for access to all 60 flashcards in this deck.
Unlock Deck
k this deck
11
Read the following research report and answer the question that follow.
A researcher compares men's and women's attitudes toward dating their best friend's former girl/boy friend.Specifically,college students are asked to read a story describing a situation in which their best friend breaks up with a partner and they later have an opportunity to date their best friend's former partner.Men and women rate the likelihood they would choose to date their best friend's former partner using a 10-point scale (0 = not at all likely and 9 = completely likely).In addition,participants rate the extent to which a similar situation has occurred to them using a 10-point scale (0 = not at all and 9 = completely).The mean ratings for each question for the two groups,men and women,are presented below: Were the results statistically significant? Explain your decisions.
A researcher compares men's and women's attitudes toward dating their best friend's former girl/boy friend.Specifically,college students are asked to read a story describing a situation in which their best friend breaks up with a partner and they later have an opportunity to date their best friend's former partner.Men and women rate the likelihood they would choose to date their best friend's former partner using a 10-point scale (0 = not at all likely and 9 = completely likely).In addition,participants rate the extent to which a similar situation has occurred to them using a 10-point scale (0 = not at all and 9 = completely).The mean ratings for each question for the two groups,men and women,are presented below:
Were the results statistically significant? Explain your decisions. Unlock Deck
Unlock for access to all 60 flashcards in this deck.
Unlock Deck
k this deck
12
Read the following research report and answer the question that follow.
A researcher compares men's and women's attitudes toward dating their best friend's former girl/boy friend.Specifically,college students are asked to read a story describing a situation in which their best friend breaks up with a partner and they later have an opportunity to date their best friend's former partner.Men and women rate the likelihood they would choose to date their best friend's former partner using a 10-point scale (0 = not at all likely and 9 = completely likely).In addition,participants rate the extent to which a similar situation has occurred to them using a 10-point scale (0 = not at all and 9 = completely).The mean ratings for each question for the two groups,men and women,are presented below: Describe whether a Type I error and whether a Type II error are possible in this study.
A researcher compares men's and women's attitudes toward dating their best friend's former girl/boy friend.Specifically,college students are asked to read a story describing a situation in which their best friend breaks up with a partner and they later have an opportunity to date their best friend's former partner.Men and women rate the likelihood they would choose to date their best friend's former partner using a 10-point scale (0 = not at all likely and 9 = completely likely).In addition,participants rate the extent to which a similar situation has occurred to them using a 10-point scale (0 = not at all and 9 = completely).The mean ratings for each question for the two groups,men and women,are presented below:
Describe whether a Type I error and whether a Type II error are possible in this study. Unlock Deck
Unlock for access to all 60 flashcards in this deck.
Unlock Deck
k this deck
13
Explain the difference between experimental sensitivity and statistical power and identify factors that influence each.
Unlock Deck
Unlock for access to all 60 flashcards in this deck.
Unlock Deck
k this deck
14
Briefly describe the logic of the analysis of variance or F-test for a single-factor random groups design.
Unlock Deck
Unlock for access to all 60 flashcards in this deck.
Unlock Deck
k this deck
15
Null hypothesis significance testing uses the laws of probability to estimate the likelihood of an outcome by first assuming that
A) the null hypothesis is false.
B) an effect of an independent variable is present.
C) the population means are different.
D) only chance factors caused the outcome.
A) the null hypothesis is false.
B) an effect of an independent variable is present.
C) the population means are different.
D) only chance factors caused the outcome.
Unlock Deck
Unlock for access to all 60 flashcards in this deck.
Unlock Deck
k this deck
16
Read the following research report and answer the question that follow.
A researcher compares men's and women's attitudes toward dating their best friend's former girl/boy friend.Specifically,college students are asked to read a story describing a situation in which their best friend breaks up with a partner and they later have an opportunity to date their best friend's former partner.Men and women rate the likelihood they would choose to date their best friend's former partner using a 10-point scale (0 = not at all likely and 9 = completely likely).In addition,participants rate the extent to which a similar situation has occurred to them using a 10-point scale (0 = not at all and 9 = completely).The mean ratings for each question for the two groups,men and women,are presented below: What do the p values associated with each t-test tell you besides whether the result is statistically significant?
A researcher compares men's and women's attitudes toward dating their best friend's former girl/boy friend.Specifically,college students are asked to read a story describing a situation in which their best friend breaks up with a partner and they later have an opportunity to date their best friend's former partner.Men and women rate the likelihood they would choose to date their best friend's former partner using a 10-point scale (0 = not at all likely and 9 = completely likely).In addition,participants rate the extent to which a similar situation has occurred to them using a 10-point scale (0 = not at all and 9 = completely).The mean ratings for each question for the two groups,men and women,are presented below:
What do the p values associated with each t-test tell you besides whether the result is statistically significant? Unlock Deck
Unlock for access to all 60 flashcards in this deck.
Unlock Deck
k this deck
17
Read the following research report and answer the question that follow.
A researcher compares men's and women's attitudes toward dating their best friend's former girl/boy friend.Specifically,college students are asked to read a story describing a situation in which their best friend breaks up with a partner and they later have an opportunity to date their best friend's former partner.Men and women rate the likelihood they would choose to date their best friend's former partner using a 10-point scale (0 = not at all likely and 9 = completely likely).In addition,participants rate the extent to which a similar situation has occurred to them using a 10-point scale (0 = not at all and 9 = completely).The mean ratings for each question for the two groups,men and women,are presented below: How many men and women were there in this study (assuming equal numbers of men and women)?
A researcher compares men's and women's attitudes toward dating their best friend's former girl/boy friend.Specifically,college students are asked to read a story describing a situation in which their best friend breaks up with a partner and they later have an opportunity to date their best friend's former partner.Men and women rate the likelihood they would choose to date their best friend's former partner using a 10-point scale (0 = not at all likely and 9 = completely likely).In addition,participants rate the extent to which a similar situation has occurred to them using a 10-point scale (0 = not at all and 9 = completely).The mean ratings for each question for the two groups,men and women,are presented below:
How many men and women were there in this study (assuming equal numbers of men and women)? Unlock Deck
Unlock for access to all 60 flashcards in this deck.
Unlock Deck
k this deck
18
Use the ANOVA Summary Table to answer the question that follow: What is the total number of subjects,and assuming equal group size,how many subjects are there in each group?
What is the total number of subjects,and assuming equal group size,how many subjects are there in each group? Unlock Deck
Unlock for access to all 60 flashcards in this deck.
Unlock Deck
k this deck
19
When a result is "statistically significant," why should we not immediately claim that our results are "important" (either scientifically or practically)?
Unlock Deck
Unlock for access to all 60 flashcards in this deck.
Unlock Deck
k this deck
20
Use the ANOVA Summary Table to answer the question that follow:
What values form the numerator and denominator for the F-ratio (F-test)for each statistical effect?
What values form the numerator and denominator for the F-ratio (F-test)for each statistical effect?
Unlock Deck
Unlock for access to all 60 flashcards in this deck.
Unlock Deck
k this deck
21
The appropriate inferential test when each subject participates in both conditions of an experiment is
A) a between-subjects t-test.
B) a margin of error.
C) a t-test for independent groups.
D) a repeated measures t-test.
A) a between-subjects t-test.
B) a margin of error.
C) a t-test for independent groups.
D) a repeated measures t-test.
Unlock Deck
Unlock for access to all 60 flashcards in this deck.
Unlock Deck
k this deck
22
The F-test provides a statistic that represents the ratio of between-group variation in the data to
A) sample size.
B) within-group variation.
C) total variation in the data.
D) degrees of freedom.
A) sample size.
B) within-group variation.
C) total variation in the data.
D) degrees of freedom.
Unlock Deck
Unlock for access to all 60 flashcards in this deck.
Unlock Deck
k this deck
23
If a researcher were to use a .01 level of significance rather than the .05 level,the probability of a Type I error would
A) not change.
B) decrease.
C) increase.
D) not able to tell without more information.
A) not change.
B) decrease.
C) increase.
D) not able to tell without more information.
Unlock Deck
Unlock for access to all 60 flashcards in this deck.
Unlock Deck
k this deck
24
When a finding in an experiment is statistically significant,the scientific community can be confident that
A) the experiment is free of confoundings.
B) the finding will generalize to settings beyond those studied in the experiment.
C) the finding has a low probability of occurring if the null hypothesis were true.
D) all of these
A) the experiment is free of confoundings.
B) the finding will generalize to settings beyond those studied in the experiment.
C) the finding has a low probability of occurring if the null hypothesis were true.
D) all of these
Unlock Deck
Unlock for access to all 60 flashcards in this deck.
Unlock Deck
k this deck
25
The t-test for independent groups is the appropriate inferential test when
A) a margin of error is needed for single random sample from a population.
B) comparing two means.
C) comparing more than two means.
D) calculating a correlation between groups.
A) a margin of error is needed for single random sample from a population.
B) comparing two means.
C) comparing more than two means.
D) calculating a correlation between groups.
Unlock Deck
Unlock for access to all 60 flashcards in this deck.
Unlock Deck
k this deck
26
The most frequently used inferential statistics test when comparing more than two means is
A) analysis of variance (ANOVA).
B) repeated measures t.
C) t-test for independent groups.
D) correlation coefficient, r.
A) analysis of variance (ANOVA).
B) repeated measures t.
C) t-test for independent groups.
D) correlation coefficient, r.
Unlock Deck
Unlock for access to all 60 flashcards in this deck.
Unlock Deck
k this deck
27
The probability we use to define a statistically significant outcome is equivalent to
A) a Type I error.
B) a Type II error.
C) the null hypothesis.
D) the population mean.
A) a Type I error.
B) a Type II error.
C) the null hypothesis.
D) the population mean.
Unlock Deck
Unlock for access to all 60 flashcards in this deck.
Unlock Deck
k this deck
28
When researchers have a good estimate of the expected effect size for an independent variable prior to conducting a study,they should
A) perform a power analysis.
B) compute an inferential statistics test.
C) draw confidence intervals for their means.
D) all of these
A) perform a power analysis.
B) compute an inferential statistics test.
C) draw confidence intervals for their means.
D) all of these
Unlock Deck
Unlock for access to all 60 flashcards in this deck.
Unlock Deck
k this deck
29
The degrees of freedom for a t-test for independent groups are
A) N - 1.
B) (n1 + n2) - 1.
C) (n1 + n2) - 2.
D) 2(N) - 1.
A) N - 1.
B) (n1 + n2) - 1.
C) (n1 + n2) - 2.
D) 2(N) - 1.
Unlock Deck
Unlock for access to all 60 flashcards in this deck.
Unlock Deck
k this deck
30
A result that is not "statistically significant" means that
A) the null hypothesis is definitely false and should be rejected.
B) the null hypothesis is definitely true and should be accepted.
C) we should conclude that the independent variable had no effect whatsoever.
D) without more information, we should be cautious about concluding that the independent variable did not have an effect.
Unlock Deck
Unlock for access to all 60 flashcards in this deck.
Unlock Deck
k this deck
31
Which of the following factors is not likely to be related to the power of a statistical test comparing two means?
A) whether the t- or F-statistic is used
B) sample size
C) level of significance
D) size of the treatment effect
A) whether the t- or F-statistic is used
B) sample size
C) level of significance
D) size of the treatment effect
Unlock Deck
Unlock for access to all 60 flashcards in this deck.
Unlock Deck
k this deck
32
If a researcher were to use a .01 level of significance rather than the .05 level,the probability of a Type II error would
A) not change.
B) decrease.
C) increase.
D) not able to tell without more information.
A) not change.
B) decrease.
C) increase.
D) not able to tell without more information.
Unlock Deck
Unlock for access to all 60 flashcards in this deck.
Unlock Deck
k this deck
33
A researcher plans to conduct a study to compare two groups.Based on previous research,she anticipates a medium effect size.She does a power analysis with alpha level of .05.This power analysis tells her
A) the t-test outcome and degrees of freedom she should expect.
B) Cohen's d for her study.
C) the sample size she will need to observe a statistically significant finding.
D) the practical significance of her research.
A) the t-test outcome and degrees of freedom she should expect.
B) Cohen's d for her study.
C) the sample size she will need to observe a statistically significant finding.
D) the practical significance of her research.
Unlock Deck
Unlock for access to all 60 flashcards in this deck.
Unlock Deck
k this deck
34
A researcher predicted that an independent variable would produce a difference between a treatment and a control group for the dependent variable.The statistical test resulted in a "statistically significant" difference.This finding
A) proves the null hypothesis is false.
B) supports the null hypothesis.
C) proves the researcher's hypothesis.
D) supports the researcher's hypothesis.
A) proves the null hypothesis is false.
B) supports the null hypothesis.
C) proves the researcher's hypothesis.
D) supports the researcher's hypothesis.
Unlock Deck
Unlock for access to all 60 flashcards in this deck.
Unlock Deck
k this deck
35
When deciding how to make a claim about the effect of a variable,researchers should
A) report the results of significance testing instead of measures of effect size.
B) be aware of limitations association with null hypotheses significance testing.
C) use the most complicated analysis to tease out the fullest effects.
D) not use confidence intervals.
A) report the results of significance testing instead of measures of effect size.
B) be aware of limitations association with null hypotheses significance testing.
C) use the most complicated analysis to tease out the fullest effects.
D) not use confidence intervals.
Unlock Deck
Unlock for access to all 60 flashcards in this deck.
Unlock Deck
k this deck
36
A psychologist conducts a study to test a new treatment.The effect of treatment is statistically significant; the effect size is small according to accepted criteria.When considering the practical or clinical significance of the finding,the psychologist is likely to be concerned about
A) the financial cost of implementing the treatment.
B) the external validity of the finding.
C) whether the study is free of confoundings.
D) all of these
A) the financial cost of implementing the treatment.
B) the external validity of the finding.
C) whether the study is free of confoundings.
D) all of these
Unlock Deck
Unlock for access to all 60 flashcards in this deck.
Unlock Deck
k this deck
37
The primary factor that researchers use to control the power of a statistical test is
A) the size of the treatment effect.
B) the level of significance.
C) the sample size.
D) choosing a more heterogeneous population.
A) the size of the treatment effect.
B) the level of significance.
C) the sample size.
D) choosing a more heterogeneous population.
Unlock Deck
Unlock for access to all 60 flashcards in this deck.
Unlock Deck
k this deck
38
A researcher tested a treatment and a control group in an experiment with 15 subjects in each group.Although a t-test indicated the means for the dependent variable were not statistically different,the effect size for the independent variable was .50.A power analysis revealed that the power of the study was .26.This means that
A) the difference between means in the experiment was .26.
B) the value of the t-statistic is 0.13 (.50 * .26).
C) a statistically significant outcome would be obtained in approximately 1 in 4 attempts with this sample size and effect size.
D) the probability of obtaining a statistically significant difference for this experiment is .74 (1 - .26).
Unlock Deck
Unlock for access to all 60 flashcards in this deck.
Unlock Deck
k this deck
39
Results that are "statistically significant" may not be of interest to the scientific community because
A) the study's methodology was poor.
B) the results have little external validity.
C) the treatment effect is too small to be of practical value.
D) any of these reasons
A) the study's methodology was poor.
B) the results have little external validity.
C) the treatment effect is too small to be of practical value.
D) any of these reasons
Unlock Deck
Unlock for access to all 60 flashcards in this deck.
Unlock Deck
k this deck
40
The most common error associated with null hypothesis testing in psychological research is
A) a Type I error.
B) a Type II error.
C) random sampling.
D) too much power.
A) a Type I error.
B) a Type II error.
C) random sampling.
D) too much power.
Unlock Deck
Unlock for access to all 60 flashcards in this deck.
Unlock Deck
k this deck
41
A researcher manipulated one independent variable in a complex design experiment using a random groups design and manipulated the second independent variable using a repeated measures design.The researcher's plan for data analysis should include
A) a correlation between the first and second independent variables.
B) a single-factor ANOVA for the first independent variable and a repeated measures t-test for the second independent variable.
C) a confidence interval for the overall mean for each independent variable.
D) a two-factor ANOVA for a mixed design.
Unlock Deck
Unlock for access to all 60 flashcards in this deck.
Unlock Deck
k this deck
42
When our results are "statistically significant" we know
A) the independent variable likely produced an effect on the dependent variable.
B) the direction of the effect of the independent variable.
C) the effect size between the independent and dependent variables is large.
D) all of these
A) the independent variable likely produced an effect on the dependent variable.
B) the direction of the effect of the independent variable.
C) the effect size between the independent and dependent variables is large.
D) all of these
Unlock Deck
Unlock for access to all 60 flashcards in this deck.
Unlock Deck
k this deck
43
Confidence intervals drawn around group means in a complex design provide information regarding
A) the probable pattern of population means.
B) the null hypothesis.
C) interaction effects.
D) the statistical significance of any differences among population means.
A) the probable pattern of population means.
B) the null hypothesis.
C) interaction effects.
D) the statistical significance of any differences among population means.
Unlock Deck
Unlock for access to all 60 flashcards in this deck.
Unlock Deck
k this deck
44
A common measure of effect size for the effects in a complex design using ANOVA is
A) N - 1.
B) eta squared.
C) Cohen's d.
D) Mean Square Error.
A) N - 1.
B) eta squared.
C) Cohen's d.
D) Mean Square Error.
Unlock Deck
Unlock for access to all 60 flashcards in this deck.
Unlock Deck
k this deck
45
= 7.30,p = .01.On the basis of this information we may conclude that
A) there were two independent groups in the experiment.
B) there were 42 total subjects in the experiment.
C) the results are statistically significant.
D) all of these
A) there were two independent groups in the experiment.
B) there were 42 total subjects in the experiment.
C) the results are statistically significant.
D) all of these
Unlock Deck
Unlock for access to all 60 flashcards in this deck.
Unlock Deck
k this deck
46
Suppose the omnibus analysis of variance for a 2 * 2 complex design reveals only a statistically significant main effect of one independent variable.To understand the effect of this variable the researcher should
A) compute simple main effects analyses.
B) use t-tests to compare two means at a time.
C) examine the means for the independent variable collapsed across the other independent variable.
D) all of these
A) compute simple main effects analyses.
B) use t-tests to compare two means at a time.
C) examine the means for the independent variable collapsed across the other independent variable.
D) all of these
Unlock Deck
Unlock for access to all 60 flashcards in this deck.
Unlock Deck
k this deck
47
In order to conclude whether the results of an inferential test support the research hypothesis,a researcher must
A) re-state the null hypothesis.
B) examine the descriptive (summary) statistics.
C) determine whether the mean square error is greater than zero.
D) reject probability values greater than .05.
A) re-state the null hypothesis.
B) examine the descriptive (summary) statistics.
C) determine whether the mean square error is greater than zero.
D) reject probability values greater than .05.
Unlock Deck
Unlock for access to all 60 flashcards in this deck.
Unlock Deck
k this deck
48
If the omnibus analysis of variance for a complex design reveals a statistically significant interaction effect,the source of the interaction effect may be identified using
A) null comparisons.
B) simple main effects analyses.
C) correlational analyses.
D) complex comparisons.
A) null comparisons.
B) simple main effects analyses.
C) correlational analyses.
D) complex comparisons.
Unlock Deck
Unlock for access to all 60 flashcards in this deck.
Unlock Deck
k this deck
49
The ANOVA Summary Table for a two-factor,mixed design is divided into two parts; the between subjects section and the __________ section.
A) interaction
B) within-subjects
C) eta-squared
D) correlation
A) interaction
B) within-subjects
C) eta-squared
D) correlation
Unlock Deck
Unlock for access to all 60 flashcards in this deck.
Unlock Deck
k this deck
50
The value of the F-statistic in a single-factor experiment is determined by dividing the Between-Group Mean Square by the
A) Within-Group Mean Square.
B) degrees of freedom.
C) Between-Group Sum of Squares.
D) Total Sum of Squares.
A) Within-Group Mean Square.
B) degrees of freedom.
C) Between-Group Sum of Squares.
D) Total Sum of Squares.
Unlock Deck
Unlock for access to all 60 flashcards in this deck.
Unlock Deck
k this deck
51
When reporting the results of a complex design experiment,which of the following should not be included?
A) summary statistics for cells in the design in the text, a table, or a figure
B) results for omnibus F-test, with exact probabilities
C) verbal description of any statistically significant interaction effects
D) each subject's score for each dependent variable
A) summary statistics for cells in the design in the text, a table, or a figure
B) results for omnibus F-test, with exact probabilities
C) verbal description of any statistically significant interaction effects
D) each subject's score for each dependent variable
Unlock Deck
Unlock for access to all 60 flashcards in this deck.
Unlock Deck
k this deck
52
= 7.30,p = .01.On the basis of this information we may conclude that there were _______ independent groups in this experiment.
A) two
B) three
C) four
D) five
A) two
B) three
C) four
D) five
Unlock Deck
Unlock for access to all 60 flashcards in this deck.
Unlock Deck
k this deck
53
The initial overall analysis of an experiment based on the analysis of variance is called
A) an omnibus F-test.
B) the between-within test.
C) the interaction F-test.
D) a multiple-group analysis.
A) an omnibus F-test.
B) the between-within test.
C) the interaction F-test.
D) a multiple-group analysis.
Unlock Deck
Unlock for access to all 60 flashcards in this deck.
Unlock Deck
k this deck
54
The expected value of the F-statistic when the null hypothesis is true is ________.
A) 0.0
B) .05
C) .50
D) 1.00
A) 0.0
B) .05
C) .50
D) 1.00
Unlock Deck
Unlock for access to all 60 flashcards in this deck.
Unlock Deck
k this deck
55
In general,a repeated measures design is likely to be ________ than a random groups design.
A) less systematic
B) less powerful
C) more sensitive
D) more accurate
A) less systematic
B) less powerful
C) more sensitive
D) more accurate
Unlock Deck
Unlock for access to all 60 flashcards in this deck.
Unlock Deck
k this deck
56
The results of an omnibus F-test for a complex design experiment allow the researcher to
A) know whether the interaction effects and main effects are statistically significant.
B) interpret whether the pattern of means supports the hypotheses.
C) know whether the effects in the experiment are linear.
D) know which means in the experiment differ significantly from one another.
A) know whether the interaction effects and main effects are statistically significant.
B) interpret whether the pattern of means supports the hypotheses.
C) know whether the effects in the experiment are linear.
D) know which means in the experiment differ significantly from one another.
Unlock Deck
Unlock for access to all 60 flashcards in this deck.
Unlock Deck
k this deck
57
The primary way that analysis of variance for repeated measures differs from that for an independent groups design is in the estimation of
A) between-group variation.
B) variability between means.
C) systematic variation.
D) error variation.
A) between-group variation.
B) variability between means.
C) systematic variation.
D) error variation.
Unlock Deck
Unlock for access to all 60 flashcards in this deck.
Unlock Deck
k this deck
58
If the omnibus analyses of variance for a complex design reveals a statistically significant interaction effect,the source of the interaction effect may be identified using simple main effects analysis and,when there are more than two levels of an independent variable,also
A) complex comparisons.
B) null comparisons.
C) simple correlations between variables.
D) comparisons between two means.
A) complex comparisons.
B) null comparisons.
C) simple correlations between variables.
D) comparisons between two means.
Unlock Deck
Unlock for access to all 60 flashcards in this deck.
Unlock Deck
k this deck
59
Two measures of effect size for an independent groups design with more than two means are
A) the t-test and the F-test.
B) Cohen's d and the F-test.
C) eta-squared and Cohen's f.
D) F squared and rho.
A) the t-test and the F-test.
B) Cohen's d and the F-test.
C) eta-squared and Cohen's f.
D) F squared and rho.
Unlock Deck
Unlock for access to all 60 flashcards in this deck.
Unlock Deck
k this deck
60
Following an omnibus F-test,a researcher may learn about specific sources of systematic variation in a single-factor independent groups experiment by performing
A) comparisons of two means.
B) repeated measures t-tests.
C) correlation coefficients.
D) simple main effects.
A) comparisons of two means.
B) repeated measures t-tests.
C) correlation coefficients.
D) simple main effects.
Unlock Deck
Unlock for access to all 60 flashcards in this deck.
Unlock Deck
k this deck
Unlock Deck
Unlock for access to all 60 flashcards in this deck.


