Deck 29: Multiple Regression
Full screen (f)
Question
A company has undertaken a study of 16 secretaries' yearly salaries (in thousands of dollars).They want to predict salaries from several other variables.
The variables considered to be potential predictors of salary are:
X1 = months of service
X2 = years of education
X3 = score on standardized test
X4 = words per minute of typing speed
X5 = ability to take dictation in words per minute
A multiple regression model with all five variables was run,resulting in the following output: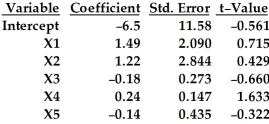

= 0.958
Interpret the R-squared value of 95.8%.
A)The average correlation between X1,X2,X3,X4,and X5 is 0.975.
B)95.8% of all samples would result in a useful model.
C)95.8% of all salaries can be accurately predicted by this model.
D)The average correlation between X1,X2,X3,X4,and X5 is 0.958.
E)95.8% of the observed variation in salaries can be explained by this model.
The variables considered to be potential predictors of salary are:
X1 = months of service
X2 = years of education
X3 = score on standardized test
X4 = words per minute of typing speed
X5 = ability to take dictation in words per minute
A multiple regression model with all five variables was run,resulting in the following output:
= 0.958
Interpret the R-squared value of 95.8%.
A)The average correlation between X1,X2,X3,X4,and X5 is 0.975.
B)95.8% of all samples would result in a useful model.
C)95.8% of all salaries can be accurately predicted by this model.
D)The average correlation between X1,X2,X3,X4,and X5 is 0.958.
E)95.8% of the observed variation in salaries can be explained by this model.
Question
Question
Use the following computer data,which refers to bear measurements,to answer the question.
Dependent variable is Weight
S = 32.49 R-Sq = 96.9% R-Sq (adj)= 94.6%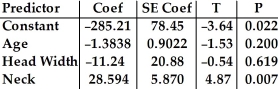
Analysis of Variance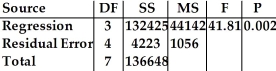
Write the equation of the regression model.
A)Weight = -285.21 - 1.3838 Age - 11.24 Head Width + 28.594 Neck
B)Weight = 78.45 - 0.9022 Age - 20.88 Head Width + 5.870 Neck
C)Weight = 132425- 44142 Age - 41.81 Head Width + 0.002 Neck
D)Weight = -285.21 + 78.45 Age - 3.64 Head Width + 0.022 Neck
E)Weight = -3.64 - 1.53 Age - 0.54 Head Width + 4.87 Neck
Question
A company has undertaken a study of 16 secretaries' yearly salaries (in thousands of dollars).They want to predict salaries from several other variables.
The variables considered to be potential predictors of salary are:
X1 = months of service
X2 = years of education
X3 = score on standardized test
X4 = words per minute of typing speed
X5 = ability to take dictation in words per minute
A multiple regression model with all five variables was run,resulting in the following output:
= 0.958
Which measurement is the best predictor of salary,after allowing for the linear effects of the other variables in the model?
A)months of service
B)words per minute of typing speed
C)score on standardized test
D)years of education
E)ability to take dictation in words per minute
Question
A company has undertaken a study of 16 secretaries' yearly salaries (in thousands of dollars).They want to predict salaries from several other variables.
The variables considered to be potential predictors of salary are:
X1 = months of service
X2 = years of education
X3 = score on standardized test
X4 = words per minute of typing speed
X5 = ability to take dictation in words per minute
A multiple regression model with all five variables was run,resulting in the following output:
= 0.958
What is the regression equation?
A)salary = 11.58 + 2.090 service + 2.844 education + 0.273 test score + 0.147 typing speed + 0.435 dictation speed
B)salary = -6.5 + 1.49 service + 1.22 education - 0.18 test score + 0.24 typing speed - 0.14 dictation speed
C)salary = 6.5 - 1.49 service - 1.22 education + 0.18 test score - 0.24 typing speed + 0.14 dictation speed
D)salary = 11.58 - 2.090 service - 2.844 education - 0.273 test score - 0.147 typing speed - 0.435 dictation speed
E)salary = -0.561 + 0.715 service + 0.429 education - 0.66 test score + 1.363 typing speed - 0.322 dictation speed
Question
Use the following computer data,which refers to bear measurements,to answer the question.
Dependent variable is Weight
S = 32.49 R-Sq = 96.9% R-Sq (adj)= 94.6%
Analysis of Variance
Which measurement is the best predictor of weight,after allowing for the linear effects of the other variables in the model?
A)Age
B)Sex
C)Length
D)Neck
E)Head Width
Dependent variable is Weight
S = 32.49 R-Sq = 96.9% R-Sq (adj)= 94.6%
Analysis of Variance
Which measurement is the best predictor of weight,after allowing for the linear effects of the other variables in the model?
A)Age
B)Sex
C)Length
D)Neck
E)Head Width
Question
Question
A company has undertaken a study to predict the calorie content of a serving of breakfast cereal based on protein,fat,fibre,carbohydrates,and sugar content (all in grams).Measurements were taken from 77 different breakfast cereals.A multiple regression model with all five variables was run,resulting in the following output: 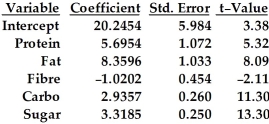

= 0.845
What is the regression equation?
A)calories = 5.984 + 1.072 protein +1.033 fat + 0.454 fibre +0.260 carbohydrates + 0.250 sugar
B)calories = 20.2454 + 1.072 protein +8.09 fat + 0.454 fibre +11.30 carbohydrates + 0.250 sugar
C)calories = 3.38 + 5.32 protein +8.09 fat - 2.11 fibre +11.30 carbohydrates + 13.30 sugar
D)calories = 5.984 + 5.32 protein +1.033 fat - 2.11 fibre +0.260 carbohydrates + 13.30 sugar
E)calories = 20.2454 + 5.6954 protein + 8.3596 fat - 1.0202 fibre + 2.9357 carbohydrates + 3.3185 sugar
Question
A company has undertaken a study to predict the calorie content of a serving of breakfast cereal based on protein,fat,fibre,carbohydrates,and sugar content (all in grams).Measurements were taken from 77 different breakfast cereals.A multiple regression model with all five variables was run,resulting in the following output:
= 0.845
Interpret the R-squared value of 84.5%.
A)84.5% of all calorie contents can be accurately predicted by this model.
B)The average correlation between protein,fat,fibre,carbohydrates,and sugar is 0.845.
C)The average correlation between protein,fat,fibre,carbohydrates,and sugar is 0.919.
D)84.5% of all samples would result in a useful model.
E)84.5% of the observed variation in calorie content can be explained by this model.
Question
An anti-smoking group used data in the table to relate the carbon monoxide output of various brands of cigarettes to their tar and nicotine content. 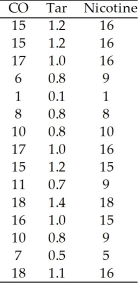
A)CO = 1.25 + 1.55 Tar - 5.79 Nicotine
B)CO = 1.38 - 5.53 Tar + 1.33 Nicotine
C)CO = 1.38 + 5.50 Tar - 1.38 Nicotine
D)CO = 1.27 - 5.53 Tar + 5.79 Nicotine
E)CO = 1.30 + 5.50 Tar - 1.33 Nicotine
A)CO = 1.25 + 1.55 Tar - 5.79 Nicotine
B)CO = 1.38 - 5.53 Tar + 1.33 Nicotine
C)CO = 1.38 + 5.50 Tar - 1.38 Nicotine
D)CO = 1.27 - 5.53 Tar + 5.79 Nicotine
E)CO = 1.30 + 5.50 Tar - 1.33 Nicotine
Question
A health specialist gathered the data in the table to see if pulse rates can be explained by exercise,smoking,and age.For exercise,he assigns 1 for yes,2 for no.For smoking,he assigns 1 for yes,2 for no. 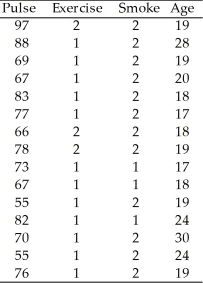
A)Pulse = 58.04 + 10.57 Exercise - 3.77 Smoke + 0.47 Age
B)Pulse = 24.1 + 8.15 Exercise + 6.33 Smoke + 0.83 Age
C)Pulse = 37.3 + 9.24 Exercise + 1.15 Smoke + 1.2 Age
D)Pulse = 58.04 + 10.57 Exercise + 3.77 Smoke + 0.47 Age
E)Pulse = 37.3 + 9.4 Exercise + 1.6 Smoke + 1.2 Age
A)Pulse = 58.04 + 10.57 Exercise - 3.77 Smoke + 0.47 Age
B)Pulse = 24.1 + 8.15 Exercise + 6.33 Smoke + 0.83 Age
C)Pulse = 37.3 + 9.24 Exercise + 1.15 Smoke + 1.2 Age
D)Pulse = 58.04 + 10.57 Exercise + 3.77 Smoke + 0.47 Age
E)Pulse = 37.3 + 9.4 Exercise + 1.6 Smoke + 1.2 Age
Question
A visitor to Yellowstone National Park in Wyoming,U.S.A,sat down one day and observed Old Faithful,which faithfully erupts throughout the day,day in and day out.He surmised that the height of a given eruption was caused by the pressure buildup during the interval between eruptions and by the momentum buildup during the duration of the eruption.He wrote down the data to test his hypothesis,but he didn't know what to do with his data. 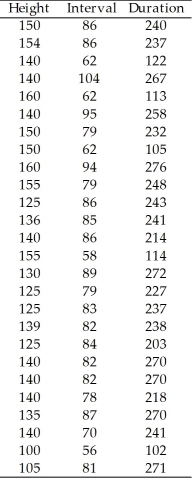
A)Height = 125.1 + 0.36 Interval - 0.89 Duration
B)Height = 24.8 + 0.53 Interval - 0.11 Duration
C)Height = 126.3 + 0.37 Interval - 0.079 Duration
D)Height = 126.3 + 0.73 Interval - 0.11 Duration
E)Height = 25.1 + 0.73 Interval - 0.62 Duration
A)Height = 125.1 + 0.36 Interval - 0.89 Duration
B)Height = 24.8 + 0.53 Interval - 0.11 Duration
C)Height = 126.3 + 0.37 Interval - 0.079 Duration
D)Height = 126.3 + 0.73 Interval - 0.11 Duration
E)Height = 25.1 + 0.73 Interval - 0.62 Duration
Question
Use the following computer data,which refers to bear measurements,to answer the question.
Dependent variable is Weight
S = 32.49 R-Sq = 96.9% R-Sq (adj)= 94.6%
Analysis of Variance
How much of the variation in bear measurements is explained by the model?
A)2.22%
B)96.9%
C)94.6%
D)20%
E)61.9%
Dependent variable is Weight
S = 32.49 R-Sq = 96.9% R-Sq (adj)= 94.6%
Analysis of Variance
How much of the variation in bear measurements is explained by the model?
A)2.22%
B)96.9%
C)94.6%
D)20%
E)61.9%
Question
Question
Use the following computer data,which refers to bear measurements,to answer the question.
Dependent variable is Weight
S = 32.49 R-Sq = 96.9% R-Sq (adj)= 94.6%
Analysis of Variance
Which measurement is the worst predictor of weight,after allowing for the linear effects of the other variables in the model?
A)Neck
B)Age
C)Head Width
D)Length
E)Sex
Dependent variable is Weight
S = 32.49 R-Sq = 96.9% R-Sq (adj)= 94.6%
Analysis of Variance
Which measurement is the worst predictor of weight,after allowing for the linear effects of the other variables in the model?
A)Neck
B)Age
C)Head Width
D)Length
E)Sex
Question
A company has undertaken a study of 16 secretaries' yearly salaries (in thousands of dollars).They want to predict salaries from several other variables.
The variables considered to be potential predictors of salary are:
X1 = months of service
X2 = years of education
X3 = score on standardized test
X4 = words per minute of typing speed
X5 = ability to take dictation in words per minute
A multiple regression model with all five variables was run,resulting in the following output:
= 0.958
Which measurement is the worst predictor of salary,after allowing for the linear effects of the other variables in the model?
A)months of service
B)words per minute of typing speed
C)ability to take dictation in words per minute
D)score on standardized test
E)years of education
Question
Question
A company has undertaken a study to predict the calorie content of a serving of breakfast cereal based on protein,fat,fibre,carbohydrates,and sugar content (all in grams).Measurements were taken from 77 different breakfast cereals.A multiple regression model with all five variables was run,resulting in the following output:
= 0.845
From this model,what is the predicted calorie content of a serving of breakfast cereal which contains 10 g of protein,3 g of fat,6 g of fibre,14 g of carbohydrates,and 2 g of sugar?
A)203 calories
B)144 calories
C)183 calories
D)98 calories
E)111 calories
= 0.845
From this model,what is the predicted calorie content of a serving of breakfast cereal which contains 10 g of protein,3 g of fat,6 g of fibre,14 g of carbohydrates,and 2 g of sugar?
A)203 calories
B)144 calories
C)183 calories
D)98 calories
E)111 calories
Question
Question
A company has undertaken a study of 16 secretaries' yearly salaries (in thousands of dollars).They want to predict salaries from several other variables.
The variables considered to be potential predictors of salary are:
X1 = months of service
X2 = years of education
X3 = score on standardized test
X4 = words per minute of typing speed
X5 = ability to take dictation in words per minute
A multiple regression model with all five variables was run,resulting in the following output:
= 0.958
From this model,what is the predicted salary of a secretary with 2.5 years (30 months)experience,10th grade education (10 years of education),an 80 on the standardized test,45 wpm typing speed,and the ability to take 30 wpm dictation?
A)$47,371
B)$24,054
C)$75,431
D)$144,225
E)$42,600
Question
A company has undertaken a study to predict the calorie content of a serving of breakfast cereal based on protein,fat,fibre,carbohydrates,and sugar content (all in grams).Measurements were taken from 77 different breakfast cereals.A multiple regression model with all five variables was run,resulting in the following output:
= 0.845
Which measurement is the worst predictor of calorie content,after allowing for the linear effects of the other variables in the model?
A)sugar
B)carbohydrates
C)protein
D)fat
E)fibre
= 0.845
Which measurement is the worst predictor of calorie content,after allowing for the linear effects of the other variables in the model?
A)sugar
B)carbohydrates
C)protein
D)fat
E)fibre
Question
A company has undertaken a study to predict the calorie content of a serving of breakfast cereal based on protein,fat,fibre,carbohydrates,and sugar content (all in grams).Measurements were taken from 77 different breakfast cereals.A multiple regression model with all five variables was run,resulting in the following output:
= 0.845
Which measurement is the best predictor of calorie content,after allowing for the linear effects of the other variables in the model?
A)protein
B)sugar
C)carbohydrates
D)fat
E)fibre
= 0.845
Which measurement is the best predictor of calorie content,after allowing for the linear effects of the other variables in the model?
A)protein
B)sugar
C)carbohydrates
D)fat
E)fibre

Unlock Deck
Sign up to unlock the cards in this deck!
Unlock Deck
Unlock Deck
1/22
Play
Full screen (f)
Deck 29: Multiple Regression
1
A company has undertaken a study of 16 secretaries' yearly salaries (in thousands of dollars).They want to predict salaries from several other variables.
The variables considered to be potential predictors of salary are:
X1 = months of service
X2 = years of education
X3 = score on standardized test
X4 = words per minute of typing speed
X5 = ability to take dictation in words per minute
A multiple regression model with all five variables was run,resulting in the following output:
= 0.958
Interpret the R-squared value of 95.8%.
A)The average correlation between X1,X2,X3,X4,and X5 is 0.975.
B)95.8% of all samples would result in a useful model.
C)95.8% of all salaries can be accurately predicted by this model.
D)The average correlation between X1,X2,X3,X4,and X5 is 0.958.
E)95.8% of the observed variation in salaries can be explained by this model.
95.8% of the observed variation in salaries can be explained by this model.
2
Every extra metre of the length adds 5.2 kg to the average weight.
A)This is not correct.Every extra foot of the length adds 5.2 kg to the average weight,for a given chest size and sex.
B)This is correct.
C)This is not correct.Weight,the response variable,does not effect length.
D)This is not correct.Length does not effect weight.
E)This is not correct.Every extra inch of the length adds 3.6 pounds to the average weight.
This is correct.
3
Use the following computer data,which refers to bear measurements,to answer the question.
Dependent variable is Weight
S = 32.49 R-Sq = 96.9% R-Sq (adj)= 94.6%
Analysis of Variance
Write the equation of the regression model.
A)Weight = -285.21 - 1.3838 Age - 11.24 Head Width + 28.594 Neck
B)Weight = 78.45 - 0.9022 Age - 20.88 Head Width + 5.870 Neck
C)Weight = 132425- 44142 Age - 41.81 Head Width + 0.002 Neck
D)Weight = -285.21 + 78.45 Age - 3.64 Head Width + 0.022 Neck
E)Weight = -3.64 - 1.53 Age - 0.54 Head Width + 4.87 Neck
Weight = -285.21 - 1.3838 Age - 11.24 Head Width + 28.594 Neck
4
A company has undertaken a study of 16 secretaries' yearly salaries (in thousands of dollars).They want to predict salaries from several other variables.
The variables considered to be potential predictors of salary are:
X1 = months of service
X2 = years of education
X3 = score on standardized test
X4 = words per minute of typing speed
X5 = ability to take dictation in words per minute
A multiple regression model with all five variables was run,resulting in the following output:
= 0.958
Which measurement is the best predictor of salary,after allowing for the linear effects of the other variables in the model?
A)months of service
B)words per minute of typing speed
C)score on standardized test
D)years of education
E)ability to take dictation in words per minute
Unlock Deck
Unlock for access to all 22 flashcards in this deck.
Unlock Deck
k this deck
5
A company has undertaken a study of 16 secretaries' yearly salaries (in thousands of dollars).They want to predict salaries from several other variables.
The variables considered to be potential predictors of salary are:
X1 = months of service
X2 = years of education
X3 = score on standardized test
X4 = words per minute of typing speed
X5 = ability to take dictation in words per minute
A multiple regression model with all five variables was run,resulting in the following output:
= 0.958
What is the regression equation?
A)salary = 11.58 + 2.090 service + 2.844 education + 0.273 test score + 0.147 typing speed + 0.435 dictation speed
B)salary = -6.5 + 1.49 service + 1.22 education - 0.18 test score + 0.24 typing speed - 0.14 dictation speed
C)salary = 6.5 - 1.49 service - 1.22 education + 0.18 test score - 0.24 typing speed + 0.14 dictation speed
D)salary = 11.58 - 2.090 service - 2.844 education - 0.273 test score - 0.147 typing speed - 0.435 dictation speed
E)salary = -0.561 + 0.715 service + 0.429 education - 0.66 test score + 1.363 typing speed - 0.322 dictation speed
Unlock Deck
Unlock for access to all 22 flashcards in this deck.
Unlock Deck
k this deck
6
Use the following computer data,which refers to bear measurements,to answer the question.
Dependent variable is Weight
S = 32.49 R-Sq = 96.9% R-Sq (adj)= 94.6%
Analysis of Variance
Which measurement is the best predictor of weight,after allowing for the linear effects of the other variables in the model?
A)Age
B)Sex
C)Length
D)Neck
E)Head Width
Dependent variable is Weight
S = 32.49 R-Sq = 96.9% R-Sq (adj)= 94.6%
Analysis of Variance
Which measurement is the best predictor of weight,after allowing for the linear effects of the other variables in the model?
A)Age
B)Sex
C)Length
D)Neck
E)Head Width
Unlock Deck
Unlock for access to all 22 flashcards in this deck.
Unlock Deck
k this deck
7
This model fits 96% of the data points exactly.
A)This is not correct.This model fits 48% of the data points exactly.
B)This is not correct.This model fits 100% of the data points exactly.
C)This is not correct.R2 gives the fraction of variability,not the fraction of data values.
D)This is correct.
E)This is not correct.R2 is a measure of the straightness of the regression.
Unlock Deck
Unlock for access to all 22 flashcards in this deck.
Unlock Deck
k this deck
8
A company has undertaken a study to predict the calorie content of a serving of breakfast cereal based on protein,fat,fibre,carbohydrates,and sugar content (all in grams).Measurements were taken from 77 different breakfast cereals.A multiple regression model with all five variables was run,resulting in the following output:
= 0.845
What is the regression equation?
A)calories = 5.984 + 1.072 protein +1.033 fat + 0.454 fibre +0.260 carbohydrates + 0.250 sugar
B)calories = 20.2454 + 1.072 protein +8.09 fat + 0.454 fibre +11.30 carbohydrates + 0.250 sugar
C)calories = 3.38 + 5.32 protein +8.09 fat - 2.11 fibre +11.30 carbohydrates + 13.30 sugar
D)calories = 5.984 + 5.32 protein +1.033 fat - 2.11 fibre +0.260 carbohydrates + 13.30 sugar
E)calories = 20.2454 + 5.6954 protein + 8.3596 fat - 1.0202 fibre + 2.9357 carbohydrates + 3.3185 sugar
Unlock Deck
Unlock for access to all 22 flashcards in this deck.
Unlock Deck
k this deck
9
A company has undertaken a study to predict the calorie content of a serving of breakfast cereal based on protein,fat,fibre,carbohydrates,and sugar content (all in grams).Measurements were taken from 77 different breakfast cereals.A multiple regression model with all five variables was run,resulting in the following output:
= 0.845
Interpret the R-squared value of 84.5%.
A)84.5% of all calorie contents can be accurately predicted by this model.
B)The average correlation between protein,fat,fibre,carbohydrates,and sugar is 0.845.
C)The average correlation between protein,fat,fibre,carbohydrates,and sugar is 0.919.
D)84.5% of all samples would result in a useful model.
E)84.5% of the observed variation in calorie content can be explained by this model.
Unlock Deck
Unlock for access to all 22 flashcards in this deck.
Unlock Deck
k this deck
10
An anti-smoking group used data in the table to relate the carbon monoxide output of various brands of cigarettes to their tar and nicotine content.
A)CO = 1.25 + 1.55 Tar - 5.79 Nicotine
B)CO = 1.38 - 5.53 Tar + 1.33 Nicotine
C)CO = 1.38 + 5.50 Tar - 1.38 Nicotine
D)CO = 1.27 - 5.53 Tar + 5.79 Nicotine
E)CO = 1.30 + 5.50 Tar - 1.33 Nicotine
A)CO = 1.25 + 1.55 Tar - 5.79 Nicotine
B)CO = 1.38 - 5.53 Tar + 1.33 Nicotine
C)CO = 1.38 + 5.50 Tar - 1.38 Nicotine
D)CO = 1.27 - 5.53 Tar + 5.79 Nicotine
E)CO = 1.30 + 5.50 Tar - 1.33 Nicotine
Unlock Deck
Unlock for access to all 22 flashcards in this deck.
Unlock Deck
k this deck
11
A health specialist gathered the data in the table to see if pulse rates can be explained by exercise,smoking,and age.For exercise,he assigns 1 for yes,2 for no.For smoking,he assigns 1 for yes,2 for no.
A)Pulse = 58.04 + 10.57 Exercise - 3.77 Smoke + 0.47 Age
B)Pulse = 24.1 + 8.15 Exercise + 6.33 Smoke + 0.83 Age
C)Pulse = 37.3 + 9.24 Exercise + 1.15 Smoke + 1.2 Age
D)Pulse = 58.04 + 10.57 Exercise + 3.77 Smoke + 0.47 Age
E)Pulse = 37.3 + 9.4 Exercise + 1.6 Smoke + 1.2 Age
A)Pulse = 58.04 + 10.57 Exercise - 3.77 Smoke + 0.47 Age
B)Pulse = 24.1 + 8.15 Exercise + 6.33 Smoke + 0.83 Age
C)Pulse = 37.3 + 9.24 Exercise + 1.15 Smoke + 1.2 Age
D)Pulse = 58.04 + 10.57 Exercise + 3.77 Smoke + 0.47 Age
E)Pulse = 37.3 + 9.4 Exercise + 1.6 Smoke + 1.2 Age
Unlock Deck
Unlock for access to all 22 flashcards in this deck.
Unlock Deck
k this deck
12
A visitor to Yellowstone National Park in Wyoming,U.S.A,sat down one day and observed Old Faithful,which faithfully erupts throughout the day,day in and day out.He surmised that the height of a given eruption was caused by the pressure buildup during the interval between eruptions and by the momentum buildup during the duration of the eruption.He wrote down the data to test his hypothesis,but he didn't know what to do with his data.
A)Height = 125.1 + 0.36 Interval - 0.89 Duration
B)Height = 24.8 + 0.53 Interval - 0.11 Duration
C)Height = 126.3 + 0.37 Interval - 0.079 Duration
D)Height = 126.3 + 0.73 Interval - 0.11 Duration
E)Height = 25.1 + 0.73 Interval - 0.62 Duration
A)Height = 125.1 + 0.36 Interval - 0.89 Duration
B)Height = 24.8 + 0.53 Interval - 0.11 Duration
C)Height = 126.3 + 0.37 Interval - 0.079 Duration
D)Height = 126.3 + 0.73 Interval - 0.11 Duration
E)Height = 25.1 + 0.73 Interval - 0.62 Duration
Unlock Deck
Unlock for access to all 22 flashcards in this deck.
Unlock Deck
k this deck
13
Use the following computer data,which refers to bear measurements,to answer the question.
Dependent variable is Weight
S = 32.49 R-Sq = 96.9% R-Sq (adj)= 94.6%
Analysis of Variance
How much of the variation in bear measurements is explained by the model?
A)2.22%
B)96.9%
C)94.6%
D)20%
E)61.9%
Dependent variable is Weight
S = 32.49 R-Sq = 96.9% R-Sq (adj)= 94.6%
Analysis of Variance
How much of the variation in bear measurements is explained by the model?
A)2.22%
B)96.9%
C)94.6%
D)20%
E)61.9%
Unlock Deck
Unlock for access to all 22 flashcards in this deck.
Unlock Deck
k this deck
14
Every extra centimetre of the chest adds 2.2 kg to the average weight,for a given length and sex.
A)This is not correct.Weight,the response variable,does not effect the predictors.
B)This is correct.
C)This is not correct.Specific values for the other predictors are not given.
D)This is not correct.Every extra centimetres of the chest adds 2.2 kg to the average weight,for any length and sex.
E)This is not correct.Chest size does not effect weight.
Unlock Deck
Unlock for access to all 22 flashcards in this deck.
Unlock Deck
k this deck
15
Use the following computer data,which refers to bear measurements,to answer the question.
Dependent variable is Weight
S = 32.49 R-Sq = 96.9% R-Sq (adj)= 94.6%
Analysis of Variance
Which measurement is the worst predictor of weight,after allowing for the linear effects of the other variables in the model?
A)Neck
B)Age
C)Head Width
D)Length
E)Sex
Dependent variable is Weight
S = 32.49 R-Sq = 96.9% R-Sq (adj)= 94.6%
Analysis of Variance
Which measurement is the worst predictor of weight,after allowing for the linear effects of the other variables in the model?
A)Neck
B)Age
C)Head Width
D)Length
E)Sex
Unlock Deck
Unlock for access to all 22 flashcards in this deck.
Unlock Deck
k this deck
16
A company has undertaken a study of 16 secretaries' yearly salaries (in thousands of dollars).They want to predict salaries from several other variables.
The variables considered to be potential predictors of salary are:
X1 = months of service
X2 = years of education
X3 = score on standardized test
X4 = words per minute of typing speed
X5 = ability to take dictation in words per minute
A multiple regression model with all five variables was run,resulting in the following output:
= 0.958
Which measurement is the worst predictor of salary,after allowing for the linear effects of the other variables in the model?
A)months of service
B)words per minute of typing speed
C)ability to take dictation in words per minute
D)score on standardized test
E)years of education
Unlock Deck
Unlock for access to all 22 flashcards in this deck.
Unlock Deck
k this deck
17
Every extra kilogram of weight means an increase of 5.2 metres in length.
A)This is not correct.Every extra kilogram of weight means an increase on average of 5.2 metres in length.
B)This is not correct.Every extra kilogram of weight means an increase of 5.2 metres in length and an increase of 2.2 centimetres in chest size.
C)This is not correct.Weight,the response variable,does not effect the predictors.
D)This is correct.
E)This is not correct.Weight,a predictor,does not effect the response variables.
Unlock Deck
Unlock for access to all 22 flashcards in this deck.
Unlock Deck
k this deck
18
A company has undertaken a study to predict the calorie content of a serving of breakfast cereal based on protein,fat,fibre,carbohydrates,and sugar content (all in grams).Measurements were taken from 77 different breakfast cereals.A multiple regression model with all five variables was run,resulting in the following output:
= 0.845
From this model,what is the predicted calorie content of a serving of breakfast cereal which contains 10 g of protein,3 g of fat,6 g of fibre,14 g of carbohydrates,and 2 g of sugar?
A)203 calories
B)144 calories
C)183 calories
D)98 calories
E)111 calories
= 0.845
From this model,what is the predicted calorie content of a serving of breakfast cereal which contains 10 g of protein,3 g of fat,6 g of fibre,14 g of carbohydrates,and 2 g of sugar?
A)203 calories
B)144 calories
C)183 calories
D)98 calories
E)111 calories
Unlock Deck
Unlock for access to all 22 flashcards in this deck.
Unlock Deck
k this deck
19
What does the coefficient of neck mean?
A)For every measurement unit of the neck,all other measurements will increase by 28.594 units.
B)For every measurement unit of the neck,the average head width will decrease by -11.24 units.
C)For every measurement unit of the neck,the average weight will increase by 28.594 units.
D)For every measurement unit of the neck,the average weight will increase by one unit.
E)For every measurement unit of the neck,the average age will decrease by -1.3838 units.
Unlock Deck
Unlock for access to all 22 flashcards in this deck.
Unlock Deck
k this deck
20
A company has undertaken a study of 16 secretaries' yearly salaries (in thousands of dollars).They want to predict salaries from several other variables.
The variables considered to be potential predictors of salary are:
X1 = months of service
X2 = years of education
X3 = score on standardized test
X4 = words per minute of typing speed
X5 = ability to take dictation in words per minute
A multiple regression model with all five variables was run,resulting in the following output:
= 0.958
From this model,what is the predicted salary of a secretary with 2.5 years (30 months)experience,10th grade education (10 years of education),an 80 on the standardized test,45 wpm typing speed,and the ability to take 30 wpm dictation?
A)$47,371
B)$24,054
C)$75,431
D)$144,225
E)$42,600
Unlock Deck
Unlock for access to all 22 flashcards in this deck.
Unlock Deck
k this deck
21
A company has undertaken a study to predict the calorie content of a serving of breakfast cereal based on protein,fat,fibre,carbohydrates,and sugar content (all in grams).Measurements were taken from 77 different breakfast cereals.A multiple regression model with all five variables was run,resulting in the following output:
= 0.845
Which measurement is the worst predictor of calorie content,after allowing for the linear effects of the other variables in the model?
A)sugar
B)carbohydrates
C)protein
D)fat
E)fibre
= 0.845
Which measurement is the worst predictor of calorie content,after allowing for the linear effects of the other variables in the model?
A)sugar
B)carbohydrates
C)protein
D)fat
E)fibre
Unlock Deck
Unlock for access to all 22 flashcards in this deck.
Unlock Deck
k this deck
22
A company has undertaken a study to predict the calorie content of a serving of breakfast cereal based on protein,fat,fibre,carbohydrates,and sugar content (all in grams).Measurements were taken from 77 different breakfast cereals.A multiple regression model with all five variables was run,resulting in the following output:
= 0.845
Which measurement is the best predictor of calorie content,after allowing for the linear effects of the other variables in the model?
A)protein
B)sugar
C)carbohydrates
D)fat
E)fibre
= 0.845
Which measurement is the best predictor of calorie content,after allowing for the linear effects of the other variables in the model?
A)protein
B)sugar
C)carbohydrates
D)fat
E)fibre
Unlock Deck
Unlock for access to all 22 flashcards in this deck.
Unlock Deck
k this deck
Unlock Deck
Unlock for access to all 22 flashcards in this deck.


