Deck 17: Bivariate Correlation and Regression
Full screen (f)
Question
Question
Question
Question
Question
Question
Question
Question
Question
Question
Question
Question
Question
Question
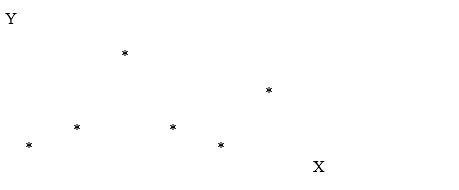
A)perfect linear association
B)strong exponential association
C)strong parabolic association
D)no association
E)strong curvilinear association
Question
Question
Question
Question
Question
Question
Question
Question
Question
Question
Question
Question
Question
Question
Question
Question
Question
Question
Question
Question
Question
Question
Question
Question
Question
Question
Question
Question
Question
Question
Question
Question
Question
Question
Question
Question
Question
Interpret the correlation coefficient for the following data:

Unlock Deck
Sign up to unlock the cards in this deck!
Unlock Deck
Unlock Deck
1/51
Play
Full screen (f)
Deck 17: Bivariate Correlation and Regression
1
What are the possible values in correlation analysis?
A)0 to 1
B)-1 to +1
C)-1 to 0
D)-.99 to + .99
E)-2 to +2
A)0 to 1
B)-1 to +1
C)-1 to 0
D)-.99 to + .99
E)-2 to +2
B
2
Which test statistic is used to test the significance of the results of a regression analysis?
A)F
B)t
C)Z
D)chi-square
E)least square
A)F
B)t
C)Z
D)chi-square
E)least square
A
3
In regression,the higher the _________ value,the more likely the relationship between variables is significant.
A)F
B)p
C)Z
D)t
E)none of these
A)F
B)p
C)Z
D)t
E)none of these
A
4
____________ is the mathematical technique for fitting a line that best describes the relationship between two variables.
A)Pearson's product-moment correlation
B)Least squares procedure
C)Chi-square test
D)Significance test
E)none of these
A)Pearson's product-moment correlation
B)Least squares procedure
C)Chi-square test
D)Significance test
E)none of these
Unlock Deck
Unlock for access to all 51 flashcards in this deck.
Unlock Deck
k this deck
5
If a marketer wants to correlate an ordinal ranking of TV sets with the nominal scale variable gender,the marketer would have to use_____________.
A)ANOVA
B)Pearson's product-moment correlation
C)z-test
D)chi-square test
E)none of these
A)ANOVA
B)Pearson's product-moment correlation
C)z-test
D)chi-square test
E)none of these
Unlock Deck
Unlock for access to all 51 flashcards in this deck.
Unlock Deck
k this deck
6
The explained variation by the regression is referred to as the:
A)total variation.
B)bivariate.
C)sum of squares due to regression .
D)none of these
A)total variation.
B)bivariate.
C)sum of squares due to regression .
D)none of these
Unlock Deck
Unlock for access to all 51 flashcards in this deck.
Unlock Deck
k this deck
7
An R² of .05 would indicate:
A)a significant relationship between X and Y.
B)a negative relationship between X and Y.
C)a very weak relationship between X and Y.
D)none of these
A)a significant relationship between X and Y.
B)a negative relationship between X and Y.
C)a very weak relationship between X and Y.
D)none of these
Unlock Deck
Unlock for access to all 51 flashcards in this deck.
Unlock Deck
k this deck
8
When the value of one variable increases at exactly the same rate as another variable decreases,this is said to be a ___________________relationship.
A)strong positive linear
B)positive linear
C)perfect negative linear
D)parabolic
E)strong curvilinear association
A)strong positive linear
B)positive linear
C)perfect negative linear
D)parabolic
E)strong curvilinear association
Unlock Deck
Unlock for access to all 51 flashcards in this deck.
Unlock Deck
k this deck
9
Research on fear appeal in advertising suggests that a moderate amount of fear is most effective at achieving persuasion.That is,using not enough fear or too much fear in advertising will not be effective.This is an example of what type of relationship that regression might find?
A)positive linear
B)negative linear
C)curvilinear
D)no relationship
E)none of these
A)positive linear
B)negative linear
C)curvilinear
D)no relationship
E)none of these
Unlock Deck
Unlock for access to all 51 flashcards in this deck.
Unlock Deck
k this deck
10
When two variables are not correlated at all,the correlation coefficient would be _______.
A)-1
B)0
C)1
D)-2
E)0.5
A)-1
B)0
C)1
D)-2
E)0.5
Unlock Deck
Unlock for access to all 51 flashcards in this deck.
Unlock Deck
k this deck
11
Which of the following is the appropriate technique for correlation analysis,which involves metric (interval or ratio)data?
A)Spearman's rank-order correlation
B)Jensen's analysis of covariance
C)Kendall's coefficient of concordance
D)Pearson's product-moment correlation
E)Edward's metric analysis
A)Spearman's rank-order correlation
B)Jensen's analysis of covariance
C)Kendall's coefficient of concordance
D)Pearson's product-moment correlation
E)Edward's metric analysis
Unlock Deck
Unlock for access to all 51 flashcards in this deck.
Unlock Deck
k this deck
12
In a regression equation,sales would typically be the ______________ variable.
A)independent
B)coefficient
C)dependent
D)none of these
A)independent
B)coefficient
C)dependent
D)none of these
Unlock Deck
Unlock for access to all 51 flashcards in this deck.
Unlock Deck
k this deck
13
In a regression output in SPSS,R² represents:
A)the independent variable.
B)the dependent variable.
C)the estimated slope of the regression line.
D)the coefficient of determination.
A)the independent variable.
B)the dependent variable.
C)the estimated slope of the regression line.
D)the coefficient of determination.
Unlock Deck
Unlock for access to all 51 flashcards in this deck.
Unlock Deck
k this deck
14
A)perfect linear association
B)strong exponential association
C)strong parabolic association
D)no association
E)strong curvilinear association
Unlock Deck
Unlock for access to all 51 flashcards in this deck.
Unlock Deck
k this deck
15
If you are studying the impact of training on salesperson performance as indicated on an exam taken by salespersons at the end of training,salesperson sales would be the ____________ variable,and the salesperson exam score would be the _____________ variable.
A)criterion, predictor
B)covariate, independent
C)independent, predictor
D)dependent, independent
E)covariate, dependent
A)criterion, predictor
B)covariate, independent
C)independent, predictor
D)dependent, independent
E)covariate, dependent
Unlock Deck
Unlock for access to all 51 flashcards in this deck.
Unlock Deck
k this deck
16
Which of the following techniques requires that both variables are ratio or interval data?
A)bivariate regression
B)ANOVA
C)t test
D)Pearson's product-moment correlation
E)All are appropriate.
A)bivariate regression
B)ANOVA
C)t test
D)Pearson's product-moment correlation
E)All are appropriate.
Unlock Deck
Unlock for access to all 51 flashcards in this deck.
Unlock Deck
k this deck
17
The percentage of total variation in the dependent variable that is described by the independent variable is expressed by_________.
A)coefficient of determination
B)correlation coefficient
C)coefficient of covariation
D)regression coefficient
E)none of these
A)coefficient of determination
B)correlation coefficient
C)coefficient of covariation
D)regression coefficient
E)none of these
Unlock Deck
Unlock for access to all 51 flashcards in this deck.
Unlock Deck
k this deck
18
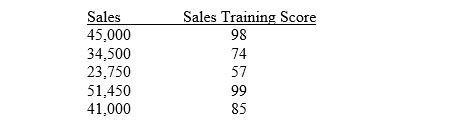
A correlation analysis between sales and sales training scores results in R = +.98.Which of the following best interprets the relationship between sales and sales training?
A)98% of the salespeople taking the test have higher sales.
B)The correlation between sales and sales training is very weak and insignificant.
C)The correlation between sales and sales training is strong and positive, indicating that higher sales training scores are closely associated with higher sales and vice-versa.
D)98% of the variation in sales is explained by variations in sales training scores.
E)none of these
Unlock Deck
Unlock for access to all 51 flashcards in this deck.
Unlock Deck
k this deck
19
A regression equation that estimates the number of hours of study that impact a test score would most likely produce what type of relationship?
A)positive
B)negative
C)curvilinear
D)none of these
A)positive
B)negative
C)curvilinear
D)none of these
Unlock Deck
Unlock for access to all 51 flashcards in this deck.
Unlock Deck
k this deck
20
Bivariate regression can not demonstrate:
A)when the two variables are linear.
B)when the two variables are strongly inversely related.
C)when the two variables are strongly positively related.
D)when the two variables are causally related.
A)when the two variables are linear.
B)when the two variables are strongly inversely related.
C)when the two variables are strongly positively related.
D)when the two variables are causally related.
Unlock Deck
Unlock for access to all 51 flashcards in this deck.
Unlock Deck
k this deck
21
In bivariate regression,both the independent and dependent variables are measured in the form of nominal and/or ordinal data.
Unlock Deck
Unlock for access to all 51 flashcards in this deck.
Unlock Deck
k this deck
22
_______________ refers to analysis is one of strength of the linear relationship between two variables when one is considered the independent variable and the other the dependent variable
A)Multivariate regression
B)Univariate regression
C)Bivariate regression
D)Trivariate regression
E)None of these
A)Multivariate regression
B)Univariate regression
C)Bivariate regression
D)Trivariate regression
E)None of these
Unlock Deck
Unlock for access to all 51 flashcards in this deck.
Unlock Deck
k this deck
23
Dependent variables are also known as predictor variables.
Unlock Deck
Unlock for access to all 51 flashcards in this deck.
Unlock Deck
k this deck
24
In a regression equation,which symbol represents the dependent variable?
A)Y
B)X
C)e
D)r
E)p
A)Y
B)X
C)e
D)r
E)p
Unlock Deck
Unlock for access to all 51 flashcards in this deck.
Unlock Deck
k this deck
25
What is the variation not explained by the regression?
A)Sum of squares due to regression
B)Error sum of squares
C)Neither sum of squares due to regression or Error sum of squares
D)Both Sum of squares due to regression and Error sum of squares
A)Sum of squares due to regression
B)Error sum of squares
C)Neither sum of squares due to regression or Error sum of squares
D)Both Sum of squares due to regression and Error sum of squares
Unlock Deck
Unlock for access to all 51 flashcards in this deck.
Unlock Deck
k this deck
26
The coefficient of determination is used in correlation analysis.
Unlock Deck
Unlock for access to all 51 flashcards in this deck.
Unlock Deck
k this deck
27
The dependent variable is also called the __________________.
A)Measure
B)Criterion
C)Principle
D)Standard
E)Predictor
A)Measure
B)Criterion
C)Principle
D)Standard
E)Predictor
Unlock Deck
Unlock for access to all 51 flashcards in this deck.
Unlock Deck
k this deck
28
A R = -.95 is always weaker than +.95,because positive relationships are more significant than negative relationships.
Unlock Deck
Unlock for access to all 51 flashcards in this deck.
Unlock Deck
k this deck
29
A perfect correlation indicates that two variables are causally related.
Unlock Deck
Unlock for access to all 51 flashcards in this deck.
Unlock Deck
k this deck
30
The least squares estimation procedure often results in a perfectly straight line.
Unlock Deck
Unlock for access to all 51 flashcards in this deck.
Unlock Deck
k this deck
31
In correlation analysis,the closer the value of R is to -1 or +1,the stronger the correlation between the two variables in question.
Unlock Deck
Unlock for access to all 51 flashcards in this deck.
Unlock Deck
k this deck
32
___________ are statistical methods of analyzing the relationship between two variables.
A)Bivariate techniques
B)Univariate techniques
C)Multivariate techniques
D)None of these
A)Bivariate techniques
B)Univariate techniques
C)Multivariate techniques
D)None of these
Unlock Deck
Unlock for access to all 51 flashcards in this deck.
Unlock Deck
k this deck
33
The degree to which changes in one variable (the dependent variable)are associated with changes in another is which of the following?
A)correlation
B)consideration
C)regression
D)association
E)none of these
A)correlation
B)consideration
C)regression
D)association
E)none of these
Unlock Deck
Unlock for access to all 51 flashcards in this deck.
Unlock Deck
k this deck
34
A scatter plot compares actual data to a predicted relationship between 2 variables.
Unlock Deck
Unlock for access to all 51 flashcards in this deck.
Unlock Deck
k this deck
35
An R² of 0 indicates no relationship between variables.
Unlock Deck
Unlock for access to all 51 flashcards in this deck.
Unlock Deck
k this deck
36
The variation explained by the regression equation is called SSR or sum of squares due to the regression.
Unlock Deck
Unlock for access to all 51 flashcards in this deck.
Unlock Deck
k this deck
37
One way to study the relationship between the dependent and independent variable is to plot the data in a scatter diagram.
Unlock Deck
Unlock for access to all 51 flashcards in this deck.
Unlock Deck
k this deck
38
The R² statistic ranges from -1 to 1.
Unlock Deck
Unlock for access to all 51 flashcards in this deck.
Unlock Deck
k this deck
39
Which of the following is not included in the equation for the coefficient of determination?
A)explained variation
B)total variation
C)estimated variation
D)unexplained variation
A)explained variation
B)total variation
C)estimated variation
D)unexplained variation
Unlock Deck
Unlock for access to all 51 flashcards in this deck.
Unlock Deck
k this deck
40
Bivariate statistical techniques are often used to establish cause and effect relationships between two or more variables.
Unlock Deck
Unlock for access to all 51 flashcards in this deck.
Unlock Deck
k this deck
41
Explain the meaning of the coefficient of determination.What does this coefficient tell the researcher about the nature of the relationship between the dependent and independent variables?
Unlock Deck
Unlock for access to all 51 flashcards in this deck.
Unlock Deck
k this deck
42
In regression,the unexplained variation is referred to as error sum of squares (SSE).
Unlock Deck
Unlock for access to all 51 flashcards in this deck.
Unlock Deck
k this deck
43
In the equation for regression analysis,the letter X represents the independent variable.
Unlock Deck
Unlock for access to all 51 flashcards in this deck.
Unlock Deck
k this deck
44
The correct formula for the analysis of variance used to test the significance of results is F = MSR / MSE.
Unlock Deck
Unlock for access to all 51 flashcards in this deck.
Unlock Deck
k this deck
45
Which of the relationships in the matrix is the strongest?
Unlock Deck
Unlock for access to all 51 flashcards in this deck.
Unlock Deck
k this deck
46
How would you interpret the relationship between Education and Age?
Unlock Deck
Unlock for access to all 51 flashcards in this deck.
Unlock Deck
k this deck
47
How many pairs of responses were in this correlation analysis? ________
Unlock Deck
Unlock for access to all 51 flashcards in this deck.
Unlock Deck
k this deck
48
Some of the results of a regression analysis are as follows:
SSE = 52,500 SST = 485,200
Compute the Coefficient of Determination (R²)and interpret.
SSE = 52,500 SST = 485,200
Compute the Coefficient of Determination (R²)and interpret.
Unlock Deck
Unlock for access to all 51 flashcards in this deck.
Unlock Deck
k this deck
49
Draw a graph depicting a strong but inverse correlation between X(Sales)and
number of times the sales force did not reach its quota.Interpret the relationship.
number of times the sales force did not reach its quota.Interpret the relationship.
Unlock Deck
Unlock for access to all 51 flashcards in this deck.
Unlock Deck
k this deck
50
The coefficient of correlation describes the degree of association between X and Y.
Unlock Deck
Unlock for access to all 51 flashcards in this deck.
Unlock Deck
k this deck
51
Interpret the correlation coefficient for the following data:
Unlock Deck
Unlock for access to all 51 flashcards in this deck.
Unlock Deck
k this deck
Unlock Deck
Unlock for access to all 51 flashcards in this deck.


