Deck 16: Statistical Analyses
Full screen (f)
Question
Question
Question
Question
Question
Question
Given the following bivariate matrix,which of the following statements is(are)INCORRECT?
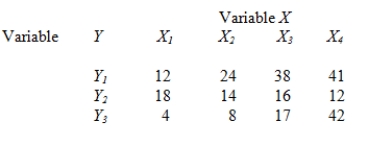
A)X is the column variable.
B)Fourteen cases have the pattern X2Y2.
C)There are three different variables on Y.
D)Four cases are located at Y3X1.
E)There are four different variables on Y.
A)X is the column variable.
B)Fourteen cases have the pattern X2Y2.
C)There are three different variables on Y.
D)Four cases are located at Y3X1.
E)There are four different variables on Y.
Question
Question
Question
Question
How many degrees of freedom exist in the following table?
EMPLOYMENT STATUS

A)9
B)8
C)3
D)4
E)1
EMPLOYMENT STATUS
A)9
B)8
C)3
D)4
E)1
Question
Question
Question
An appropriate measure(s)of association for the data presented below is(are)
EMPLOYMENT STATUS

A)gamma.
B)lambda.
C)chi square.
D)Pearson's product moment correlation.
E)alpha.
EMPLOYMENT STATUS
A)gamma.
B)lambda.
C)chi square.
D)Pearson's product moment correlation.
E)alpha.
Question
Given the following table relating the social class of husband with the social class of wife,which of the following computations would equal the number of pairs with the same ranking?
SOCIAL CLASS OF HUSBAND

A)200(199)/2
B)50(20+30+30+10) + 25(20+30) + 10(30+10) + 30(30)
C)10(30+10+15+10) + 25(10+15) + 20(10+15) + 30(15)
D)60(65+75) + 85(60+55)
E)None of these choices is correct.
SOCIAL CLASS OF HUSBAND
A)200(199)/2
B)50(20+30+30+10) + 25(20+30) + 10(30+10) + 30(30)
C)10(30+10+15+10) + 25(10+15) + 20(10+15) + 30(15)
D)60(65+75) + 85(60+55)
E)None of these choices is correct.
Question
Question
Question
Given the following table relating age to employment status,which of the following conclusion(s)can be drawn?
EMPLOYMENT STATUS

A)There is a negative association between age and employment status.
B)As age increases so does the employment status.
C)There is a positive association between age and employment status.
D)There is a negative association between age and employment status such that as age increases so does employment status.
E)There is a positive association between age and employment status such that as age increases so does employment status.
EMPLOYMENT STATUS
A)There is a negative association between age and employment status.
B)As age increases so does the employment status.
C)There is a positive association between age and employment status.
D)There is a negative association between age and employment status such that as age increases so does employment status.
E)There is a positive association between age and employment status such that as age increases so does employment status.
Question
Suppose you had calculated gamma for the following table,and it was .36.This means that
SOCIAL CLASS OF HUSBAND

A)husband's social class is positively associated with wife's social class.
B)36% more of the pairs examined had the same ranking than had the opposite ranking.
C)36% more of the pairs examined had the opposite ranking than had the same ranking.
D)husband's social class is positively associated with wife's social class and therefore 36% more of the pairs examined had the same ranking than had the opposite ranking.
E)husband's social class is positively associated with wife's social class and therefore 36% more of the pairs examined had the opposite ranking than had the same ranking.
SOCIAL CLASS OF HUSBAND
A)husband's social class is positively associated with wife's social class.
B)36% more of the pairs examined had the same ranking than had the opposite ranking.
C)36% more of the pairs examined had the opposite ranking than had the same ranking.
D)husband's social class is positively associated with wife's social class and therefore 36% more of the pairs examined had the same ranking than had the opposite ranking.
E)husband's social class is positively associated with wife's social class and therefore 36% more of the pairs examined had the opposite ranking than had the same ranking.
Question
Question
Question
Question
Question
Question
Question
Question
Question
Question
Question
Question
Question
Question
Question
Given the following computer printout from a factor analysis,which of the following statements is(are)TRUE?

A)There are seven factors.
B)There are seven variables.
C)Factor #7 could be eliminated from the analysis.
D)Variable #2 is most important for factor #2.
E)Variable #3 tells us nothing.
A)There are seven factors.
B)There are seven variables.
C)Factor #7 could be eliminated from the analysis.
D)Variable #2 is most important for factor #2.
E)Variable #3 tells us nothing.
Question
Question
Question
Question
Question
Question
Question
Question
Question
Question
Question
Question
Question
Question
Question
Question
Question
Question
Question
Question
Question
Question
Question
Question
Question
Question
Question
Question
Question
Question
Question
Question
Question
Question
Question
Question
Question
Question
Question
Question
Question
Question
Question
Question
Question
Question
Question

Unlock Deck
Sign up to unlock the cards in this deck!
Unlock Deck
Unlock Deck
1/108
Play
Full screen (f)
Deck 16: Statistical Analyses
1
Jeff thinks that market sales are influenced by the preceding year's unemployment rate.Jeff should use a ____ for his analysis.
A)discriminant analysis
B)path analysis
C)factor analysis
D)time-lagged regression analysis
E)regression analysis
A)discriminant analysis
B)path analysis
C)factor analysis
D)time-lagged regression analysis
E)regression analysis
D
2
Which of the following is(are)NOT an assumption underlying the use of inferential statistics?
A)sample must be drawn from the population about which inferences are to be made
B)nonprobability sampling
C)100% completion rate
D)sampling with replacement
E)simple random sampling.
A)sample must be drawn from the population about which inferences are to be made
B)nonprobability sampling
C)100% completion rate
D)sampling with replacement
E)simple random sampling.
B
3
Using simple random sampling,100 males were drawn from a population and asked their age.The mean age for these men was 22.The standard error for the sample was 5.We are 68% confident that the population parameter is
A) 22.
B)between 19.5 and 24.5.
C)between 17 and 27.
D)between 12 and 32.
E)between 10 and 30.
A) 22.
B)between 19.5 and 24.5.
C)between 17 and 27.
D)between 12 and 32.
E)between 10 and 30.
C
4
The regression model can NOT be used to
A)summarize a relationship between variables.
B)predict a value of one variable from its relationship to another related variable.
C)provide in-depth information for a single variable.
D)determine the specific function relating the two variables.
E)analyze a relationship between two variables.
A)summarize a relationship between variables.
B)predict a value of one variable from its relationship to another related variable.
C)provide in-depth information for a single variable.
D)determine the specific function relating the two variables.
E)analyze a relationship between two variables.
Unlock Deck
Unlock for access to all 108 flashcards in this deck.
Unlock Deck
k this deck
5
Which of the following statements is TRUE?
A)If a relationship is substantively significant then it is also statistically significant.
B)If a relationship is statistically significant then it is also substantively significant.
C)If a relationship is statistically significant then it is an important relationship.
D)Statistical significance does not indicate anything about substantive significance.
E)If a relationship is statistically significant then it is also substantively significant. because a statistically significant relationship is an important relationship.
Unlock Deck
Unlock for access to all 108 flashcards in this deck.
Unlock Deck
k this deck
6
Given the following bivariate matrix,which of the following statements is(are)INCORRECT?
A)X is the column variable.
B)Fourteen cases have the pattern X2Y2.
C)There are three different variables on Y.
D)Four cases are located at Y3X1.
E)There are four different variables on Y.
A)X is the column variable.
B)Fourteen cases have the pattern X2Y2.
C)There are three different variables on Y.
D)Four cases are located at Y3X1.
E)There are four different variables on Y.
Unlock Deck
Unlock for access to all 108 flashcards in this deck.
Unlock Deck
k this deck
7
Faced with data that do not support an assumption of independence between two variables in a population,a researcher should
A)immediately rejects the assumption of independence.
B)attribute this discrepancy to an unrepresentative sample or reject the assumption of independence.
C)retest the data in order to confirm these initial findings.
D)immediately assume that the sample was unrepresentative of the population.
E)ignore the findings as incorrect and start again.
Unlock Deck
Unlock for access to all 108 flashcards in this deck.
Unlock Deck
k this deck
8
Raj wanted to examine the strength of the relationship between political affiliation (Democrat,Republican,Independent,Other,None)and religious beliefs (Protestant,Catholic,Jewish,Muslim,Other,None).Which measure of association should he use to present this relationship?
A) lambda.
B) gamma.
C) chi square.
D) Pearson's product moment correlation.
E) omega.
A) lambda.
B) gamma.
C) chi square.
D) Pearson's product moment correlation.
E) omega.
Unlock Deck
Unlock for access to all 108 flashcards in this deck.
Unlock Deck
k this deck
9
A gamma value of 3.3 indicates
A) an extremely strong relationship.
B) an error in calculations.
C) a moderately weak relationship.
D) an extremely weak relationship.
E) no relationship at all.
A) an extremely strong relationship.
B) an error in calculations.
C) a moderately weak relationship.
D) an extremely weak relationship.
E) no relationship at all.
Unlock Deck
Unlock for access to all 108 flashcards in this deck.
Unlock Deck
k this deck
10
How many degrees of freedom exist in the following table?
EMPLOYMENT STATUS
A)9
B)8
C)3
D)4
E)1
EMPLOYMENT STATUS
A)9
B)8
C)3
D)4
E)1
Unlock Deck
Unlock for access to all 108 flashcards in this deck.
Unlock Deck
k this deck
11
Which of the following statistics can be used to determine whether or not there is a statistically significant relationship between two variables in a contingency table?
A)gamma
B)chi square
C)lambda
D)Pearson's product moment correlation coefficient
E)ANOVA
A)gamma
B)chi square
C)lambda
D)Pearson's product moment correlation coefficient
E)ANOVA
Unlock Deck
Unlock for access to all 108 flashcards in this deck.
Unlock Deck
k this deck
12
The formulas for some measures of association can result in coefficients with either positive or negative signs.Under which of the following circumstances can those signs be meaningfully interpreted?
A)whenever the data are expressed as frequencies
B)when the data are measured at the nominal level
C)when the data are measured at the ordinal level
D)whenever the data have a modal category
E)whenever the data are expressed as percentages
A)whenever the data are expressed as frequencies
B)when the data are measured at the nominal level
C)when the data are measured at the ordinal level
D)whenever the data have a modal category
E)whenever the data are expressed as percentages
Unlock Deck
Unlock for access to all 108 flashcards in this deck.
Unlock Deck
k this deck
13
An appropriate measure(s)of association for the data presented below is(are)
EMPLOYMENT STATUS
A)gamma.
B)lambda.
C)chi square.
D)Pearson's product moment correlation.
E)alpha.
EMPLOYMENT STATUS
A)gamma.
B)lambda.
C)chi square.
D)Pearson's product moment correlation.
E)alpha.
Unlock Deck
Unlock for access to all 108 flashcards in this deck.
Unlock Deck
k this deck
14
Given the following table relating the social class of husband with the social class of wife,which of the following computations would equal the number of pairs with the same ranking?
SOCIAL CLASS OF HUSBAND
A)200(199)/2
B)50(20+30+30+10) + 25(20+30) + 10(30+10) + 30(30)
C)10(30+10+15+10) + 25(10+15) + 20(10+15) + 30(15)
D)60(65+75) + 85(60+55)
E)None of these choices is correct.
SOCIAL CLASS OF HUSBAND
A)200(199)/2
B)50(20+30+30+10) + 25(20+30) + 10(30+10) + 30(30)
C)10(30+10+15+10) + 25(10+15) + 20(10+15) + 30(15)
D)60(65+75) + 85(60+55)
E)None of these choices is correct.
Unlock Deck
Unlock for access to all 108 flashcards in this deck.
Unlock Deck
k this deck
15
Which of the following hypotheses assumes that there is no relationship between two variables?
A)research
B)null
C)alternate
D)secondary
E)substantive
A)research
B)null
C)alternate
D)secondary
E)substantive
Unlock Deck
Unlock for access to all 108 flashcards in this deck.
Unlock Deck
k this deck
16
Which of the following regression equations represents the strongest relationship between X and Y?
A)Y = 2 + .3X
B)Y = 2 + 1.3X
C)Y = 2 + 1.8X
D)Y = 2 + 3X
E)The strength of the relationship cannot be determined from the regression equation.
A)Y = 2 + .3X
B)Y = 2 + 1.3X
C)Y = 2 + 1.8X
D)Y = 2 + 3X
E)The strength of the relationship cannot be determined from the regression equation.
Unlock Deck
Unlock for access to all 108 flashcards in this deck.
Unlock Deck
k this deck
17
Given the following table relating age to employment status,which of the following conclusion(s)can be drawn?
EMPLOYMENT STATUS
A)There is a negative association between age and employment status.
B)As age increases so does the employment status.
C)There is a positive association between age and employment status.
D)There is a negative association between age and employment status such that as age increases so does employment status.
E)There is a positive association between age and employment status such that as age increases so does employment status.
Unlock Deck
Unlock for access to all 108 flashcards in this deck.
Unlock Deck
k this deck
18
Suppose you had calculated gamma for the following table,and it was .36.This means that
SOCIAL CLASS OF HUSBAND
A)husband's social class is positively associated with wife's social class.
B)36% more of the pairs examined had the same ranking than had the opposite ranking.
C)36% more of the pairs examined had the opposite ranking than had the same ranking.
D)husband's social class is positively associated with wife's social class and therefore 36% more of the pairs examined had the same ranking than had the opposite ranking.
E)husband's social class is positively associated with wife's social class and therefore 36% more of the pairs examined had the opposite ranking than had the same ranking.
Unlock Deck
Unlock for access to all 108 flashcards in this deck.
Unlock Deck
k this deck
19
Professor Smigel calculated a chi square of 83.26 on a set of data.The value for chi square in the table at the .05 level (< .05)was 16.91.Smigel concluded that
A)it is improbable that the observed relationship could have resulted from sampling error alone.
B)the null hypothesis was rejected.
C)there is a statistically significant relationship at the .05 level.
D)the null hypothesis was rejected, and there is a statistically significant relationship at the .05 level.
E)the null hypothesis was rejected, there is a statistically significant relationship at the .05 level, and it is improbable that the observed relationship could have resulted from sampling error alone.
Unlock Deck
Unlock for access to all 108 flashcards in this deck.
Unlock Deck
k this deck
20
A .05 level of significance means that
A)there is only a 5% chance that the statistic's value could be obtained as a result of sampling error only.
B)one is 50% certain that the sample value is representative of the population.
C)there is only a 5% chance that the variables tested are not independent.
D)the results can be accepted because the sampling error is only 5%.
E)the level of confidence is only 5%.
Unlock Deck
Unlock for access to all 108 flashcards in this deck.
Unlock Deck
k this deck
21
Basically,path analysis attempts to
A)study a relationship between two variables with a third variable held constant.
B)examine a nonlinear relationship between two variables.
C)describe relationships among variables by developing causal models.
D)determine the irreducible factors underlying a series of variables.
E)represent relationships as distances between points.
Unlock Deck
Unlock for access to all 108 flashcards in this deck.
Unlock Deck
k this deck
22
Which of the following is an INAPPROPRIATE unit of analysis in Geographic Information Systems?
A)countries
B)states
C)fire departments
D)census tracts
E)cities
A)countries
B)states
C)fire departments
D)census tracts
E)cities
Unlock Deck
Unlock for access to all 108 flashcards in this deck.
Unlock Deck
k this deck
23
Which of the following is NOT an assumption underlying regression analysis?
A)simple random sampling
B)discrete variables
C)at least interval data
D)absence of nonsampling error
E)continuous variables.
A)simple random sampling
B)discrete variables
C)at least interval data
D)absence of nonsampling error
E)continuous variables.
Unlock Deck
Unlock for access to all 108 flashcards in this deck.
Unlock Deck
k this deck
24
Using the following regression equation,which of the following statements is FALSE?
Y = bₒ + bX₁ + bX₂ + bX₃
A)It treats b as the independent variable.
B)There are three independent variables.
C)There is one dependent variable.
D)It predicts Y from the X's.
E)It treats Y as the dependent variable.
Y = bₒ + bX₁ + bX₂ + bX₃
A)It treats b as the independent variable.
B)There are three independent variables.
C)There is one dependent variable.
D)It predicts Y from the X's.
E)It treats Y as the dependent variable.
Unlock Deck
Unlock for access to all 108 flashcards in this deck.
Unlock Deck
k this deck
25
Which of the following statements is TRUE regarding discriminant analysis?
A)Its logic is similar to that of multiple regression.
B)The dependent variable can be nominal.
C)The dependent variable must be at least interval.
D)Its logic is similar to that of multiple regression except that the dependent variable can be nominal.
E)Its logic is similar to that of multiple regression and it too requires that the dependent variable be at least interval in measurement.
Unlock Deck
Unlock for access to all 108 flashcards in this deck.
Unlock Deck
k this deck
26
Which of the following statements is FALSE about the logic of ANOVA?
A)The cases under study are combined into groups representing an independent variable.
B)The extent to which groups differ from one another is analyzed in terms of some dependent variable.
C)The extent to which the groups differ is compared with the standard random distribution.
D)Only one explanatory variable can be used in an ANOVA analysis.
E)More than one explanatory variable can be used in an ANOVA analysis.
Unlock Deck
Unlock for access to all 108 flashcards in this deck.
Unlock Deck
k this deck
27
At the univariate level,descriptive statistics are used for
A)measures of association.
B)multivariate analyses.
C)data expansion.
D)data reduction.
E)determining causality.
A)measures of association.
B)multivariate analyses.
C)data expansion.
D)data reduction.
E)determining causality.
Unlock Deck
Unlock for access to all 108 flashcards in this deck.
Unlock Deck
k this deck
28
Professor Stanton thought that verbal ability was a function of age.Stanton collected data on people aged 5 to 20.The analysis yielded the following equation: V = 20 + 3A where V = verbal ability and A = age.Stanton was asked to predict the verbal ability of a 30 year old.Stanton should respond
A) 110.
B) 90.
C)extrapolation is untrustworthy.
D)interpolation is untrustworthy.
E)53.
A) 110.
B) 90.
C)extrapolation is untrustworthy.
D)interpolation is untrustworthy.
E)53.
Unlock Deck
Unlock for access to all 108 flashcards in this deck.
Unlock Deck
k this deck
29
The formula Y = f(X)tells us that
A)X is the dependent variable.
B)Y is the dependent variable.
C)f is the dependent variable.
D)need to know what Y, f, and X represent to determine the dependent variable
E)Y equals 10.
A)X is the dependent variable.
B)Y is the dependent variable.
C)f is the dependent variable.
D)need to know what Y, f, and X represent to determine the dependent variable
E)Y equals 10.
Unlock Deck
Unlock for access to all 108 flashcards in this deck.
Unlock Deck
k this deck
30
Log-linear models
A)use a logic that is similar to that used in chi-square.
B)are based on specifying models that describe the interrelationship among variables.
C)compare expected and observed table-cell frequencies.
D)use a logic that is similar to that used in chi-square and therefore compare expected and observed table-cell frequencies.
E)are based on specifying models that describe the interrelationship among variables and they compare expected and observed table-cell frequencies using a logic that is similar to that used in chi-square.
Unlock Deck
Unlock for access to all 108 flashcards in this deck.
Unlock Deck
k this deck
31
If one wished to examine the relationship between education and income with age held constant,an appropriate technique would be
A)multiple regression.
B)partial regression.
C)curvilinear regression.
D)factor analysis.
E)time-series analysis.
A)multiple regression.
B)partial regression.
C)curvilinear regression.
D)factor analysis.
E)time-series analysis.
Unlock Deck
Unlock for access to all 108 flashcards in this deck.
Unlock Deck
k this deck
32
With the equation of Y = 22.7 - 0.9X,what is the predicted value of Y if X is 3?
A) 22.7
B) 2.7
C)20
D)25.4
E) 19.7
A) 22.7
B) 2.7
C)20
D)25.4
E) 19.7
Unlock Deck
Unlock for access to all 108 flashcards in this deck.
Unlock Deck
k this deck
33
Given the following computer printout from a factor analysis,which of the following statements is(are)TRUE?
A)There are seven factors.
B)There are seven variables.
C)Factor #7 could be eliminated from the analysis.
D)Variable #2 is most important for factor #2.
E)Variable #3 tells us nothing.
A)There are seven factors.
B)There are seven variables.
C)Factor #7 could be eliminated from the analysis.
D)Variable #2 is most important for factor #2.
E)Variable #3 tells us nothing.
Unlock Deck
Unlock for access to all 108 flashcards in this deck.
Unlock Deck
k this deck
34
Professor Henley calculated a squared multiple correlation coefficient.It was .36.This means that
A)36% of the variance in the final score was explained.
B)60% of the variance in the final score was explained.
C)6% of the variance in the final score was explained.
D)13% of the variance in the final score was explained.
E)Henley erred in the calculation.
A)36% of the variance in the final score was explained.
B)60% of the variance in the final score was explained.
C)6% of the variance in the final score was explained.
D)13% of the variance in the final score was explained.
E)Henley erred in the calculation.
Unlock Deck
Unlock for access to all 108 flashcards in this deck.
Unlock Deck
k this deck
35
In path analysis,the statistic measuring the strength of a relationship between pairs of variables with the effect of other variables held constant is called
A)a path coefficient.
B)a partial epsilon.
C)a coefficient of alienation.
D)residual variance.
E)a variance coefficient.
A)a path coefficient.
B)a partial epsilon.
C)a coefficient of alienation.
D)residual variance.
E)a variance coefficient.
Unlock Deck
Unlock for access to all 108 flashcards in this deck.
Unlock Deck
k this deck
36
Factor analysis attempts to
A)analyze interrelationships of several variables.
B)reduce relationships among variables to a number of key dimensions.
C)discover basic patterns of relationships among variables.
D)analyze interrelationships of several variables, reduce relationships among variables to a number of key dimensions, and discover basic patterns of relationships among variables.
E)reduce relationships among variables to a number of key dimensions and discover basic patterns of relationships among variables.
Unlock Deck
Unlock for access to all 108 flashcards in this deck.
Unlock Deck
k this deck
37
Professor Triker is interested in examining the occupational mobility of women in the United States.Triker believes that people's first job affects their second job and that job in turn affects their third job,and so on.To analyze the data Triker should use
A)factor analysis.
B)time-series analysis.
C)two-way analysis of variance.
D)smallest-space analysis.
E)curvilinear regression analysis.
A)factor analysis.
B)time-series analysis.
C)two-way analysis of variance.
D)smallest-space analysis.
E)curvilinear regression analysis.
Unlock Deck
Unlock for access to all 108 flashcards in this deck.
Unlock Deck
k this deck
38
Which of the following techniques would be MOST useful in analyzing the relationship between Sex (male,female),Political party preference (Democrat,Republican,Other),Religious affiliation (believe in a higher order,unsure about a higher order,do not believe in a higher order)and support for gun control (yes,no,don't know)?
A)log-linear models
B)one-way ANOVA
C)partial regression
D)chi square
E)multiple regression
A)log-linear models
B)one-way ANOVA
C)partial regression
D)chi square
E)multiple regression
Unlock Deck
Unlock for access to all 108 flashcards in this deck.
Unlock Deck
k this deck
39
You believe that the number of hours people spend in the labor force is a function of age.In fact,you argue that between the ages of 14 and 21 labor force participation,measured in hours,steadily increases.Between the ages of 22 and 60 it remains fairly constant.From ages 61 on it steadily declines.To analyze data,you should use
A)curvilinear regression.
B)partial regression.
C)multiple regression.
D)path analysis.
E)analysis of variance.
A)curvilinear regression.
B)partial regression.
C)multiple regression.
D)path analysis.
E)analysis of variance.
Unlock Deck
Unlock for access to all 108 flashcards in this deck.
Unlock Deck
k this deck
40
In a 2x3 table how many cells do we need to fill in before the remainder of the table is determined by the marginal frequencies?
A)2
B)3
C)4
D)5
E)6
A)2
B)3
C)4
D)5
E)6
Unlock Deck
Unlock for access to all 108 flashcards in this deck.
Unlock Deck
k this deck
41
Chi square compares
A)percentages and ratios.
B)expected and observed frequencies.
C)percentages down with percentages across.
D)observed frequencies and population frequencies.
E)frequencies and ratios.
A)percentages and ratios.
B)expected and observed frequencies.
C)percentages down with percentages across.
D)observed frequencies and population frequencies.
E)frequencies and ratios.
Unlock Deck
Unlock for access to all 108 flashcards in this deck.
Unlock Deck
k this deck
42
The null hypothesis states that
A)there is a strong relationship between the two variables in the total population.
B)there is a moderate relationship between the two variables in the total population.
C)there is a weak relationship between the two variables in the total population.
D)there is no relationship between the two variables in the total population.
E)you will not be able to find a relationship between the two variables in the total population.
Unlock Deck
Unlock for access to all 108 flashcards in this deck.
Unlock Deck
k this deck
43
Gamma compares
A)pairs of respondents in terms of rankings on two variables.
B)pairs of variables in terms of rankings per respondent.
C)pairs of respondents in terms of rankings on one variable.
D)pairs of variables in terms of rankings on two respondents.
E)pairs of variables in terms of rankings on multiple variables
Unlock Deck
Unlock for access to all 108 flashcards in this deck.
Unlock Deck
k this deck
44
Which one of the following parallels elaboration analysis?
A)curvilinear regression
B)path analysis
C)partial regression
D)linear regression
E)multivariate regression
A)curvilinear regression
B)path analysis
C)partial regression
D)linear regression
E)multivariate regression
Unlock Deck
Unlock for access to all 108 flashcards in this deck.
Unlock Deck
k this deck
45
Samuel wanted to calculate a measure of association for her two variables of age and education,both of which were coded in three ordinal categories.Which one of the following would be best?
A)lambda
B)omega
C)gamma
D)alpha
E)delta
A)lambda
B)omega
C)gamma
D)alpha
E)delta
Unlock Deck
Unlock for access to all 108 flashcards in this deck.
Unlock Deck
k this deck
46
Roland wanted to examine the factors that lead to sex offender recidivism.He wanted to specifically determine what role previous offense history,severity of offense,and history of abuse played as independent variables.The method he should use to perform this analysis would be:
A) linear regression.
B) chi-square.
C) multiple regression.
D) Pearson's r.
E) gamma.
A) linear regression.
B) chi-square.
C) multiple regression.
D) Pearson's r.
E) gamma.
Unlock Deck
Unlock for access to all 108 flashcards in this deck.
Unlock Deck
k this deck
47
What is the best advice to follow when using regression analysis?
A)It is very robust-don't worry about a thing.
B)It has far too many assumptions to make it a worthwhile approach.
C)It is based on several assumptions that are seldom satisfied, so use with caution.
D)When in doubt, use curvilinear regression.
E)If one type of regression doesn't work, keep trying the other types of regression.
Unlock Deck
Unlock for access to all 108 flashcards in this deck.
Unlock Deck
k this deck
48
The appropriate measure of association for two nominal level variables is
A)lambda.
B)omega.
C)gamma.
D)alpha.
E)PRE.
A)lambda.
B)omega.
C)gamma.
D)alpha.
E)PRE.
Unlock Deck
Unlock for access to all 108 flashcards in this deck.
Unlock Deck
k this deck
49
Boyce wants to examine the association between two variables,and he wants to be able to predict values on the dependent variable given values on the independent variable.It would be best to use
A)Pearson' r.
B)gamma.
C)linear regression.
D)multiple regression.
E)chi-square.
A)Pearson' r.
B)gamma.
C)linear regression.
D)multiple regression.
E)chi-square.
Unlock Deck
Unlock for access to all 108 flashcards in this deck.
Unlock Deck
k this deck
50
Jocelyn wanted to explain the changes in teen-age car crashes over the past decade.She wanted to examine the effect of several variables on the changes over time in teenage car crashes.It would be best to use
A)path analysis.
B)factor analysis.
C)time-series analysis.
D)linear regression.
E)content analysis.
A)path analysis.
B)factor analysis.
C)time-series analysis.
D)linear regression.
E)content analysis.
Unlock Deck
Unlock for access to all 108 flashcards in this deck.
Unlock Deck
k this deck
51
Inferential statistics are used to
A)make inferences to only the sample used.
B)make inferences to the population the sample was taken from.
C)infer more empirically the underlying meaning of concepts.
D)infer which assumptions can be violated when doing multivariate analysis.
E)make inferences to the validity of the analytic results.
Unlock Deck
Unlock for access to all 108 flashcards in this deck.
Unlock Deck
k this deck
52
Which one of the following must be computed in order to use a standard set of chi square values?
A)standard deviations
B)sampling errors
C)degrees of freedom
D)percentages down and percentages across
E)Pearson's r
A)standard deviations
B)sampling errors
C)degrees of freedom
D)percentages down and percentages across
E)Pearson's r
Unlock Deck
Unlock for access to all 108 flashcards in this deck.
Unlock Deck
k this deck
53
Helene has two ratio-level variables in her study and wants to calculate a measure of association.Which one of the following would be best?
A)Patterson's D
B)Shirley's F
C)Pearson's r
D)Farley's s
E)Gamma's r
A)Patterson's D
B)Shirley's F
C)Pearson's r
D)Farley's s
E)Gamma's r
Unlock Deck
Unlock for access to all 108 flashcards in this deck.
Unlock Deck
k this deck
54
A statistical significance level of .05 means that
A)the probability that a relationship as strong as the observed one can be attributed to sampling error alone is 5 percent.
B)we can be 5 percent sure that the relationship is real and not due to sampling error.
C)there is an .05 percent chance that a relationship as strong as the observed one can be attributed to sampling error.
D)the difference we observed in the table is 5 percent different.
E)there is a 5 percent standard error in the observations.
Unlock Deck
Unlock for access to all 108 flashcards in this deck.
Unlock Deck
k this deck
55
Kaylee is interested in studying the relationship between gender (male,female)and religious affiliation (Catholic,Protestant,atheist,Muslim,Hindu,etc).What measure of association should she use?
A)lambda
B)gamma
C)Pearson's r
D)proportion reduction of error
E)chi-square
A)lambda
B)gamma
C)Pearson's r
D)proportion reduction of error
E)chi-square
Unlock Deck
Unlock for access to all 108 flashcards in this deck.
Unlock Deck
k this deck
56
Any statement of sampling error must contain
A)the serendipity quotient and the confidence level.
B)the confidence level and the confidence interval.
C)the confidence interval and the standard deviation.
D)the standard deviation and the serendipity quotient.
E)the standard error and the confidence level.
A)the serendipity quotient and the confidence level.
B)the confidence level and the confidence interval.
C)the confidence interval and the standard deviation.
D)the standard deviation and the serendipity quotient.
E)the standard error and the confidence level.
Unlock Deck
Unlock for access to all 108 flashcards in this deck.
Unlock Deck
k this deck
57
Kaleesha has developed 50 items to measure social isolation among high school students.She constructed the items by first identifying what she thought were four dimensions of social isolation,and then developing items to reflect each dimension.She now wants to use a statistical technique that will determine which items "hang together" in terms of how respondents answered them,so that she can determine if her conceptually identified dimensions are supported empirically.It would be best to use
A)path analysis.
B)time-series analysis.
C)path analysis.
D)factor analysis.
E)content analysis.
A)path analysis.
B)time-series analysis.
C)path analysis.
D)factor analysis.
E)content analysis.
Unlock Deck
Unlock for access to all 108 flashcards in this deck.
Unlock Deck
k this deck
58
Which one of the following is FALSE?
A)Tests of substantive as well as statistical significance should be computed.
B)Tests of statistical significance should not be computed when studying an entire population.
C)The assumptions of tests of significance are frequently violated.
D)Babbie's bias is against tests of significance.
E)Statistical significance should always be computed with a sample.
Unlock Deck
Unlock for access to all 108 flashcards in this deck.
Unlock Deck
k this deck
59
Which three levels of significance are frequently used in research reports?
A).99, .95, .90
B).50, .75, .99
C).10, .05, .01
D) .05, .01, .001
E) .10, .01, .001
A).99, .95, .90
B).50, .75, .99
C).10, .05, .01
D) .05, .01, .001
E) .10, .01, .001
Unlock Deck
Unlock for access to all 108 flashcards in this deck.
Unlock Deck
k this deck
60
Ginger wanted to develop a causal analysis of factors leading to divorce.She was particularly concerned with developing a graphic picture of the relationships among her variables.It would be best to use
A)path analysis.
B)time-series analysis.
C)factor analysis.
D)linear regression.
E)graph.
A)path analysis.
B)time-series analysis.
C)factor analysis.
D)linear regression.
E)graph.
Unlock Deck
Unlock for access to all 108 flashcards in this deck.
Unlock Deck
k this deck
61
If Lindsey is interested in studying the relationship between an ordinal independent variable (e.g.level of education attained)and a ratio dependent variable (e.g.amount of income earned per year),she should probably conduct a ________,and use _________ to analyze her results.
A)crosstabs; chi-square, lambda, gamma
B)crosstabs; t-test, ANOVA
C)means test; chi-square, lambda
D)means test; t-test, ANOVA
E)means test; Pearson's r, regression
A)crosstabs; chi-square, lambda, gamma
B)crosstabs; t-test, ANOVA
C)means test; chi-square, lambda
D)means test; t-test, ANOVA
E)means test; Pearson's r, regression
Unlock Deck
Unlock for access to all 108 flashcards in this deck.
Unlock Deck
k this deck
62
Which of the following computer programs is statistical software for quantitative data analysis?
A) Nvivo.
B) STATA.
C) QDA Miner.
D) TAMS.
E) these are all used for quantitative data analysis.
A) Nvivo.
B) STATA.
C) QDA Miner.
D) TAMS.
E) these are all used for quantitative data analysis.
Unlock Deck
Unlock for access to all 108 flashcards in this deck.
Unlock Deck
k this deck
63
A scattergram is a graphic representation of
A)linear regression analysis.
B)time-series analysis.
C)factor analysis.
D)path analysis.
E)discriminant analysis.
A)linear regression analysis.
B)time-series analysis.
C)factor analysis.
D)path analysis.
E)discriminant analysis.
Unlock Deck
Unlock for access to all 108 flashcards in this deck.
Unlock Deck
k this deck
64
Logit and probit models of regression are specifically used for:
A) nominal variables.
B) interval variables.
C) ratio variables.
D) ordinal variables.
E) any level of variable.
A) nominal variables.
B) interval variables.
C) ratio variables.
D) ordinal variables.
E) any level of variable.
Unlock Deck
Unlock for access to all 108 flashcards in this deck.
Unlock Deck
k this deck
65
Regression lines can be used for interpolation.
Unlock Deck
Unlock for access to all 108 flashcards in this deck.
Unlock Deck
k this deck
66
The t-test is a commonly used measure to judge statistically significant differences in group means.The value of t is highly influenced by the size of the sample,the difference between means,and:
A)the level of measurement.
B)the mean of each variable included.
C)variations of differences within each group.
D)the median value of the variable.
E)the slope of the related regression equation.
A)the level of measurement.
B)the mean of each variable included.
C)variations of differences within each group.
D)the median value of the variable.
E)the slope of the related regression equation.
Unlock Deck
Unlock for access to all 108 flashcards in this deck.
Unlock Deck
k this deck
67
Which of the following research projects would be most well suited to the use of GIS?
A) voting patterns between Democrats and Republicans across the United States.
B) distribution of financial resources to schools in the state of New York.c rates of property and violent crimes in a single city.
D) the spread of HIV infection across the entire world.
E) all of these choices are correct.
Unlock Deck
Unlock for access to all 108 flashcards in this deck.
Unlock Deck
k this deck
68
A disadvantage of factor analysis is that it does not permit hypotheses to be disconfirmed.
Unlock Deck
Unlock for access to all 108 flashcards in this deck.
Unlock Deck
k this deck
69
If an association is statistically significant it is an important relationship
Unlock Deck
Unlock for access to all 108 flashcards in this deck.
Unlock Deck
k this deck
70
Professor Bu's calculated chi square value for a set of data was 11.92.The value for chi square at the .05 level in a table of values was 16.91.The professor can conclude
A) the null hypothesis should be rejected.
B) the relationship may be due to sampling error alone.
C) the alternate hypothesis should be accepted.
D) the relationship between variables is statistically significant.
E) the relationship is not due to sampling error.
A) the null hypothesis should be rejected.
B) the relationship may be due to sampling error alone.
C) the alternate hypothesis should be accepted.
D) the relationship between variables is statistically significant.
E) the relationship is not due to sampling error.
Unlock Deck
Unlock for access to all 108 flashcards in this deck.
Unlock Deck
k this deck
71
Gamma is a measurement based on
A)guessing the inverse values of a distribution.
B)guessing the outlying variables of a distribution.
C)guessing the exact values of variables.
D)guessing the ordinal relationship of variables.
E)guessing the nominal relationship of variables.
A)guessing the inverse values of a distribution.
B)guessing the outlying variables of a distribution.
C)guessing the exact values of variables.
D)guessing the ordinal relationship of variables.
E)guessing the nominal relationship of variables.
Unlock Deck
Unlock for access to all 108 flashcards in this deck.
Unlock Deck
k this deck
72
The equation,Y = a - bX signifies a __________ relationship.
A)positive
B)negative
C)independent
D)null
E)good
A)positive
B)negative
C)independent
D)null
E)good
Unlock Deck
Unlock for access to all 108 flashcards in this deck.
Unlock Deck
k this deck
73
The proportionate reduction in error is related to the strength of the relationship between two variables.
Unlock Deck
Unlock for access to all 108 flashcards in this deck.
Unlock Deck
k this deck
74
Based upon simple random sampling of 100 college students,the mean GPA was 2.3 with a standard error of 0.3.We are 68% confident that the population parameter is
A) between 1.4 and 2.6
B) between 1.7 and 2.9
C) 2.3
D) between 2.0 and 2.6
E) less than 1.4
A) between 1.4 and 2.6
B) between 1.7 and 2.9
C) 2.3
D) between 2.0 and 2.6
E) less than 1.4
Unlock Deck
Unlock for access to all 108 flashcards in this deck.
Unlock Deck
k this deck
75
Inferential statistics are used primarily for describing samples.
Unlock Deck
Unlock for access to all 108 flashcards in this deck.
Unlock Deck
k this deck
76
For most social science purposes,the accepted minimum level of significance is:
A)p = .40
B)p = .25
C)p = .05
D)p = .10
E)p = .20
A)p = .40
B)p = .25
C)p = .05
D)p = .10
E)p = .20
Unlock Deck
Unlock for access to all 108 flashcards in this deck.
Unlock Deck
k this deck
77
Which of the following is based upon the same logical conventions as the Elaboration Model?
A)ANOVA
B)chi-square
C)partial regression analysis
D)curvilinear regression analysis
E)time-series analysis
A)ANOVA
B)chi-square
C)partial regression analysis
D)curvilinear regression analysis
E)time-series analysis
Unlock Deck
Unlock for access to all 108 flashcards in this deck.
Unlock Deck
k this deck
78
In the case of r,errors are measured in terms of the sum of the squared differences between the actual value and the mean.This sum is called the
A)standard error.
B)sum or error.
C)standard deviation.
D)standard variation.
E)total variation.
A)standard error.
B)sum or error.
C)standard deviation.
D)standard variation.
E)total variation.
Unlock Deck
Unlock for access to all 108 flashcards in this deck.
Unlock Deck
k this deck
79
Michel is examining the amount of binge drinking on a college campus,with the belief that due to maturity and a desire to succeed,the more drinking a student did the year before,the more reduction there will be in drinking later.To perform this analysis he should use:
A) curvilinear regression analysis.
B) snowball analysis.
C) time-series analysis.
D) factor analysis.
E) two-way ANOVA.
A) curvilinear regression analysis.
B) snowball analysis.
C) time-series analysis.
D) factor analysis.
E) two-way ANOVA.
Unlock Deck
Unlock for access to all 108 flashcards in this deck.
Unlock Deck
k this deck
80
If Jay is studying the relationship between two ordinal variables,he should probably use _________ to analyze her results.
A)chi-square
B)means test
C)ANOVA
D)regression
E)Pearson's r
A)chi-square
B)means test
C)ANOVA
D)regression
E)Pearson's r
Unlock Deck
Unlock for access to all 108 flashcards in this deck.
Unlock Deck
k this deck
Unlock Deck
Unlock for access to all 108 flashcards in this deck.


