Deck 8: Prediction
Full screen (f)
Question
From the records of a large health maintenance organization, an investigator is able to gather a sizeable sample of men for whom heights at both age 10 and as adults are known. The following are the summary statistics for this sample:
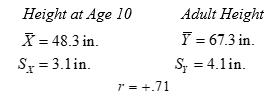
(a) Use the above values to arrive at the raw-score regression equation for predicting height as an adult from height at age 10. Present the equation in simplest form.
(b) Use the regression equation from (a) to predict adult height for the following 10-year-olds: Benny (42.5 in.), Cal (55.3 in.), Arthur (50.1 in.).
(c) Consider Benny's predictable adult height. In what sense is that value a mean? Be very specific.
Question
The following are the scores on a job selection test administered prior to hiring (X) and supervisor's ratings after 3 months on the job (Y) for a group of bank tellers (A-F):
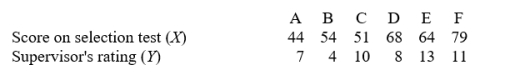
(a) Compute from these data the summary statistics required for developing the raw-score regression equation for predicting supervisor's rating from job selection score.
(b) Use the values from (a) to arrive at the regression equation in simplest form.
(c) Three new applicants for teller positions obtain scores of 48, 62, and 72, respectively, on the selection test. Compute their predicted supervisor's ratings.
(d) If in fact the above data were real, what objection would you have to using the equation from (b) to predict in a "real-life" situation?
Question
For the group of adult joggers competing in the Windy City Mini-marathon, the following are the summary statistics for annual income (X) and time to complete the race (Y):
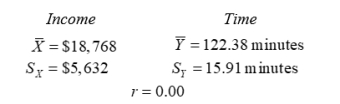 (a) Jack L. and Linda P. have annual incomes of $12,372 and $24,812, respectively. What race times would you predict? (Hint: No calculations are necessary). (b) What general principle is illustrated by this problem?
(a) Jack L. and Linda P. have annual incomes of $12,372 and $24,812, respectively. What race times would you predict? (Hint: No calculations are necessary). (b) What general principle is illustrated by this problem? Question
John Jones falls one standard deviation above the mean of X.
(a)If his predicted score on Y falls one standard deviation above what is the correlation between X and Y?
(b)If his predicted score on Y falls one-third of a standard deviation above what is the correlation between X and Y?
(a)If his predicted score on Y falls one standard deviation above
what is the correlation between X and Y?(b)If his predicted score on Y falls one-third of a standard deviation above
what is the correlation between X and Y? Question
For a large group of subjects: 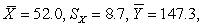
and
Captain Crunch obtains an X score of 52. What is his predicted Y score if (no calculations necessary):
(a)
(b)
(c)
(d)
(e)State the principal illustrated by your answers to (a) through (d).
and
Captain Crunch obtains an X score of 52. What is his predicted Y score if (no calculations necessary):
(a)
(b)
(c)
(d)
(e)State the principal illustrated by your answers to (a) through (d).
Question
Question
The following data are for freshman students at Spartan University: 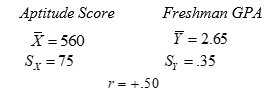
(a) Write the raw score regression equation for predicting Y from X and simplify it.
(b) John and Will score 485 and 710, respectively, on the aptitude test. Predict the freshman GPA for each.
(c) Compute the standard error of prediction.
(d) Set up the 95% confidence limits around John's and Will's predicted GPAs.
(e) For students with aptitude scores the same as John's, what proportion would be expected to obtain a GPA better than the freshman mean? What proportion would be expected to obtain a GPA of 2.0 or below?
(f) For students with aptitude scores the same as Will's, what proportion would be expected to obtain a GPA of 2.5 or better?
Question
The manager of an ice cream company wants a better basis for deciding how much ice cream to make each evening. He would like to be able to predict the amount of ice cream sold at his retail outlets on any day from the temperature forecast the evening before. He records both the evening temperature forecast (X) and the number of five-gallon containers of ice cream sold the next day (Y) over a considerable period in the late spring and early summer. The following results are obtained:
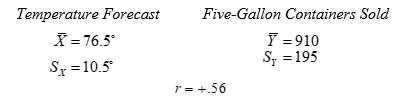
(a) Write the regression equation for predicting Y from X; simplify; and compute the standard error of prediction.
(b)Suppose the temperature forecast is for 96°. On what proportion of following days would he expect to sell over 1300 containers of ice cream?
(c)Suppose the forecast is for 50° and he plans to make 800 containers. For what proportion of the following days would this be too much ice cream?
(d)The regression equation is based on data gathered in the late spring and early summer. Will it "work" in midsummer, or in early fall?
Question
If 
A) X is of no use in predicting Y
B) values of Y can be predicted from values of X without error
C) either the X scores or the Y scores must be negative
D) the relationship becomes difficult to interpret
A) X is of no use in predicting Y
B) values of Y can be predicted from values of X without error
C) either the X scores or the Y scores must be negative
D) the relationship becomes difficult to interpret
Question
Question
Question
The regression line for predicting Y from X is drawn so that which of the following is minimized?
A)
B)
C)
D)
A)
B)
C)
D)
Question
Question
When the correlation is perfect, every value of ____________ is zero.
A)
B)
C)
D) all of the above
A)
B)
C)
D) all of the above
Question
Which term, if any, does not appear in the raw score regression equation?
A)
B)
C)
D) all appear in the raw score equation
A)
B)
C)
D) all appear in the raw score equation
Question
A standard score regression equation reads:  If the correlation coefficient is +.5 and Johnny is two standard deviations above the mean in X, what standard score position shall we predict for him in Y?
A) +2.0
B) +1.5
C) +1.0
D) none of the above
If the correlation coefficient is +.5 and Johnny is two standard deviations above the mean in X, what standard score position shall we predict for him in Y?A) +2.0
B) +1.5
C) +1.0
D) none of the above
Question
Question
What value of r leads us to predict that  no matter what the value of X?
A) 0
B) -1.00
C) +1.00
D) none of the above
no matter what the value of X?A) 0
B) -1.00
C) +1.00
D) none of the above
Question
When 
what z score in X leads us to a predicted Y score of

A) +.50
B) 0
C) -.50
D) none of the above
what z score in X leads us to a predicted Y score of
A) +.50
B) 0
C) -.50
D) none of the above
Question
Question
The raw score regression equation always
A) intersects the origin of the graph (the point where
and

B) intersects the point where
and

C) slopes from lower left to upper right
D) slopes from upper left to lower right
A) intersects the origin of the graph (the point where
and
B) intersects the point where
and
C) slopes from lower left to upper right
D) slopes from upper left to lower right
Question
 and
and 
;

and

If

and X is 40, what value do we predict for Y?
A) 120
B) 100
C) 90
D) 80
Question
 and
and 
;

and

If

and X is 40, what value do we predict for Y?
A) 120
B) 100
C) 90
D) 80
Question
 and
and 
;

and

If

and X is 40, what value do we predict for Y?
A) 120
B) 100
C) 80
D) 0
Question
 and
and 
;

and

If

and X is 40, what value do we predict for Y?
A) 120
B) 100
C) 90
D) 80
Question
Question
Question
Question
A formula for the standard error of estimate of Y on X is
A)
B)
C)
D) none of the above
A)
B)
C)
D) none of the above
Question

A)

B)

C)

D)

Question
Depending on the value of  may take values between
A) 0 and 1.00
B) 0 and SY
C) 0 and SX
D) SX and SY
may take values betweenA) 0 and 1.00
B) 0 and SY
C) 0 and SX
D) SX and SY
Question
 when
whenA)

B)

C)

D)

Question
 when
whenA)

B)

C)

D)

Question
When 
=

A)
B)
C) either (a) or (b) is true
D) r = 0
=
A)
B)
C) either (a) or (b) is true
D) r = 0
Question
In predicting Y from a particular value of X, we report 68% of obtained values of Y to fall within
A)
B)
C)
D)
A)
B)
C)
D)
Question
When homoscedasticity holds, then
A) Y variability is the same for all values of X
B)
C) Y variability is the same for X variability
D) both X and Y are expressed in standard score form
A) Y variability is the same for all values of X
B)
C) Y variability is the same for X variability
D) both X and Y are expressed in standard score form
Question
Question
Question
Question
When obtained values of Y are not normally distributed
A) is likely to be underestimated
B) is likely to be overestimated
C) the limits of predictive error are likely to be underestimated or overestimated
D) the standard error of estimate is likely to be too large or too small
A)
is likely to be underestimatedB)
is likely to be overestimatedC) the limits of predictive error are likely to be underestimated or overestimated
D) the standard error of estimate is likely to be too large or too small

Unlock Deck
Sign up to unlock the cards in this deck!
Unlock Deck
Unlock Deck
1/40
Play
Full screen (f)
Deck 8: Prediction
1
From the records of a large health maintenance organization, an investigator is able to gather a sizeable sample of men for whom heights at both age 10 and as adults are known. The following are the summary statistics for this sample:
(a) Use the above values to arrive at the raw-score regression equation for predicting height as an adult from height at age 10. Present the equation in simplest form.
(b) Use the regression equation from (a) to predict adult height for the following 10-year-olds: Benny (42.5 in.), Cal (55.3 in.), Arthur (50.1 in.).
(c) Consider Benny's predictable adult height. In what sense is that value a mean? Be very specific.
(a) .94X + 21.9
(b) Benny: 61.8, Cal: 73.9, Arthur: 69.0
(c) estimate of the mean adult height for a large group of 10-year-olds, all of whom are 42.5 in. tall.
(b) Benny: 61.8, Cal: 73.9, Arthur: 69.0
(c) estimate of the mean adult height for a large group of 10-year-olds, all of whom are 42.5 in. tall.
2
The following are the scores on a job selection test administered prior to hiring (X) and supervisor's ratings after 3 months on the job (Y) for a group of bank tellers (A-F):
(a) Compute from these data the summary statistics required for developing the raw-score regression equation for predicting supervisor's rating from job selection score.
(b) Use the values from (a) to arrive at the regression equation in simplest form.
(c) Three new applicants for teller positions obtain scores of 48, 62, and 72, respectively, on the selection test. Compute their predicted supervisor's ratings.
(d) If in fact the above data were real, what objection would you have to using the equation from (b) to predict in a "real-life" situation?
(a)  (b)
(b) 
(c)7.3, 8.9, 10.1 (answers obtained from regression equation as rounded in (b))
(d) regression equation based on far too few cases; it could well be considerably in error due to chance sampling variation.
(b) (c)7.3, 8.9, 10.1 (answers obtained from regression equation as rounded in (b))
(d) regression equation based on far too few cases; it could well be considerably in error due to chance sampling variation.
3
For the group of adult joggers competing in the Windy City Mini-marathon, the following are the summary statistics for annual income (X) and time to complete the race (Y):
(a) Jack L. and Linda P. have annual incomes of $12,372 and $24,812, respectively. What race times would you predict? (Hint: No calculations are necessary). (b) What general principle is illustrated by this problem?
(a) Jack L. and Linda P. have annual incomes of $12,372 and $24,812, respectively. What race times would you predict? (Hint: No calculations are necessary). (b) What general principle is illustrated by this problem?(a) 122.38 minutes for both
(b) when

the best prediction for every case is

(b) when
the best prediction for every case is
4
John Jones falls one standard deviation above the mean of X.
(a)If his predicted score on Y falls one standard deviation above what is the correlation between X and Y?
(b)If his predicted score on Y falls one-third of a standard deviation above what is the correlation between X and Y?
(a)If his predicted score on Y falls one standard deviation above
what is the correlation between X and Y?(b)If his predicted score on Y falls one-third of a standard deviation above
what is the correlation between X and Y? Unlock Deck
Unlock for access to all 40 flashcards in this deck.
Unlock Deck
k this deck
5
For a large group of subjects:
and
Captain Crunch obtains an X score of 52. What is his predicted Y score if (no calculations necessary):
(a)
(b)
(c)
(d)
(e)State the principal illustrated by your answers to (a) through (d).
and
Captain Crunch obtains an X score of 52. What is his predicted Y score if (no calculations necessary):
(a)
(b)
(c)
(d)
(e)State the principal illustrated by your answers to (a) through (d).
Unlock Deck
Unlock for access to all 40 flashcards in this deck.
Unlock Deck
k this deck
6
Consider the situation described from above. (a) Convert to z scores the heights of the following 10-year-olds: Benny (42.5 in.), Cal (55.3 in.), Arthur (50.1 in.), (b) Use the standard score form of the regression equation to obtain their predicted z scores for height as adults. (c) Convert the predicted z scores from (b) to predicted heights in inches and compare with the results Benny: 61.8, Cal: 73.9, Arthur: 69.0.
Unlock Deck
Unlock for access to all 40 flashcards in this deck.
Unlock Deck
k this deck
7
The following data are for freshman students at Spartan University:
(a) Write the raw score regression equation for predicting Y from X and simplify it.
(b) John and Will score 485 and 710, respectively, on the aptitude test. Predict the freshman GPA for each.
(c) Compute the standard error of prediction.
(d) Set up the 95% confidence limits around John's and Will's predicted GPAs.
(e) For students with aptitude scores the same as John's, what proportion would be expected to obtain a GPA better than the freshman mean? What proportion would be expected to obtain a GPA of 2.0 or below?
(f) For students with aptitude scores the same as Will's, what proportion would be expected to obtain a GPA of 2.5 or better?
Unlock Deck
Unlock for access to all 40 flashcards in this deck.
Unlock Deck
k this deck
8
The manager of an ice cream company wants a better basis for deciding how much ice cream to make each evening. He would like to be able to predict the amount of ice cream sold at his retail outlets on any day from the temperature forecast the evening before. He records both the evening temperature forecast (X) and the number of five-gallon containers of ice cream sold the next day (Y) over a considerable period in the late spring and early summer. The following results are obtained:
(a) Write the regression equation for predicting Y from X; simplify; and compute the standard error of prediction.
(b)Suppose the temperature forecast is for 96°. On what proportion of following days would he expect to sell over 1300 containers of ice cream?
(c)Suppose the forecast is for 50° and he plans to make 800 containers. For what proportion of the following days would this be too much ice cream?
(d)The regression equation is based on data gathered in the late spring and early summer. Will it "work" in midsummer, or in early fall?
Unlock Deck
Unlock for access to all 40 flashcards in this deck.
Unlock Deck
k this deck
9
If
A) X is of no use in predicting Y
B) values of Y can be predicted from values of X without error
C) either the X scores or the Y scores must be negative
D) the relationship becomes difficult to interpret
A) X is of no use in predicting Y
B) values of Y can be predicted from values of X without error
C) either the X scores or the Y scores must be negative
D) the relationship becomes difficult to interpret
Unlock Deck
Unlock for access to all 40 flashcards in this deck.
Unlock Deck
k this deck
10
In concept, the regression line is most closely related to the
A) mean
B) median
C) standard deviation
D) variance
A) mean
B) median
C) standard deviation
D) variance
Unlock Deck
Unlock for access to all 40 flashcards in this deck.
Unlock Deck
k this deck
11
In a problem where we are predicting Y from X, which of the following can be considered a mean?
A) predicted value
B) zX
C) error of estimate
D) zY
A) predicted value
B) zX
C) error of estimate
D) zY
Unlock Deck
Unlock for access to all 40 flashcards in this deck.
Unlock Deck
k this deck
12
The regression line for predicting Y from X is drawn so that which of the following is minimized?
A)
B)
C)
D)
A)
B)
C)
D)
Unlock Deck
Unlock for access to all 40 flashcards in this deck.
Unlock Deck
k this deck
13
In predicting Y from X, the regression line is laid down so that the squared discrepancies between points and the line are minimized
A) in the X dimension
B) in the Y dimension
C) in a direction perpendicular to the line
D) in all of the above dimensions
A) in the X dimension
B) in the Y dimension
C) in a direction perpendicular to the line
D) in all of the above dimensions
Unlock Deck
Unlock for access to all 40 flashcards in this deck.
Unlock Deck
k this deck
14
When the correlation is perfect, every value of ____________ is zero.
A)
B)
C)
D) all of the above
A)
B)
C)
D) all of the above
Unlock Deck
Unlock for access to all 40 flashcards in this deck.
Unlock Deck
k this deck
15
Which term, if any, does not appear in the raw score regression equation?
A)
B)
C)
D) all appear in the raw score equation
A)
B)
C)
D) all appear in the raw score equation
Unlock Deck
Unlock for access to all 40 flashcards in this deck.
Unlock Deck
k this deck
16
A standard score regression equation reads: If the correlation coefficient is +.5 and Johnny is two standard deviations above the mean in X, what standard score position shall we predict for him in Y?
A) +2.0
B) +1.5
C) +1.0
D) none of the above
If the correlation coefficient is +.5 and Johnny is two standard deviations above the mean in X, what standard score position shall we predict for him in Y?A) +2.0
B) +1.5
C) +1.0
D) none of the above
Unlock Deck
Unlock for access to all 40 flashcards in this deck.
Unlock Deck
k this deck
17
For what value of r does a particular z score in X lead us to predict the same z score in Y?
A) 0
B) -1.00
C) +1.00
D) both (b) and (c)
A) 0
B) -1.00
C) +1.00
D) both (b) and (c)
Unlock Deck
Unlock for access to all 40 flashcards in this deck.
Unlock Deck
k this deck
18
What value of r leads us to predict that no matter what the value of X?
A) 0
B) -1.00
C) +1.00
D) none of the above
no matter what the value of X?A) 0
B) -1.00
C) +1.00
D) none of the above
Unlock Deck
Unlock for access to all 40 flashcards in this deck.
Unlock Deck
k this deck
19
When
what z score in X leads us to a predicted Y score of
A) +.50
B) 0
C) -.50
D) none of the above
what z score in X leads us to a predicted Y score of
A) +.50
B) 0
C) -.50
D) none of the above
Unlock Deck
Unlock for access to all 40 flashcards in this deck.
Unlock Deck
k this deck
20
Which value of r permits the greatest accuracy of prediction?
A) +.78
B) +.27
C) -.37
D)-.81
A) +.78
B) +.27
C) -.37
D)-.81
Unlock Deck
Unlock for access to all 40 flashcards in this deck.
Unlock Deck
k this deck
21
The raw score regression equation always
A) intersects the origin of the graph (the point where
and
B) intersects the point where
and
C) slopes from lower left to upper right
D) slopes from upper left to lower right
A) intersects the origin of the graph (the point where
and
B) intersects the point where
and
C) slopes from lower left to upper right
D) slopes from upper left to lower right
Unlock Deck
Unlock for access to all 40 flashcards in this deck.
Unlock Deck
k this deck
22
and ;
and
If
and X is 40, what value do we predict for Y?
A) 120
B) 100
C) 90
D) 80
Unlock Deck
Unlock for access to all 40 flashcards in this deck.
Unlock Deck
k this deck
23
and ;
and
If
and X is 40, what value do we predict for Y?
A) 120
B) 100
C) 90
D) 80
Unlock Deck
Unlock for access to all 40 flashcards in this deck.
Unlock Deck
k this deck
24
and ;
and
If
and X is 40, what value do we predict for Y?
A) 120
B) 100
C) 80
D) 0
Unlock Deck
Unlock for access to all 40 flashcards in this deck.
Unlock Deck
k this deck
25
and ;
and
If
and X is 40, what value do we predict for Y?
A) 120
B) 100
C) 90
D) 80
Unlock Deck
Unlock for access to all 40 flashcards in this deck.
Unlock Deck
k this deck
26
The least squares line of regression for predicting Y from X minimizes
A) SY
B) SY and SX
C) SYX
D) SY'
A) SY
B) SY and SX
C) SYX
D) SY'
Unlock Deck
Unlock for access to all 40 flashcards in this deck.
Unlock Deck
k this deck
27
The standard error of estimate measures variability of
A) predicted scores around the mean
B) predicted scores around the regression line
C) obtained scores around the mean
D) obtained scores around the regression line
A) predicted scores around the mean
B) predicted scores around the regression line
C) obtained scores around the mean
D) obtained scores around the regression line
Unlock Deck
Unlock for access to all 40 flashcards in this deck.
Unlock Deck
k this deck
28
The standard error of estimate is a kind of
A) mean
B) median
C) standard deviation
D) variance
A) mean
B) median
C) standard deviation
D) variance
Unlock Deck
Unlock for access to all 40 flashcards in this deck.
Unlock Deck
k this deck
29
A formula for the standard error of estimate of Y on X is
A)
B)
C)
D) none of the above
A)
B)
C)
D) none of the above
Unlock Deck
Unlock for access to all 40 flashcards in this deck.
Unlock Deck
k this deck
30
A)
B)
C)
D)
Unlock Deck
Unlock for access to all 40 flashcards in this deck.
Unlock Deck
k this deck
31
Depending on the value of may take values between
A) 0 and 1.00
B) 0 and SY
C) 0 and SX
D) SX and SY
may take values betweenA) 0 and 1.00
B) 0 and SY
C) 0 and SX
D) SX and SY
Unlock Deck
Unlock for access to all 40 flashcards in this deck.
Unlock Deck
k this deck
32
whenA)
B)
C)
D)
Unlock Deck
Unlock for access to all 40 flashcards in this deck.
Unlock Deck
k this deck
33
whenA)
B)
C)
D)
Unlock Deck
Unlock for access to all 40 flashcards in this deck.
Unlock Deck
k this deck
34
When
=
A)
B)
C) either (a) or (b) is true
D) r = 0
=
A)
B)
C) either (a) or (b) is true
D) r = 0
Unlock Deck
Unlock for access to all 40 flashcards in this deck.
Unlock Deck
k this deck
35
In predicting Y from a particular value of X, we report 68% of obtained values of Y to fall within
A)
B)
C)
D)
A)
B)
C)
D)
Unlock Deck
Unlock for access to all 40 flashcards in this deck.
Unlock Deck
k this deck
36
When homoscedasticity holds, then
A) Y variability is the same for all values of X
B)
C) Y variability is the same for X variability
D) both X and Y are expressed in standard score form
A) Y variability is the same for all values of X
B)
C) Y variability is the same for X variability
D) both X and Y are expressed in standard score form
Unlock Deck
Unlock for access to all 40 flashcards in this deck.
Unlock Deck
k this deck
37
Accuracy of prediction by the regression equation is enhanced by
A) large samples
B) a linear relationship
C) both of the above
D) none of the above
A) large samples
B) a linear relationship
C) both of the above
D) none of the above
Unlock Deck
Unlock for access to all 40 flashcards in this deck.
Unlock Deck
k this deck
38
If prediction is made from the Pearsonian regression line and linearity of regression does not hold, the predicted value of Y will be
A) an overestimate of Y
B) an underestimate of Y
C) sometimes an overestimate and sometimes an underestimate of Y
D) satisfactory only if the Y distribution is homoscedastic
A) an overestimate of Y
B) an underestimate of Y
C) sometimes an overestimate and sometimes an underestimate of Y
D) satisfactory only if the Y distribution is homoscedastic
Unlock Deck
Unlock for access to all 40 flashcards in this deck.
Unlock Deck
k this deck
39
Estimates of predictive error utilizing the regression equation and the standard error of estimate are affected by random sampling variation. When this factor is taken into account, it is found that error estimates made by the methods of this chapter are generally
A) correct only on the average
B) larger than they should be
C) smaller than they should be
D) correct only for small samples
A) correct only on the average
B) larger than they should be
C) smaller than they should be
D) correct only for small samples
Unlock Deck
Unlock for access to all 40 flashcards in this deck.
Unlock Deck
k this deck
40
When obtained values of Y are not normally distributed
A) is likely to be underestimated
B) is likely to be overestimated
C) the limits of predictive error are likely to be underestimated or overestimated
D) the standard error of estimate is likely to be too large or too small
A)
is likely to be underestimatedB)
is likely to be overestimatedC) the limits of predictive error are likely to be underestimated or overestimated
D) the standard error of estimate is likely to be too large or too small
Unlock Deck
Unlock for access to all 40 flashcards in this deck.
Unlock Deck
k this deck
Unlock Deck
Unlock for access to all 40 flashcards in this deck.


