Deck 5: Inference From Data: Comparisons
Full screen (f)
Question
Question
Question
Question
Question
Question
Question
Question
Question
Question
Random samples of monthly rent prices, in dollars, for studio and one-bedroom apartments, were obtained for the Pennsylvania cities of Harrisburg and Philadelphia in July 2007. Summary statistics are calculated here: 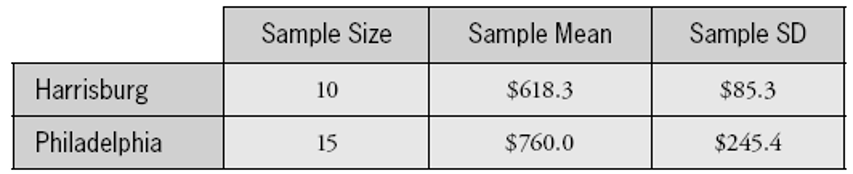 Conduct a test of whether the sample data provide sufficient evidence at the significance level to conclude that the population mean rent price differs between these two cities. Be sure to report:
-Null and alternative hypotheses
Conduct a test of whether the sample data provide sufficient evidence at the significance level to conclude that the population mean rent price differs between these two cities. Be sure to report:-Null and alternative hypotheses
Question
Random samples of monthly rent prices, in dollars, for studio and one-bedroom apartments, were obtained for the Pennsylvania cities of Harrisburg and Philadelphia in July 2007. Summary statistics are calculated here: Conduct a test of whether the sample data provide sufficient evidence at the significance level to conclude that the population mean rent price differs between these two cities. Be sure to report:
-Test statistic
Conduct a test of whether the sample data provide sufficient evidence at the significance level to conclude that the population mean rent price differs between these two cities. Be sure to report:-Test statistic
Question
Random samples of monthly rent prices, in dollars, for studio and one-bedroom apartments, were obtained for the Pennsylvania cities of Harrisburg and Philadelphia in July 2007. Summary statistics are calculated here: Conduct a test of whether the sample data provide sufficient evidence at the significance level to conclude that the population mean rent price differs between these two cities. Be sure to report:
- -value
Conduct a test of whether the sample data provide sufficient evidence at the significance level to conclude that the population mean rent price differs between these two cities. Be sure to report:- -value
Question
Random samples of monthly rent prices, in dollars, for studio and one-bedroom apartments, were obtained for the Pennsylvania cities of Harrisburg and Philadelphia in July 2007. Summary statistics are calculated here: Conduct a test of whether the sample data provide sufficient evidence at the significance level to conclude that the population mean rent price differs between these two cities. Be sure to report:
-Test decision and conclusion in context
Conduct a test of whether the sample data provide sufficient evidence at the significance level to conclude that the population mean rent price differs between these two cities. Be sure to report:-Test decision and conclusion in context
Question
Random samples of monthly rent prices, in dollars, for studio and one-bedroom apartments, were obtained for the Pennsylvania cities of Harrisburg and Philadelphia in July 2007. Summary statistics are calculated here: Conduct a test of whether the sample data provide sufficient evidence at the significance level to conclude that the population mean rent price differs between these two cities. Be sure to report:
-Check of technical conditions, mentioning any additional information that you would need to conduct this check
Conduct a test of whether the sample data provide sufficient evidence at the significance level to conclude that the population mean rent price differs between these two cities. Be sure to report:-Check of technical conditions, mentioning any additional information that you would need to conduct this check
Question
Question
Question
Question
Question
Question
Question
Question

Unlock Deck
Sign up to unlock the cards in this deck!
Unlock Deck
Unlock Deck
1/22
Play
Full screen (f)
Deck 5: Inference From Data: Comparisons
1
In a national study of American high school students in 2006, researchers asked students whether they have cheated on a test in the past year.
-State the appropriate null and alternative hypotheses for testing whether the proportion of male students who admit to cheating is higher than that of female students.
Researchers found that of the male students admitted to cheating, compared to of female students.
-State the appropriate null and alternative hypotheses for testing whether the proportion of male students who admit to cheating is higher than that of female students.
Researchers found that of the male students admitted to cheating, compared to of female students.
The null hypothesis is that the proportion of all male American high school students who admit to cheating is the same as the proportion of all female American high school students who admit to cheating. In symbols, .
The alternative hypothesis is that the proportion of all male American high school students who admit to cheating is greater than the proportion of all female American high school students who admit to cheating. In symbols, .
The alternative hypothesis is that the proportion of all male American high school students who admit to cheating is greater than the proportion of all female American high school students who admit to cheating. In symbols, .
2
In a national study of American high school students in 2006, researchers asked students whether they have cheated on a test in the past year.
-What further information would you need in order to conduct the test?
-What further information would you need in order to conduct the test?
In order to conduct the test, you would also need to know the number of male and the number of female students in the study.
3
In a national study of American high school students in 2006, researchers asked students whether they have cheated on a test in the past year.
-What additional information would you ask about how the data were collected in order to check whether the technical conditions are met?
-What additional information would you ask about how the data were collected in order to check whether the technical conditions are met?
In order to check whether the technical conditions were met, you should also ask whether the students were randomly selected from among all male and female high school students.
4
In a national study of American high school students in 2006, researchers asked students whether they have cheated on a test in the past year.
-Suppose the technical conditions are met and the test statistic turns out to be . Summarize the conclusion that you would draw from this test.
-Suppose the technical conditions are met and the test statistic turns out to be . Summarize the conclusion that you would draw from this test.
Unlock Deck
Unlock for access to all 22 flashcards in this deck.
Unlock Deck
k this deck
5
Suppose that you are conducting a study to compare the proportion of people who have a certain disease between people who classify themselves as active vs. sedentary. For questions , suppose the study produces a very small -value.
-Would it be legitimate to conclude that the two groups differ significantly with regard to the proportion who have the disease? Explain briefly.
-Would it be legitimate to conclude that the two groups differ significantly with regard to the proportion who have the disease? Explain briefly.
Unlock Deck
Unlock for access to all 22 flashcards in this deck.
Unlock Deck
k this deck
6
Suppose that you are conducting a study to compare the proportion of people who have a certain disease between people who classify themselves as active vs. sedentary. For questions , suppose the study produces a very small -value.
-Would it be legitimate to conclude that the activity level causes a difference in disease proportions between the two groups? Explain briefly.
-Would it be legitimate to conclude that the activity level causes a difference in disease proportions between the two groups? Explain briefly.
Unlock Deck
Unlock for access to all 22 flashcards in this deck.
Unlock Deck
k this deck
7
Suppose that you are conducting a study to compare the proportion of people who have a certain disease between people who classify themselves as active vs. sedentary. For questions , suppose the study produces a very small -value.
-Based on this -value, would it be legitimate to conclude that the two groups have a large and important difference with regard to the proportion who have the disease? Explain briefly.
-Based on this -value, would it be legitimate to conclude that the two groups have a large and important difference with regard to the proportion who have the disease? Explain briefly.
Unlock Deck
Unlock for access to all 22 flashcards in this deck.
Unlock Deck
k this deck
8
Suppose that you are conducting a study to compare the proportion of people who have a certain disease between people who classify themselves as active vs. sedentary. For questions suppose that the study produces a fairly large -value.
-Would it be legitimate to conclude that the two populations have identical proportions with the disease? Explain briefly.
-Would it be legitimate to conclude that the two populations have identical proportions with the disease? Explain briefly.
Unlock Deck
Unlock for access to all 22 flashcards in this deck.
Unlock Deck
k this deck
9
Suppose that you are conducting a study to compare the proportion of people who have a certain disease between people who classify themselves as active vs. sedentary. For questions suppose that the study produces a fairly large -value.
-Would a confidence interval for the difference in population proportions include the value zero? Explain briefly.
-Would a confidence interval for the difference in population proportions include the value zero? Explain briefly.
Unlock Deck
Unlock for access to all 22 flashcards in this deck.
Unlock Deck
k this deck
10
Random samples of monthly rent prices, in dollars, for studio and one-bedroom apartments, were obtained for the Pennsylvania cities of Harrisburg and Philadelphia in July 2007. Summary statistics are calculated here: Conduct a test of whether the sample data provide sufficient evidence at the significance level to conclude that the population mean rent price differs between these two cities. Be sure to report:
-Null and alternative hypotheses
Conduct a test of whether the sample data provide sufficient evidence at the significance level to conclude that the population mean rent price differs between these two cities. Be sure to report:-Null and alternative hypotheses
Unlock Deck
Unlock for access to all 22 flashcards in this deck.
Unlock Deck
k this deck
11
Random samples of monthly rent prices, in dollars, for studio and one-bedroom apartments, were obtained for the Pennsylvania cities of Harrisburg and Philadelphia in July 2007. Summary statistics are calculated here: Conduct a test of whether the sample data provide sufficient evidence at the significance level to conclude that the population mean rent price differs between these two cities. Be sure to report:
-Test statistic
Conduct a test of whether the sample data provide sufficient evidence at the significance level to conclude that the population mean rent price differs between these two cities. Be sure to report:-Test statistic
Unlock Deck
Unlock for access to all 22 flashcards in this deck.
Unlock Deck
k this deck
12
Random samples of monthly rent prices, in dollars, for studio and one-bedroom apartments, were obtained for the Pennsylvania cities of Harrisburg and Philadelphia in July 2007. Summary statistics are calculated here: Conduct a test of whether the sample data provide sufficient evidence at the significance level to conclude that the population mean rent price differs between these two cities. Be sure to report:
- -value
Conduct a test of whether the sample data provide sufficient evidence at the significance level to conclude that the population mean rent price differs between these two cities. Be sure to report:- -value
Unlock Deck
Unlock for access to all 22 flashcards in this deck.
Unlock Deck
k this deck
13
Random samples of monthly rent prices, in dollars, for studio and one-bedroom apartments, were obtained for the Pennsylvania cities of Harrisburg and Philadelphia in July 2007. Summary statistics are calculated here: Conduct a test of whether the sample data provide sufficient evidence at the significance level to conclude that the population mean rent price differs between these two cities. Be sure to report:
-Test decision and conclusion in context
Conduct a test of whether the sample data provide sufficient evidence at the significance level to conclude that the population mean rent price differs between these two cities. Be sure to report:-Test decision and conclusion in context
Unlock Deck
Unlock for access to all 22 flashcards in this deck.
Unlock Deck
k this deck
14
Random samples of monthly rent prices, in dollars, for studio and one-bedroom apartments, were obtained for the Pennsylvania cities of Harrisburg and Philadelphia in July 2007. Summary statistics are calculated here: Conduct a test of whether the sample data provide sufficient evidence at the significance level to conclude that the population mean rent price differs between these two cities. Be sure to report:
-Check of technical conditions, mentioning any additional information that you would need to conduct this check
Conduct a test of whether the sample data provide sufficient evidence at the significance level to conclude that the population mean rent price differs between these two cities. Be sure to report:-Check of technical conditions, mentioning any additional information that you would need to conduct this check
Unlock Deck
Unlock for access to all 22 flashcards in this deck.
Unlock Deck
k this deck
15
Random samples of monthly rent prices, in dollars, for studio and one-bedroom apartments, were obtained for the Pennsylvania cities of Harrisburg and Philadelphia in July 2007. A 90% confidence interval for the difference in population means turns out to be (-$261.1, -$22.3).
-Write a sentence or two interpreting what this interval reveals about the average difference between rents in Harrisburg and Philadelphia.
-Write a sentence or two interpreting what this interval reveals about the average difference between rents in Harrisburg and Philadelphia.
Unlock Deck
Unlock for access to all 22 flashcards in this deck.
Unlock Deck
k this deck
16
Random samples of monthly rent prices, in dollars, for studio and one-bedroom apartments, were obtained for the Pennsylvania cities of Harrisburg and Philadelphia in July 2007. A 90% confidence interval for the difference in population means turns out to be (-$261.1, -$22.3).
-Determine the midpoint of this interval.
-Determine the midpoint of this interval.
Unlock Deck
Unlock for access to all 22 flashcards in this deck.
Unlock Deck
k this deck
17
Random samples of monthly rent prices, in dollars, for studio and one-bedroom apartments, were obtained for the Pennsylvania cities of Harrisburg and Philadelphia in July 2007. A 90% confidence interval for the difference in population means turns out to be (-$261.1, -$22.3).
-Determine the half-width of this interval.
-Determine the half-width of this interval.
Unlock Deck
Unlock for access to all 22 flashcards in this deck.
Unlock Deck
k this deck
18
Random samples of monthly rent prices, in dollars, for studio and one-bedroom apartments, were obtained for the Pennsylvania cities of Harrisburg and Philadelphia in July 2007. A 90% confidence interval for the difference in population means turns out to be (-$261.1, -$22.3).
-Comment on how the interval would change (both its midpoint and half-width) if you were instead to calculate a CI for .
-Comment on how the interval would change (both its midpoint and half-width) if you were instead to calculate a CI for .
Unlock Deck
Unlock for access to all 22 flashcards in this deck.
Unlock Deck
k this deck
19
Random samples of monthly rent prices, in dollars, for studio and one-bedroom apartments, were obtained for the Pennsylvania cities of Harrisburg and Philadelphia in July 2007. A 90% confidence interval for the difference in population means turns out to be (-$261.1, -$22.3).
-Comment on how the interval would change (both its midpoint and half-width) if you were instead to calculate a CI for . (Notice that the order of subtraction has changed here.)
-Comment on how the interval would change (both its midpoint and half-width) if you were instead to calculate a CI for . (Notice that the order of subtraction has changed here.)
Unlock Deck
Unlock for access to all 22 flashcards in this deck.
Unlock Deck
k this deck
20
Consider examining the ages of a random sample of married couples in order to study whether husbands tend to be older than their wives on average.
-Would this research question call for a one-sided alternative or a two-sided alternative? Explain briefly.
-Would this research question call for a one-sided alternative or a two-sided alternative? Explain briefly.
Unlock Deck
Unlock for access to all 22 flashcards in this deck.
Unlock Deck
k this deck
21
Consider examining the ages of a random sample of married couples in order to study whether husbands tend to be older than their wives on average.
-Create a hypothetical example of ten couples' ages so that the husband is older in only five of the ten couples, but the paired -test is statistically significant in showing that husbands tend to be older than their wives on average. (You do not need to give individual ages of husbands and wives; you need only report the ten age differences (husband's age minus wife's age). You do not need to calculate the test statistic and -value; simply try to create the age differences so the test would be significant if you were to work it out.) Explain your reasoning.
-Create a hypothetical example of ten couples' ages so that the husband is older in only five of the ten couples, but the paired -test is statistically significant in showing that husbands tend to be older than their wives on average. (You do not need to give individual ages of husbands and wives; you need only report the ten age differences (husband's age minus wife's age). You do not need to calculate the test statistic and -value; simply try to create the age differences so the test would be significant if you were to work it out.) Explain your reasoning.
Unlock Deck
Unlock for access to all 22 flashcards in this deck.
Unlock Deck
k this deck
22
Consider examining the ages of a random sample of married couples in order to study whether husbands tend to be older than their wives on average.
-Create a hypothetical example of ten couples' ages so that the husband is older for eight of the ten couples, but the paired -test is not statistically significant in showing that husbands tend to be older than their wives on average. (Again you need only report the ten age differences, and you do not need to determine the test statistic and -value.) Explain your reasoning.
-Create a hypothetical example of ten couples' ages so that the husband is older for eight of the ten couples, but the paired -test is not statistically significant in showing that husbands tend to be older than their wives on average. (Again you need only report the ten age differences, and you do not need to determine the test statistic and -value.) Explain your reasoning.
Unlock Deck
Unlock for access to all 22 flashcards in this deck.
Unlock Deck
k this deck
Unlock Deck
Unlock for access to all 22 flashcards in this deck.


