Deck 2: Summarizing Data
Full screen (f)
Question
Question
Question
Question
Question
Question
Is it better to praise a child's intelligence or effort? In a study reported in a 1998 issue of the Journal of Personality and Social Psychology, researchers investigated this question by randomly assigning fifthgraders into three groups. One group received praise for their intelligence after working on a set of problems; another group received praise for their effort; and a third (control) group received general praise that did not mention a specific attribute. Each child was then asked to write a description of the problems for a child in another state, including how many he or she solved correctly. One response variable was whether the child lied about how many problems he/she had solved correctly. The data are organized in the following table: 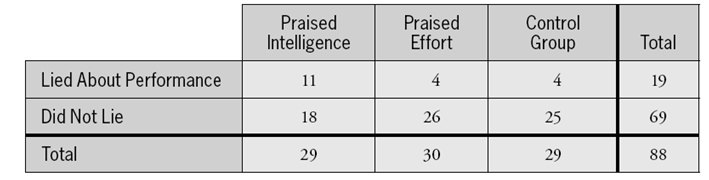
-Analyze these data to investigate whether they suggest any relationship between the type of praise given to a child and the child's propensity for lying about performance. Write a paragraph describing your findings, and support your findings with a graphical display and calculations.
-Analyze these data to investigate whether they suggest any relationship between the type of praise given to a child and the child's propensity for lying about performance. Write a paragraph describing your findings, and support your findings with a graphical display and calculations.
Question
The following side-by-side stemplot displays the total number of points scored per Super Bowl football game for the first 41 Super Bowls (from 1967-2007), separated according to the first 20 games (19671986) and the next 21 games (1987-2007): 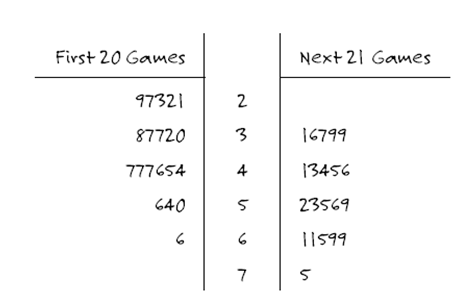
-Does this stemplot enable you to determine how many points were scored in the first Super Bowl? If so, what is this number?
-Does this stemplot enable you to determine how many points were scored in the first Super Bowl? If so, what is this number?
Question
The following side-by-side stemplot displays the total number of points scored per Super Bowl football game for the first 41 Super Bowls (from 1967-2007), separated according to the first 20 games (19671986) and the next 21 games (1987-2007):
-Does this stemplot enable you to determine how many of the first 41 Super Bowls had a total of 37 points? If so, what is this number?
-Does this stemplot enable you to determine how many of the first 41 Super Bowls had a total of 37 points? If so, what is this number?
Question
The following side-by-side stemplot displays the total number of points scored per Super Bowl football game for the first 41 Super Bowls (from 1967-2007), separated according to the first 20 games (19671986) and the next 21 games (1987-2007):
-Does this stemplot provide evidence that Super Bowl games have become more high-scoring over time, more low-scoring over time, or neither? Explain.
-Does this stemplot provide evidence that Super Bowl games have become more high-scoring over time, more low-scoring over time, or neither? Explain.
Question
The following side-by-side stemplot displays the total number of points scored per Super Bowl football game for the first 41 Super Bowls (from 1967-2007), separated according to the first 20 games (19671986) and the next 21 games (1987-2007):
-The five lowest-scoring Super Bowls were all played among the first 20 games.
-The five lowest-scoring Super Bowls were all played among the first 20 games.
Question
The following side-by-side stemplot displays the total number of points scored per Super Bowl football game for the first 41 Super Bowls (from 1967-2007), separated according to the first 20 games (19671986) and the next 21 games (1987-2007):
-The five highest-scoring Super Bowls were all played among the next 21 games.
-The five highest-scoring Super Bowls were all played among the next 21 games.
Question
The following histogram displays the magnitudes of the 614 earthquakes with Richter scale magnitude greater than 1.0 that occurred in the United States between March 25 and April 1, 2004: 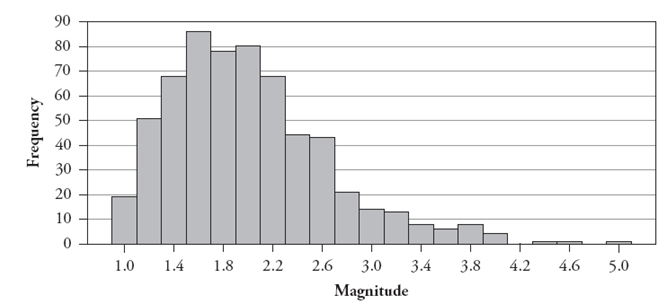
-Describe the shape of this distribution.
-Describe the shape of this distribution.
Question
The following histogram displays the magnitudes of the 614 earthquakes with Richter scale magnitude greater than 1.0 that occurred in the United States between March 25 and April 1, 2004:
-Is the percentage of earthquakes of magnitude 3.0 or higher closest to , or ?
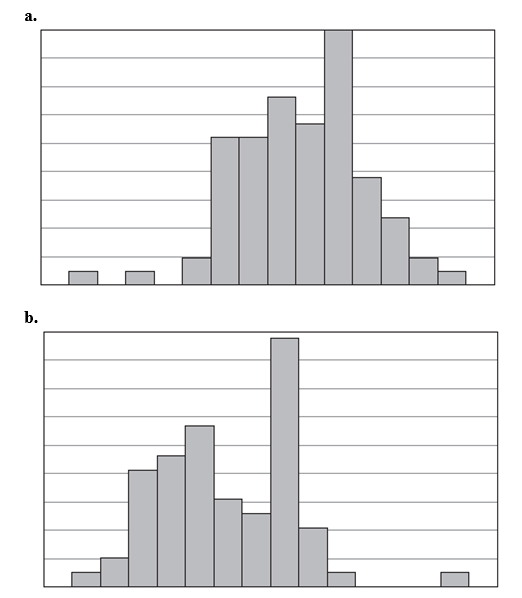
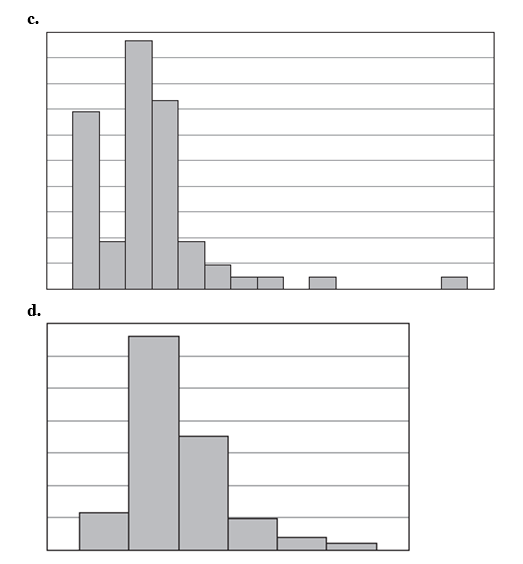
The following histograms display student responses to several questions on a course survey taken during the first day of a statistics class.
-Is the percentage of earthquakes of magnitude 3.0 or higher closest to , or ?
The following histograms display student responses to several questions on a course survey taken during the first day of a statistics class.
Question
The following histogram displays the magnitudes of the 614 earthquakes with Richter scale magnitude greater than 1.0 that occurred in the United States between March 25 and April 1, 2004:
-Which histogram do you think displays the variable number of siblings? Justify your answer.
-Which histogram do you think displays the variable number of siblings? Justify your answer.
Question
The following histogram displays the magnitudes of the 614 earthquakes with Richter scale magnitude greater than 1.0 that occurred in the United States between March 25 and April 1, 2004:
-Which histogram do you think displays the variable price paid for most recent haircut? Justify your answer.
-Which histogram do you think displays the variable price paid for most recent haircut? Justify your answer.
Question
The following histogram displays the magnitudes of the 614 earthquakes with Richter scale magnitude greater than 1.0 that occurred in the United States between March 25 and April 1, 2004:
-Which histogram do you think displays the variable height? Justify your answer.
-Which histogram do you think displays the variable height? Justify your answer.
Question
The following table reports counts of the number of "close friends" reported by a sample of men and a sample of women: 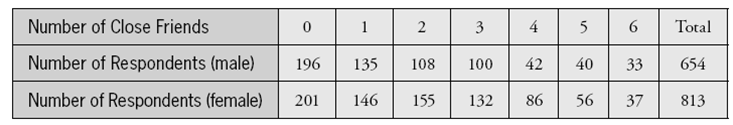
-Is number of close friends a quantitative or categorical variable?
-Is number of close friends a quantitative or categorical variable?
Question
The following table reports counts of the number of "close friends" reported by a sample of men and a sample of women:
-Are these distributions roughly symmetric, skewed to the left, or skewed to the right? Explain briefly. (You do not need to construct any graphs.)
-Are these distributions roughly symmetric, skewed to the left, or skewed to the right? Explain briefly. (You do not need to construct any graphs.)
Question
The following table reports counts of the number of "close friends" reported by a sample of men and a sample of women:
-Calculate the median number of close friends for each gender.
-Calculate the median number of close friends for each gender.
Question
The following table reports counts of the number of "close friends" reported by a sample of men and a sample of women:
-Based on the shape of the distributions, do you expect the means to be greater than the medians, less than the medians, or very close to the medians? (Do not calculate either mean.)
-Based on the shape of the distributions, do you expect the means to be greater than the medians, less than the medians, or very close to the medians? (Do not calculate either mean.)
Question
The following table reports counts of the number of "close friends" reported by a sample of men and a sample of women:
-For each gender, calculate the proportion who say that they have no close friends. Comment on how these proportions compare between men and women.
-For each gender, calculate the proportion who say that they have no close friends. Comment on how these proportions compare between men and women.
Question
Question
Question
Question
Question
Question
Question
Question
Question
Question
Question
The following histograms display the distributions of percentage of a state's residents who are Mexican, for each region of the country (West, South, Northeast, Midwest). 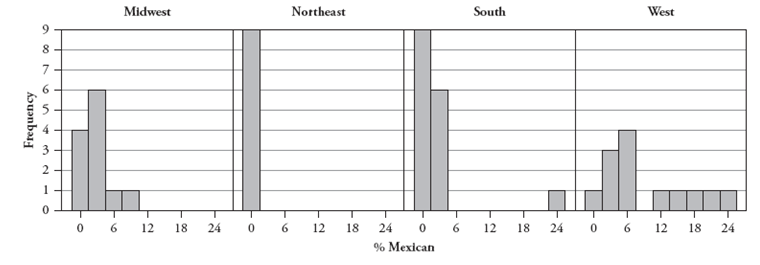
-Which region do you suspect has the smallest standard deviation in these percentages? Explain.
-Which region do you suspect has the smallest standard deviation in these percentages? Explain.
Question
The following histograms display the distributions of percentage of a state's residents who are Mexican, for each region of the country (West, South, Northeast, Midwest).
-Which region do you suspect has the largest standard deviation in percentages? Explain.
-Which region do you suspect has the largest standard deviation in percentages? Explain.
Question
The following histograms display the distributions of percentage of a state's residents who are Mexican, for each region of the country (West, South, Northeast, Midwest).
-For the south region, would you recommend reporting the standard deviation or the interquartile range as your measure of the spread of the distribution? Explain.
-For the south region, would you recommend reporting the standard deviation or the interquartile range as your measure of the spread of the distribution? Explain.
Question
The following histograms display the distributions of percentage of a state's residents who are Mexican, for each region of the country (West, South, Northeast, Midwest).
-Which of the following sets of five numbers has the smallest standard deviation? Explain your reasoning, but do not do any calculations.
(a)
(b)
(c)
-Which of the following sets of five numbers has the smallest standard deviation? Explain your reasoning, but do not do any calculations.
(a)
(b)
(c)
Question
The following histograms display the distributions of percentage of a state's residents who are Mexican, for each region of the country (West, South, Northeast, Midwest).
-Which of these three sets of numbers (above) has the largest standard deviation? Explain your reasoning, but do not do any calculations.
-Which of these three sets of numbers (above) has the largest standard deviation? Explain your reasoning, but do not do any calculations.
Question
Question
Question
Question
The following side-by-side stemplot displays the total number of points scored per Super Bowl football game for the first 41 Super Bowls (from 1967-2007), separated according to the first 20 games (19671986) and the next 21 games (1987-2007): 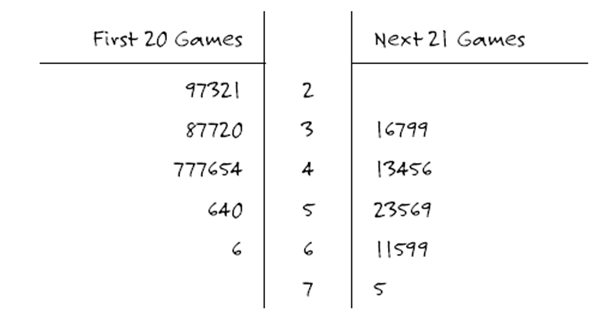
-For each group, determine the five-number summary of these total points.
-For each group, determine the five-number summary of these total points.
Question
The following side-by-side stemplot displays the total number of points scored per Super Bowl football game for the first 41 Super Bowls (from 1967-2007), separated according to the first 20 games (19671986) and the next 21 games (1987-2007):
-Construct boxplots of the distributions of total points in these two groups, using the same axes and scale. (Do not bother to check for outliers; there are no outliers in either distribution.)
-Construct boxplots of the distributions of total points in these two groups, using the same axes and scale. (Do not bother to check for outliers; there are no outliers in either distribution.)
Question
The following side-by-side stemplot displays the total number of points scored per Super Bowl football game for the first 41 Super Bowls (from 1967-2007), separated according to the first 20 games (19671986) and the next 21 games (1987-2007):
-Compare and contrast the distributions of total points between these two groups. Refer to appropriate calculations and displays to support your comments.
-Compare and contrast the distributions of total points between these two groups. Refer to appropriate calculations and displays to support your comments.
Question
An instructor conducted an in-class experiment where students memorized as many letters as possible from a strip of paper. Everyone received the same letters in the same order, but some students saw the letters in convenient three-letter groupings (such as JFK-CIA) whereas others saw less convenient groupings (such as JFKCIAF). Boxplots of the number of letters memorized correctly appear below:
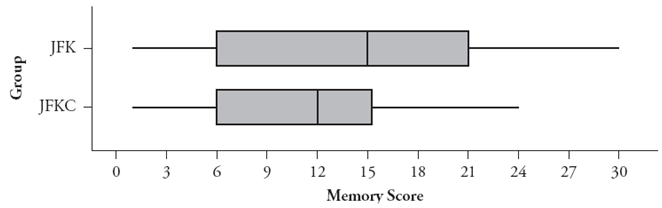 a. Report (as accurately as possible from the graph) the median score for each group:
JFK:
JFKC:
b. Report (as accurately as possible from the graph) the interquartile range for each group:
JFK:
JFKC:
c. Do the boxplots provide any evidence that students who received the letters in convenient three-letter groupings were able to memorize more letters than the other group? Explain briefly.
a. Report (as accurately as possible from the graph) the median score for each group:JFK:
JFKC:
b. Report (as accurately as possible from the graph) the interquartile range for each group:
JFK:
JFKC:
c. Do the boxplots provide any evidence that students who received the letters in convenient three-letter groupings were able to memorize more letters than the other group? Explain briefly.
Question
Question
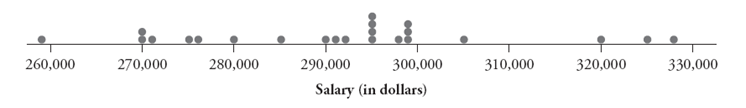
The following dotplot displays the salaries of the 23 presidents of California State University campuses for the 2007\_08 academic year:
 These salaries, arranged in order, are listed here:
a. Determine the five-number summary of these salaries. Consider the following computer output:
b. The salary for Cal Poly's President Baker is . Calculate the -score for his salary, and decide whether his salary is more than two standard deviations above the mean.
c. Check whether President Baker's salary is an outlier, according to the 1.5 _ IQR rule.
These salaries, arranged in order, are listed here:a. Determine the five-number summary of these salaries. Consider the following computer output:
b. The salary for Cal Poly's President Baker is . Calculate the -score for his salary, and decide whether his salary is more than two standard deviations above the mean.
c. Check whether President Baker's salary is an outlier, according to the 1.5 _ IQR rule.
Question
The 2001_2002 National Health and Nutrition Examination Survey asked people over the age of 60 how many close friends they had. The answers for the 1840 respondents appear in the following table. (For example, 82 people answered that they have 0 close friends, and 13 people answered that they have 50 close friends, and nobody answered that they have 18 close friends.)
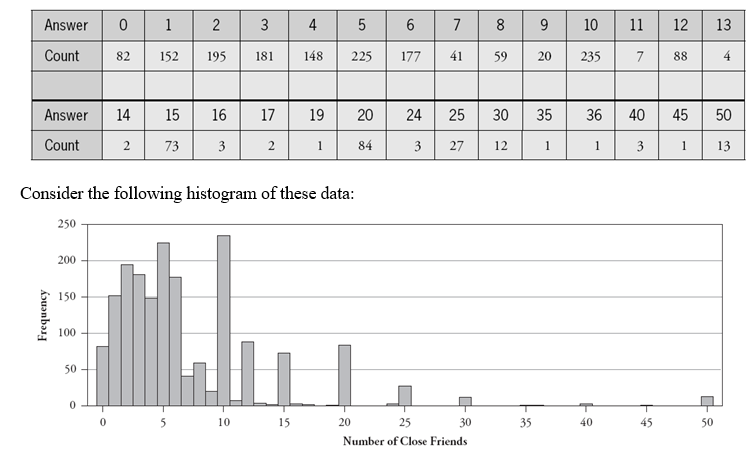
a. Write a paragraph describing key features of this distribution.
b. Determine the median of these data.
c. Would you expect the mean to be greater than the median, less than the median, or about the same as the median? Explain briefly without calculating the mean.
a. Write a paragraph describing key features of this distribution.
b. Determine the median of these data.
c. Would you expect the mean to be greater than the median, less than the median, or about the same as the median? Explain briefly without calculating the mean.
Question
Question
Question
In a recent study, researchers purchased 40 food items in New York City and determined the actual calorie content of each through a laboratory analysis. They then calculated the percentage difference between the actual calorie content and the calorie count listed on the item's label. (A positive percentage difference corresponds to a food item whose actual calorie content was higher than what the label claimed.) Each food item was also classified according to whether it was marketed locally, nationally, or regionally. The boxplots below were constructed to compare the distributions: 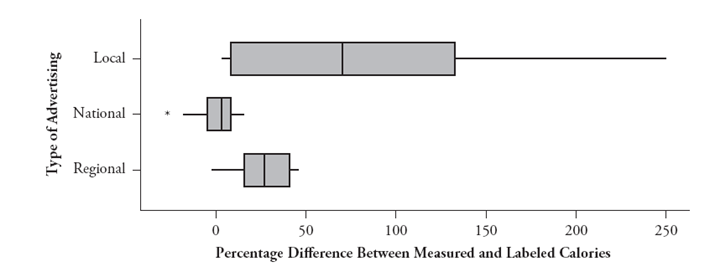
Write a paragraph summarizing what these boxplots reveal about the percentage differences between measured and labeled calorie content among the three groups of food items.
Write a paragraph summarizing what these boxplots reveal about the percentage differences between measured and labeled calorie content among the three groups of food items.
Question
Question
The following histogram displays the life expectancies (in years), as reported by The World Almanac and Book of Facts 2006, for a sample of 22 countries: 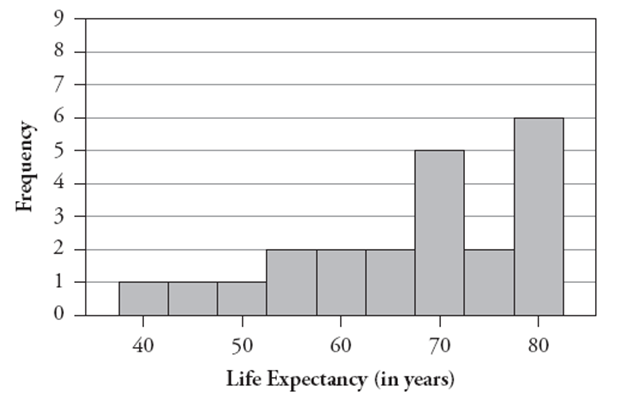
a. Describe (in five words or less) the shape of this distribution.
b. Two measures of center for this distribution are 67.0 and 70.7. One of these is the mean and the other is the median. Which is which? Explain your choice.
Now consider a histogram of the numbers of televisions per thousand people in these countries: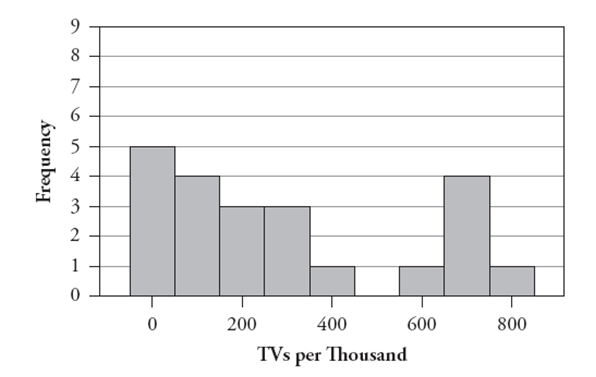 c. Write a paragraph describing key features of this distribution.
a. Describe (in five words or less) the shape of this distribution.
b. Two measures of center for this distribution are 67.0 and 70.7. One of these is the mean and the other is the median. Which is which? Explain your choice.
Now consider a histogram of the numbers of televisions per thousand people in these countries:
c. Write a paragraph describing key features of this distribution. Question
Question
Suppose a company that has recently fired many of its employees produces the following data on the gender (male/female) and job type (managerial/clerical) of the employees.
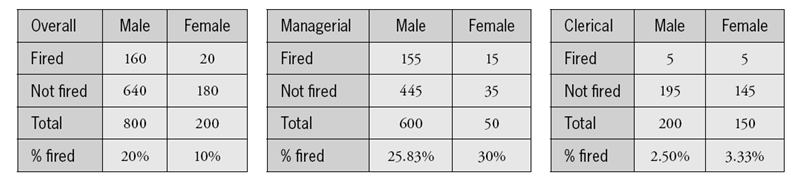 a. Show that Simpson's paradox holds for these data. (Point out the relevant percentages and the relevant inequalities, i.e., which percentages are greater than which others.)
b. Write a sentence or two explaining, as if to an educated person with no knowledge of statistics, why the paradox happens in this context.
a. Show that Simpson's paradox holds for these data. (Point out the relevant percentages and the relevant inequalities, i.e., which percentages are greater than which others.)b. Write a sentence or two explaining, as if to an educated person with no knowledge of statistics, why the paradox happens in this context.
Question
The following data are the speaking rates (in words per minute) of presidential candidates during televised debates in late September and early October of 2007:
Republicans:
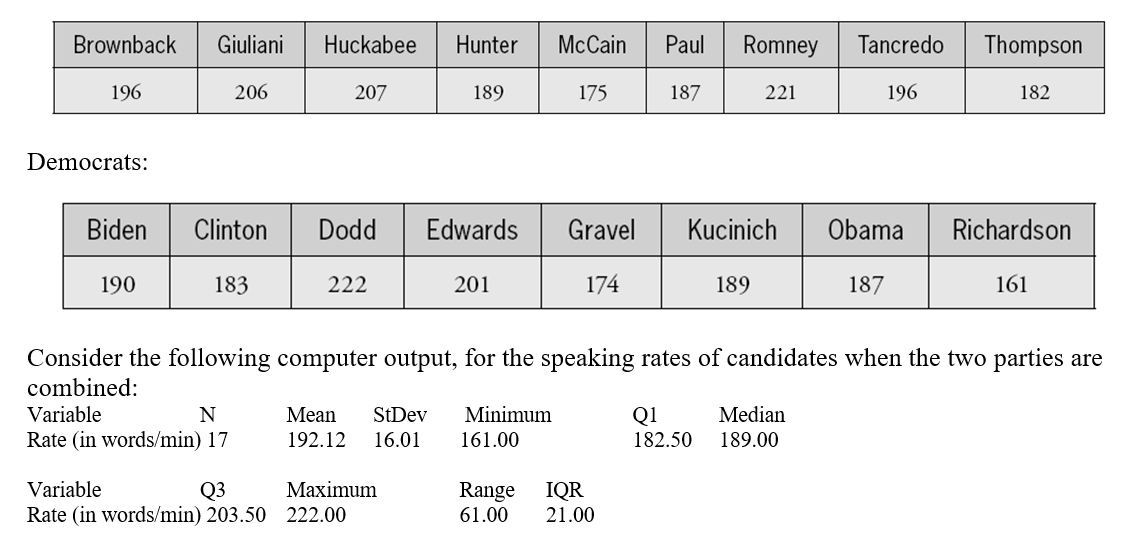
a. Use this output to determine whether there are any outliers in the data (again with the two parties combined).
The following boxplots display the speaking rates: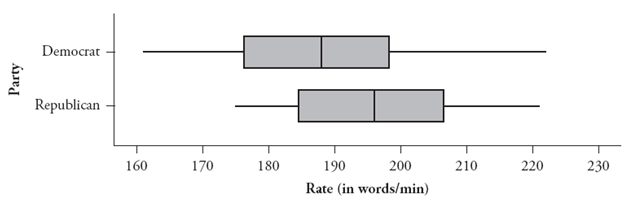 b. Report the median speaking rate for each party as accurately as you can from the graph.
c. Report the interquartile range of the speaking rates for each party as accurately as you can from the graph.
d. Summarize what these boxplots reveal about the speaking rates of the two parties' presidential candidates.
Republicans:
a. Use this output to determine whether there are any outliers in the data (again with the two parties combined).
The following boxplots display the speaking rates:
b. Report the median speaking rate for each party as accurately as you can from the graph.c. Report the interquartile range of the speaking rates for each party as accurately as you can from the graph.
d. Summarize what these boxplots reveal about the speaking rates of the two parties' presidential candidates.
Question

Unlock Deck
Sign up to unlock the cards in this deck!
Unlock Deck
Unlock Deck
1/55
Play
Full screen (f)
Deck 2: Summarizing Data
1
In a study reported in the July 2007 issue of the Journal of Epidemiology and Community Health, researchers investigated whether veterans are more likely to commit suicide than nonveterans. They spent 12 years following 104,000 veterans who had served in the armed forces between 1917 and 1994, and compared them with 216,000 nonveterans. They found that 197 veterans and 311 nonveterans committed suicide.
-Identify the explanatory and response variables in this study.
-Identify the explanatory and response variables in this study.
The explanatory variable is whether a subject is a veteran or a nonveteran (a binary categorical variable). The response variable is whether the subject committed suicide (also a binary categorical variable).
2
In a study reported in the July 2007 issue of the Journal of Epidemiology and Community Health, researchers investigated whether veterans are more likely to commit suicide than nonveterans. They spent 12 years following 104,000 veterans who had served in the armed forces between 1917 and 1994, and compared them with 216,000 nonveterans. They found that 197 veterans and 311 nonveterans committed suicide.
-Is this an experiment or an observational study? Explain briefly.
-Is this an experiment or an observational study? Explain briefly.
This is an observational study because the researchers did not determine who would/would not be a veteran.
3
In a study reported in the July 2007 issue of the Journal of Epidemiology and Community Health, researchers investigated whether veterans are more likely to commit suicide than nonveterans. They spent 12 years following 104,000 veterans who had served in the armed forces between 1917 and 1994, and compared them with 216,000 nonveterans. They found that 197 veterans and 311 nonveterans committed suicide.
-Notice that more nonveterans than veterans committed suicide (311 vs. 197). Would you conclude that veterans are less likely to commit suicide than nonveterans? Explain.
-Notice that more nonveterans than veterans committed suicide (311 vs. 197). Would you conclude that veterans are less likely to commit suicide than nonveterans? Explain.
No, you cannot conclude from this information that veterans are less likely to commit suicide than nonveterans. Because the sample sizes differed, you need to consider the suicide rates, not simply the counts. The suicide rate for veterans is or .001894 , whereas the suicide rate for nonveterans is or .00144 .
4
In a study reported in the July 2007 issue of the Journal of Epidemiology and Community Health, researchers investigated whether veterans are more likely to commit suicide than nonveterans. They spent 12 years following 104,000 veterans who had served in the armed forces between 1917 and 1994, and compared them with 216,000 nonveterans. They found that 197 veterans and 311 nonveterans committed suicide.
-Calculate the relative risk of committing suicide, comparing veterans to nonveterans.
-Calculate the relative risk of committing suicide, comparing veterans to nonveterans.
Unlock Deck
Unlock for access to all 55 flashcards in this deck.
Unlock Deck
k this deck
5
In a study reported in the July 2007 issue of the Journal of Epidemiology and Community Health, researchers investigated whether veterans are more likely to commit suicide than nonveterans. They spent 12 years following 104,000 veterans who had served in the armed forces between 1917 and 1994, and compared them with 216,000 nonveterans. They found that 197 veterans and 311 nonveterans committed suicide.
-Describe and justify the conclusion that you would draw from this study.
-Describe and justify the conclusion that you would draw from this study.
Unlock Deck
Unlock for access to all 55 flashcards in this deck.
Unlock Deck
k this deck
6
Is it better to praise a child's intelligence or effort? In a study reported in a 1998 issue of the Journal of Personality and Social Psychology, researchers investigated this question by randomly assigning fifthgraders into three groups. One group received praise for their intelligence after working on a set of problems; another group received praise for their effort; and a third (control) group received general praise that did not mention a specific attribute. Each child was then asked to write a description of the problems for a child in another state, including how many he or she solved correctly. One response variable was whether the child lied about how many problems he/she had solved correctly. The data are organized in the following table:
-Analyze these data to investigate whether they suggest any relationship between the type of praise given to a child and the child's propensity for lying about performance. Write a paragraph describing your findings, and support your findings with a graphical display and calculations.
-Analyze these data to investigate whether they suggest any relationship between the type of praise given to a child and the child's propensity for lying about performance. Write a paragraph describing your findings, and support your findings with a graphical display and calculations.
Unlock Deck
Unlock for access to all 55 flashcards in this deck.
Unlock Deck
k this deck
7
The following side-by-side stemplot displays the total number of points scored per Super Bowl football game for the first 41 Super Bowls (from 1967-2007), separated according to the first 20 games (19671986) and the next 21 games (1987-2007):
-Does this stemplot enable you to determine how many points were scored in the first Super Bowl? If so, what is this number?
-Does this stemplot enable you to determine how many points were scored in the first Super Bowl? If so, what is this number?
Unlock Deck
Unlock for access to all 55 flashcards in this deck.
Unlock Deck
k this deck
8
The following side-by-side stemplot displays the total number of points scored per Super Bowl football game for the first 41 Super Bowls (from 1967-2007), separated according to the first 20 games (19671986) and the next 21 games (1987-2007):
-Does this stemplot enable you to determine how many of the first 41 Super Bowls had a total of 37 points? If so, what is this number?
-Does this stemplot enable you to determine how many of the first 41 Super Bowls had a total of 37 points? If so, what is this number?
Unlock Deck
Unlock for access to all 55 flashcards in this deck.
Unlock Deck
k this deck
9
The following side-by-side stemplot displays the total number of points scored per Super Bowl football game for the first 41 Super Bowls (from 1967-2007), separated according to the first 20 games (19671986) and the next 21 games (1987-2007):
-Does this stemplot provide evidence that Super Bowl games have become more high-scoring over time, more low-scoring over time, or neither? Explain.
-Does this stemplot provide evidence that Super Bowl games have become more high-scoring over time, more low-scoring over time, or neither? Explain.
Unlock Deck
Unlock for access to all 55 flashcards in this deck.
Unlock Deck
k this deck
10
The following side-by-side stemplot displays the total number of points scored per Super Bowl football game for the first 41 Super Bowls (from 1967-2007), separated according to the first 20 games (19671986) and the next 21 games (1987-2007):
-The five lowest-scoring Super Bowls were all played among the first 20 games.
-The five lowest-scoring Super Bowls were all played among the first 20 games.
Unlock Deck
Unlock for access to all 55 flashcards in this deck.
Unlock Deck
k this deck
11
The following side-by-side stemplot displays the total number of points scored per Super Bowl football game for the first 41 Super Bowls (from 1967-2007), separated according to the first 20 games (19671986) and the next 21 games (1987-2007):
-The five highest-scoring Super Bowls were all played among the next 21 games.
-The five highest-scoring Super Bowls were all played among the next 21 games.
Unlock Deck
Unlock for access to all 55 flashcards in this deck.
Unlock Deck
k this deck
12
The following histogram displays the magnitudes of the 614 earthquakes with Richter scale magnitude greater than 1.0 that occurred in the United States between March 25 and April 1, 2004:
-Describe the shape of this distribution.
-Describe the shape of this distribution.
Unlock Deck
Unlock for access to all 55 flashcards in this deck.
Unlock Deck
k this deck
13
The following histogram displays the magnitudes of the 614 earthquakes with Richter scale magnitude greater than 1.0 that occurred in the United States between March 25 and April 1, 2004:
-Is the percentage of earthquakes of magnitude 3.0 or higher closest to , or ?
The following histograms display student responses to several questions on a course survey taken during the first day of a statistics class.
-Is the percentage of earthquakes of magnitude 3.0 or higher closest to , or ?
The following histograms display student responses to several questions on a course survey taken during the first day of a statistics class.
Unlock Deck
Unlock for access to all 55 flashcards in this deck.
Unlock Deck
k this deck
14
The following histogram displays the magnitudes of the 614 earthquakes with Richter scale magnitude greater than 1.0 that occurred in the United States between March 25 and April 1, 2004:
-Which histogram do you think displays the variable number of siblings? Justify your answer.
-Which histogram do you think displays the variable number of siblings? Justify your answer.
Unlock Deck
Unlock for access to all 55 flashcards in this deck.
Unlock Deck
k this deck
15
The following histogram displays the magnitudes of the 614 earthquakes with Richter scale magnitude greater than 1.0 that occurred in the United States between March 25 and April 1, 2004:
-Which histogram do you think displays the variable price paid for most recent haircut? Justify your answer.
-Which histogram do you think displays the variable price paid for most recent haircut? Justify your answer.
Unlock Deck
Unlock for access to all 55 flashcards in this deck.
Unlock Deck
k this deck
16
The following histogram displays the magnitudes of the 614 earthquakes with Richter scale magnitude greater than 1.0 that occurred in the United States between March 25 and April 1, 2004:
-Which histogram do you think displays the variable height? Justify your answer.
-Which histogram do you think displays the variable height? Justify your answer.
Unlock Deck
Unlock for access to all 55 flashcards in this deck.
Unlock Deck
k this deck
17
The following table reports counts of the number of "close friends" reported by a sample of men and a sample of women:
-Is number of close friends a quantitative or categorical variable?
-Is number of close friends a quantitative or categorical variable?
Unlock Deck
Unlock for access to all 55 flashcards in this deck.
Unlock Deck
k this deck
18
The following table reports counts of the number of "close friends" reported by a sample of men and a sample of women:
-Are these distributions roughly symmetric, skewed to the left, or skewed to the right? Explain briefly. (You do not need to construct any graphs.)
-Are these distributions roughly symmetric, skewed to the left, or skewed to the right? Explain briefly. (You do not need to construct any graphs.)
Unlock Deck
Unlock for access to all 55 flashcards in this deck.
Unlock Deck
k this deck
19
The following table reports counts of the number of "close friends" reported by a sample of men and a sample of women:
-Calculate the median number of close friends for each gender.
-Calculate the median number of close friends for each gender.
Unlock Deck
Unlock for access to all 55 flashcards in this deck.
Unlock Deck
k this deck
20
The following table reports counts of the number of "close friends" reported by a sample of men and a sample of women:
-Based on the shape of the distributions, do you expect the means to be greater than the medians, less than the medians, or very close to the medians? (Do not calculate either mean.)
-Based on the shape of the distributions, do you expect the means to be greater than the medians, less than the medians, or very close to the medians? (Do not calculate either mean.)
Unlock Deck
Unlock for access to all 55 flashcards in this deck.
Unlock Deck
k this deck
21
The following table reports counts of the number of "close friends" reported by a sample of men and a sample of women:
-For each gender, calculate the proportion who say that they have no close friends. Comment on how these proportions compare between men and women.
-For each gender, calculate the proportion who say that they have no close friends. Comment on how these proportions compare between men and women.
Unlock Deck
Unlock for access to all 55 flashcards in this deck.
Unlock Deck
k this deck
22
Create an example of five hypothetical exam scores (between 0 and 100 , with repeats allowed) with the property that of the scores are less than the mean.
Unlock Deck
Unlock for access to all 55 flashcards in this deck.
Unlock Deck
k this deck
23
Create an example of five hypothetical exam scores (between 0 and 100 , with repeats allowed) with the property that the mean is greater than three times the median.
Unlock Deck
Unlock for access to all 55 flashcards in this deck.
Unlock Deck
k this deck
24
What effect does adding 10 points to every exam score in a class have upon the mean score? In other words, how would the new mean compare to the old mean?
Be as specific as possible.
Be as specific as possible.
Unlock Deck
Unlock for access to all 55 flashcards in this deck.
Unlock Deck
k this deck
25
Is it possible for the mean value of a variable to be greater than all of the data values? Explain.
Unlock Deck
Unlock for access to all 55 flashcards in this deck.
Unlock Deck
k this deck
26
A trimmed mean is another measure of center. For example, one trimmed mean deletes the highest of the values and the lowest of the values, and then takes the mean of the remaining of the values. Is this trimmed mean more or less resistant to outliers than the mean? Explain briefly.
Unlock Deck
Unlock for access to all 55 flashcards in this deck.
Unlock Deck
k this deck
27
Create an example of five hypothetical exam scores (between 0 and 100, inclusive, with repeats allowed) with the property that the standard deviation is as small as possible.
Unlock Deck
Unlock for access to all 55 flashcards in this deck.
Unlock Deck
k this deck
28
What effect does adding ten points to every exam score in a class have on the interquartile range of the scores? Be specific and explain briefly.
Unlock Deck
Unlock for access to all 55 flashcards in this deck.
Unlock Deck
k this deck
29
What effect does adding ten points to every exam score in a class have on the standard deviation of the scores? Be specific and explain briefly.
Unlock Deck
Unlock for access to all 55 flashcards in this deck.
Unlock Deck
k this deck
30
Is the mean absolute deviation more or less resistant to outliers than the standard deviation? Explain briefly.
Unlock Deck
Unlock for access to all 55 flashcards in this deck.
Unlock Deck
k this deck
31
Would a manufacturer of candy bars want to have a larger standard deviation of the weights of candy bars coming off the assembly line or a small standard deviation of those weights? Explain briefly.
Unlock Deck
Unlock for access to all 55 flashcards in this deck.
Unlock Deck
k this deck
32
The following histograms display the distributions of percentage of a state's residents who are Mexican, for each region of the country (West, South, Northeast, Midwest).
-Which region do you suspect has the smallest standard deviation in these percentages? Explain.
-Which region do you suspect has the smallest standard deviation in these percentages? Explain.
Unlock Deck
Unlock for access to all 55 flashcards in this deck.
Unlock Deck
k this deck
33
The following histograms display the distributions of percentage of a state's residents who are Mexican, for each region of the country (West, South, Northeast, Midwest).
-Which region do you suspect has the largest standard deviation in percentages? Explain.
-Which region do you suspect has the largest standard deviation in percentages? Explain.
Unlock Deck
Unlock for access to all 55 flashcards in this deck.
Unlock Deck
k this deck
34
The following histograms display the distributions of percentage of a state's residents who are Mexican, for each region of the country (West, South, Northeast, Midwest).
-For the south region, would you recommend reporting the standard deviation or the interquartile range as your measure of the spread of the distribution? Explain.
-For the south region, would you recommend reporting the standard deviation or the interquartile range as your measure of the spread of the distribution? Explain.
Unlock Deck
Unlock for access to all 55 flashcards in this deck.
Unlock Deck
k this deck
35
The following histograms display the distributions of percentage of a state's residents who are Mexican, for each region of the country (West, South, Northeast, Midwest).
-Which of the following sets of five numbers has the smallest standard deviation? Explain your reasoning, but do not do any calculations.
(a)
(b)
(c)
-Which of the following sets of five numbers has the smallest standard deviation? Explain your reasoning, but do not do any calculations.
(a)
(b)
(c)
Unlock Deck
Unlock for access to all 55 flashcards in this deck.
Unlock Deck
k this deck
36
The following histograms display the distributions of percentage of a state's residents who are Mexican, for each region of the country (West, South, Northeast, Midwest).
-Which of these three sets of numbers (above) has the largest standard deviation? Explain your reasoning, but do not do any calculations.
-Which of these three sets of numbers (above) has the largest standard deviation? Explain your reasoning, but do not do any calculations.
Unlock Deck
Unlock for access to all 55 flashcards in this deck.
Unlock Deck
k this deck
37
The following data are monthly rents (in dollars) of studio and one-bedroom apartments in Harrisburg and Philadelphia, Pennsylvania.
Harrisburg
Philadelphia
-For each city, determine and report the five-number summary of these monthly rents.
Harrisburg
Philadelphia
-For each city, determine and report the five-number summary of these monthly rents.
Unlock Deck
Unlock for access to all 55 flashcards in this deck.
Unlock Deck
k this deck
38
The following data are monthly rents (in dollars) of studio and one-bedroom apartments in Harrisburg and Philadelphia, Pennsylvania.
Harrisburg
Philadelphia
-Construct boxplots of the distributions of rent amounts in these two cities, using the same axis and scale. (Do not bother to check for outliers; there are no outliers in either distribution.)
Harrisburg
Philadelphia
-Construct boxplots of the distributions of rent amounts in these two cities, using the same axis and scale. (Do not bother to check for outliers; there are no outliers in either distribution.)
Unlock Deck
Unlock for access to all 55 flashcards in this deck.
Unlock Deck
k this deck
39
The following data are monthly rents (in dollars) of studio and one-bedroom apartments in Harrisburg and Philadelphia, Pennsylvania.
Harrisburg
Philadelphia
-Compare and contrast the distributions of monthly apartment rents in these two cities. Refer to appropriate calculations and displays to support your comments.
Harrisburg
Philadelphia
-Compare and contrast the distributions of monthly apartment rents in these two cities. Refer to appropriate calculations and displays to support your comments.
Unlock Deck
Unlock for access to all 55 flashcards in this deck.
Unlock Deck
k this deck
40
The following side-by-side stemplot displays the total number of points scored per Super Bowl football game for the first 41 Super Bowls (from 1967-2007), separated according to the first 20 games (19671986) and the next 21 games (1987-2007):
-For each group, determine the five-number summary of these total points.
-For each group, determine the five-number summary of these total points.
Unlock Deck
Unlock for access to all 55 flashcards in this deck.
Unlock Deck
k this deck
41
The following side-by-side stemplot displays the total number of points scored per Super Bowl football game for the first 41 Super Bowls (from 1967-2007), separated according to the first 20 games (19671986) and the next 21 games (1987-2007):
-Construct boxplots of the distributions of total points in these two groups, using the same axes and scale. (Do not bother to check for outliers; there are no outliers in either distribution.)
-Construct boxplots of the distributions of total points in these two groups, using the same axes and scale. (Do not bother to check for outliers; there are no outliers in either distribution.)
Unlock Deck
Unlock for access to all 55 flashcards in this deck.
Unlock Deck
k this deck
42
The following side-by-side stemplot displays the total number of points scored per Super Bowl football game for the first 41 Super Bowls (from 1967-2007), separated according to the first 20 games (19671986) and the next 21 games (1987-2007):
-Compare and contrast the distributions of total points between these two groups. Refer to appropriate calculations and displays to support your comments.
-Compare and contrast the distributions of total points between these two groups. Refer to appropriate calculations and displays to support your comments.
Unlock Deck
Unlock for access to all 55 flashcards in this deck.
Unlock Deck
k this deck
43
An instructor conducted an in-class experiment where students memorized as many letters as possible from a strip of paper. Everyone received the same letters in the same order, but some students saw the letters in convenient three-letter groupings (such as JFK-CIA) whereas others saw less convenient groupings (such as JFKCIAF). Boxplots of the number of letters memorized correctly appear below:
a. Report (as accurately as possible from the graph) the median score for each group:
JFK:
JFKC:
b. Report (as accurately as possible from the graph) the interquartile range for each group:
JFK:
JFKC:
c. Do the boxplots provide any evidence that students who received the letters in convenient three-letter groupings were able to memorize more letters than the other group? Explain briefly.
a. Report (as accurately as possible from the graph) the median score for each group:JFK:
JFKC:
b. Report (as accurately as possible from the graph) the interquartile range for each group:
JFK:
JFKC:
c. Do the boxplots provide any evidence that students who received the letters in convenient three-letter groupings were able to memorize more letters than the other group? Explain briefly.
Unlock Deck
Unlock for access to all 55 flashcards in this deck.
Unlock Deck
k this deck
44
In a recent study, researchers followed 104,000 U.S. veterans who had served in the armed forces and a comparison group of 216,000 nonveterans. Over a period of 12 years, they found that 197 veterans and 311 nonveterans committed suicide.
a. Calculate the relative risk of suicide, comparing veterans to nonveterans.
b. Write a sentence interpreting this relative risk value.
c. A segmented bar graph would not provide much helpful information for these data. Explain why not. (Do not bother to produce this graph.)
a. Calculate the relative risk of suicide, comparing veterans to nonveterans.
b. Write a sentence interpreting this relative risk value.
c. A segmented bar graph would not provide much helpful information for these data. Explain why not. (Do not bother to produce this graph.)
Unlock Deck
Unlock for access to all 55 flashcards in this deck.
Unlock Deck
k this deck
45
The following dotplot displays the salaries of the 23 presidents of California State University campuses for the 2007\_08 academic year:
These salaries, arranged in order, are listed here:
a. Determine the five-number summary of these salaries. Consider the following computer output:
b. The salary for Cal Poly's President Baker is . Calculate the -score for his salary, and decide whether his salary is more than two standard deviations above the mean.
c. Check whether President Baker's salary is an outlier, according to the 1.5 _ IQR rule.
These salaries, arranged in order, are listed here:a. Determine the five-number summary of these salaries. Consider the following computer output:
b. The salary for Cal Poly's President Baker is . Calculate the -score for his salary, and decide whether his salary is more than two standard deviations above the mean.
c. Check whether President Baker's salary is an outlier, according to the 1.5 _ IQR rule.
Unlock Deck
Unlock for access to all 55 flashcards in this deck.
Unlock Deck
k this deck
46
The 2001_2002 National Health and Nutrition Examination Survey asked people over the age of 60 how many close friends they had. The answers for the 1840 respondents appear in the following table. (For example, 82 people answered that they have 0 close friends, and 13 people answered that they have 50 close friends, and nobody answered that they have 18 close friends.)
a. Write a paragraph describing key features of this distribution.
b. Determine the median of these data.
c. Would you expect the mean to be greater than the median, less than the median, or about the same as the median? Explain briefly without calculating the mean.
a. Write a paragraph describing key features of this distribution.
b. Determine the median of these data.
c. Would you expect the mean to be greater than the median, less than the median, or about the same as the median? Explain briefly without calculating the mean.
Unlock Deck
Unlock for access to all 55 flashcards in this deck.
Unlock Deck
k this deck
47
Suppose Mary records the ages of people entering a McDonald's restaurant in a suburban shopping plaza tomorrow, while Abby records the ages of people entering a popular food court on a nearby college campus. Who would you expect to have the higher standard deviation of these ages: Mary (suburban McDonald's) or Abby (campus food court)? Explain briefly.
Unlock Deck
Unlock for access to all 55 flashcards in this deck.
Unlock Deck
k this deck
48
Construct a hypothetical example of ten exam scores (between 0 and 100 , inclusive, possibly including repeats) so that the interquartile range equals zero and the mean is greater than the median. (Both of these properties should hold for the example that you create.) Also report the values of the mean, median, and IQR for your example. (If you are unable to create an example for which both properties hold, then for partial credit try to create an example in which one of the properties holds.)
Unlock Deck
Unlock for access to all 55 flashcards in this deck.
Unlock Deck
k this deck
49
In a recent study, researchers purchased 40 food items in New York City and determined the actual calorie content of each through a laboratory analysis. They then calculated the percentage difference between the actual calorie content and the calorie count listed on the item's label. (A positive percentage difference corresponds to a food item whose actual calorie content was higher than what the label claimed.) Each food item was also classified according to whether it was marketed locally, nationally, or regionally. The boxplots below were constructed to compare the distributions:
Write a paragraph summarizing what these boxplots reveal about the percentage differences between measured and labeled calorie content among the three groups of food items.
Write a paragraph summarizing what these boxplots reveal about the percentage differences between measured and labeled calorie content among the three groups of food items.
Unlock Deck
Unlock for access to all 55 flashcards in this deck.
Unlock Deck
k this deck
50
Suppose Ben records the noon temperature in New York City on every day in the month of June, and Frank records the noon temperature in New York City on every day in an entire year. Which one (Ben or Frank) would you expect to have the greater standard deviation of temperatures, or would you expect the standard deviations to be very similar? Explain briefly.
Unlock Deck
Unlock for access to all 55 flashcards in this deck.
Unlock Deck
k this deck
51
The following histogram displays the life expectancies (in years), as reported by The World Almanac and Book of Facts 2006, for a sample of 22 countries:
a. Describe (in five words or less) the shape of this distribution.
b. Two measures of center for this distribution are 67.0 and 70.7. One of these is the mean and the other is the median. Which is which? Explain your choice.
Now consider a histogram of the numbers of televisions per thousand people in these countries: c. Write a paragraph describing key features of this distribution.
a. Describe (in five words or less) the shape of this distribution.
b. Two measures of center for this distribution are 67.0 and 70.7. One of these is the mean and the other is the median. Which is which? Explain your choice.
Now consider a histogram of the numbers of televisions per thousand people in these countries:
c. Write a paragraph describing key features of this distribution. Unlock Deck
Unlock for access to all 55 flashcards in this deck.
Unlock Deck
k this deck
52
a. Construct a hypothetical example of ten exam scores (between 0 and 100 , inclusive, possibly including repeats) so that the mean is greater than two times the median. Also report the values of the mean and median for your example.
b. Construct another (or different) hypothetical example of ten exam scores (between 0 and 100, inclusive, possibly including repeats) so that the interquartile range equals 50. Also report the values of the quartiles for your example.
b. Construct another (or different) hypothetical example of ten exam scores (between 0 and 100, inclusive, possibly including repeats) so that the interquartile range equals 50. Also report the values of the quartiles for your example.
Unlock Deck
Unlock for access to all 55 flashcards in this deck.
Unlock Deck
k this deck
53
Suppose a company that has recently fired many of its employees produces the following data on the gender (male/female) and job type (managerial/clerical) of the employees.
a. Show that Simpson's paradox holds for these data. (Point out the relevant percentages and the relevant inequalities, i.e., which percentages are greater than which others.)
b. Write a sentence or two explaining, as if to an educated person with no knowledge of statistics, why the paradox happens in this context.
a. Show that Simpson's paradox holds for these data. (Point out the relevant percentages and the relevant inequalities, i.e., which percentages are greater than which others.)b. Write a sentence or two explaining, as if to an educated person with no knowledge of statistics, why the paradox happens in this context.
Unlock Deck
Unlock for access to all 55 flashcards in this deck.
Unlock Deck
k this deck
54
The following data are the speaking rates (in words per minute) of presidential candidates during televised debates in late September and early October of 2007:
Republicans:
a. Use this output to determine whether there are any outliers in the data (again with the two parties combined).
The following boxplots display the speaking rates: b. Report the median speaking rate for each party as accurately as you can from the graph.
c. Report the interquartile range of the speaking rates for each party as accurately as you can from the graph.
d. Summarize what these boxplots reveal about the speaking rates of the two parties' presidential candidates.
Republicans:
a. Use this output to determine whether there are any outliers in the data (again with the two parties combined).
The following boxplots display the speaking rates:
b. Report the median speaking rate for each party as accurately as you can from the graph.c. Report the interquartile range of the speaking rates for each party as accurately as you can from the graph.
d. Summarize what these boxplots reveal about the speaking rates of the two parties' presidential candidates.
Unlock Deck
Unlock for access to all 55 flashcards in this deck.
Unlock Deck
k this deck
55
For each of the following, indicate whether it is resistant to outliers or not. Do not bother to explain your answers, except for the last one.
a. Mean
b. Median
c. Standard deviation
d. (Lower quartile + upper quartile)
e. Maximum + minimum
f. Mean absolute deviation (Explain your answer.)
a. Mean
b. Median
c. Standard deviation
d. (Lower quartile + upper quartile)
e. Maximum + minimum
f. Mean absolute deviation (Explain your answer.)
Unlock Deck
Unlock for access to all 55 flashcards in this deck.
Unlock Deck
k this deck
Unlock Deck
Unlock for access to all 55 flashcards in this deck.


