Deck 2: Summarizing Data: Listing and Grouping
Full screen (f)
Question
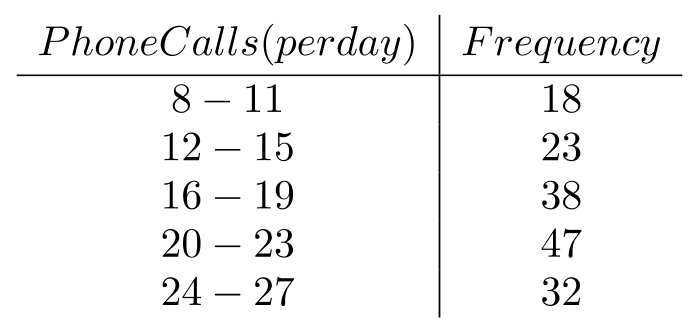
A sample of 18 tries to connect to an online service using a phone line.
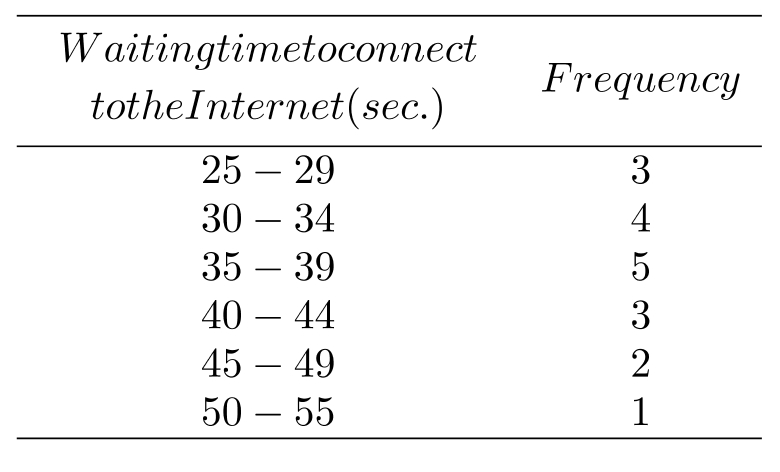
-The class boundaries of the second class are
A)
B)
C) 30-34.9
D) 29.9-34.9
-The class boundaries of the second class are
A)
B)
C) 30-34.9
D) 29.9-34.9
Question
A sample of 18 tries to connect to an online service using a phone line.
-The numbers 40 and 44 are examples of
A) class marks.
B) class boundaries.
C) class limits.
D) class intervals.
-The numbers 40 and 44 are examples of
A) class marks.
B) class boundaries.
C) class limits.
D) class intervals.
Question
A sample of 18 tries to connect to an online service using a phone line.
-The numbers 27 and 47 are examples of
A) class marks.
B) class boundaries.
C) class limits.
D) class intervals.
-The numbers 27 and 47 are examples of
A) class marks.
B) class boundaries.
C) class limits.
D) class intervals.
Question
A sample of 18 tries to connect to an online service using a phone line.
-If a cumulative "less than" distribution were constructed from the above frequency distribution, the cumulative frequency in the third row down would be
A) 1 .
B) 9 .
C) 6 .
D) 7 .
-If a cumulative "less than" distribution were constructed from the above frequency distribution, the cumulative frequency in the third row down would be
A) 1 .
B) 9 .
C) 6 .
D) 7 .
Question
Question
Question
Question
Question
Question
Given the frequency distribution: 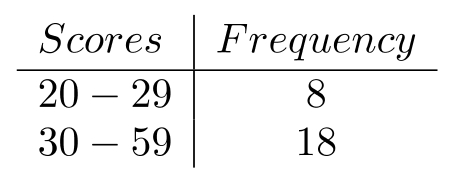 For the histogram of this distribution, the height of the 30-59 interval should be _______
A) 18
B) 9
C) 54
D) 6
For the histogram of this distribution, the height of the 30-59 interval should be _______A) 18
B) 9
C) 54
D) 6
Question
Table 1
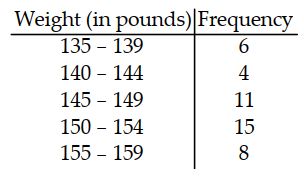
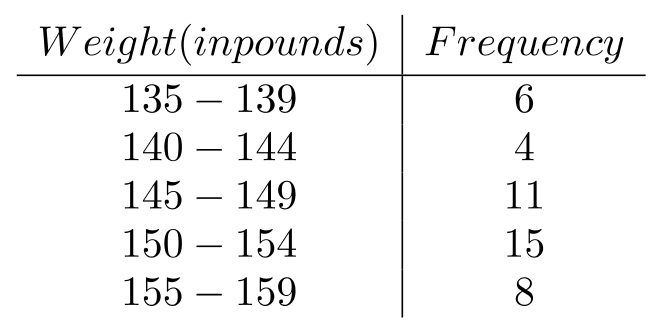
A sample of 80 company employees is grouped into a table based on their weekly salaries:
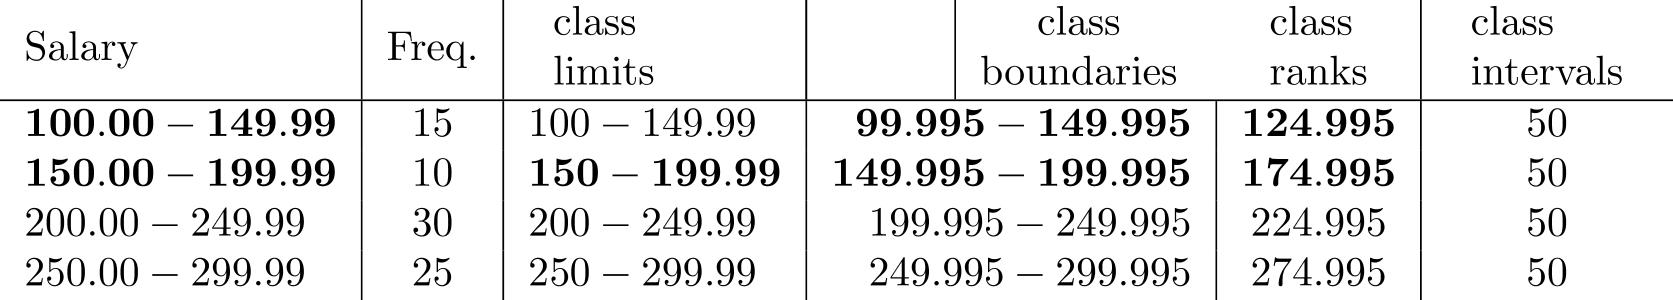
-From the data in Table 1, construct a percentage distribution.
A sample of 80 company employees is grouped into a table based on their weekly salaries:
-From the data in Table 1, construct a percentage distribution.
Question
Table 1
A sample of 80 company employees is grouped into a table based on their weekly salaries:
-From the data in Table 1, construct the cumulative "less than" distribution.
A sample of 80 company employees is grouped into a table based on their weekly salaries:
-From the data in Table 1, construct the cumulative "less than" distribution.
Question
Table 1
A sample of 80 company employees is grouped into a table based on their weekly salaries:
-From the data in Table 1, construct a cumulative "greater than" distribution.
A sample of 80 company employees is grouped into a table based on their weekly salaries:
-From the data in Table 1, construct a cumulative "greater than" distribution.
Question
Table 1
A sample of 80 company employees is grouped into a table based on their weekly salaries:
-From the data in Table 1, construct a cumulative "or less" distribution.
A sample of 80 company employees is grouped into a table based on their weekly salaries:
-From the data in Table 1, construct a cumulative "or less" distribution.
Question
Question
Question
Question
Question
Question
Question
Question
Question
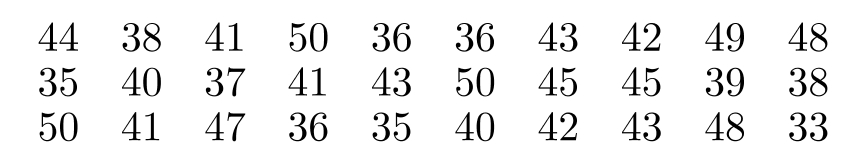
The Highway Patrol, using radar, checked the speeds (in ) of 30 passing motorists at a checkpoint. The results are listed below. Construct a dot diagram for the data.

Question
Question
Question
Question
A study was conducted to determine how people get jobs. Four hundred subjects were randomly selected and the results are listed below.
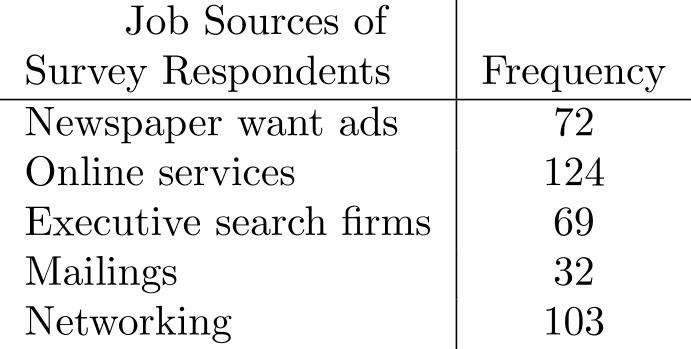 Construct a Pareto diagram in the form of a bar chart for the data. (Remember, in a Pareto diagram, the data is arranged in descending order.)
Construct a Pareto diagram in the form of a bar chart for the data. (Remember, in a Pareto diagram, the data is arranged in descending order.) Question
Question
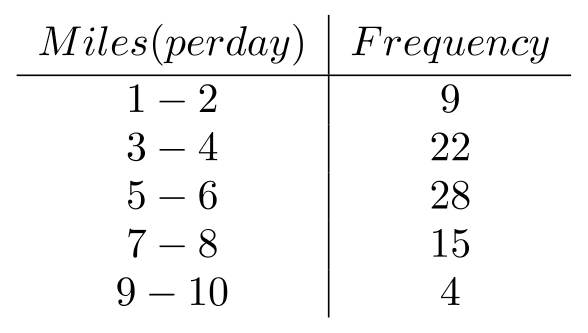
For the data below, construct a frequency histogram and a frequency polygon.
Question
For the data below, construct a frequency histogram and a frequency polygon.
Question
Question
Question
Question
For the data below, construct an ogive.
Question
For the data below, construct an ogive.

Question
For the data below, construct an ogive.
Question
For the data below, construct an ogive.
Question
A study was conducted to determine how people get jobs. Four hundred subjects were randomly selected and the results are listed below.
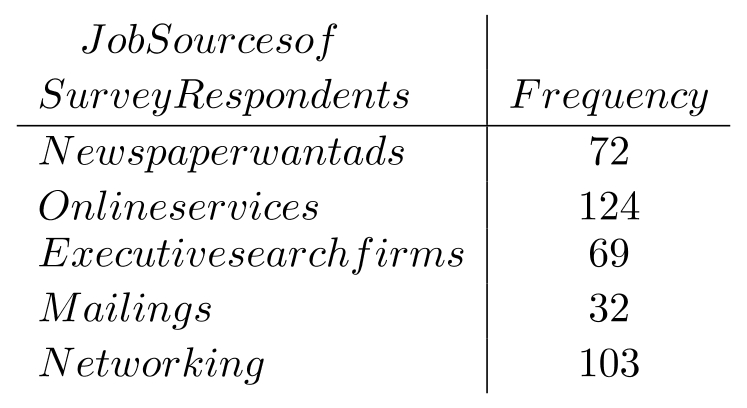 Construct a pie chart of the data.
Construct a pie chart of the data. Question
Question
Question
The Highway Patrol, using radar, checked the speeds (in mph) of 30 passing motorists at a checkpoint. The results are listed below. Construct an ogive using six classes.
Question
In a study of the growth of termite hills in the desert, an experiment was performed to determine how well the height of such hills can be determined from aerial photographs. Following are the heights of 36 termite hills (in centimeters) estimated from aerial photographs, , and measured on the ground, :
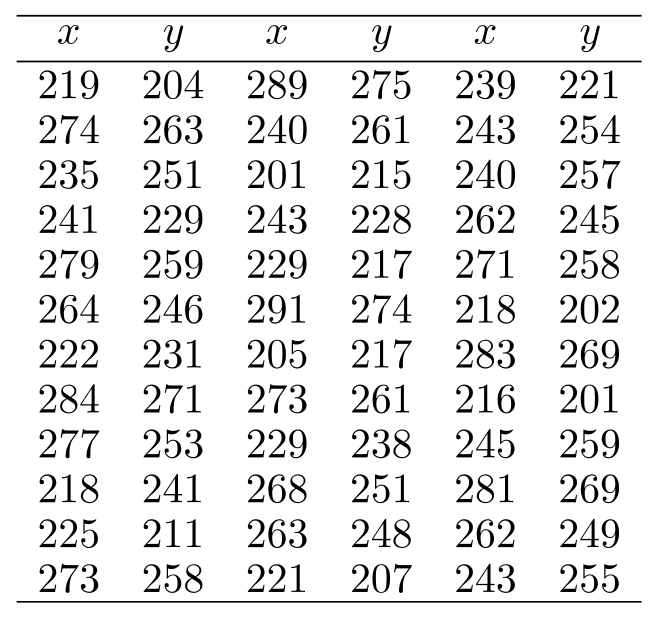 Produce a two-way frequency distribution with the classes 200-219, 220-239, 240-259, 260-279, and 280-299 for both variables.
Produce a two-way frequency distribution with the classes 200-219, 220-239, 240-259, 260-279, and 280-299 for both variables. Question
Following are the numbers of minutes it took 27 students to memorize two lists of German adjectives, one in the morning and one in the late afternoon.
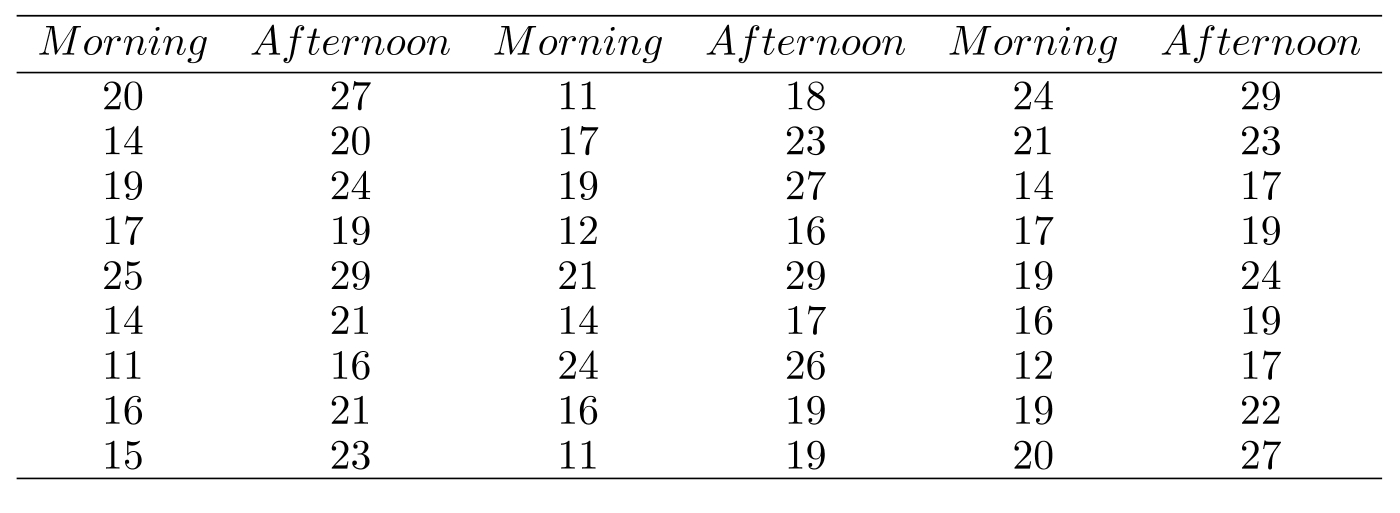 Produce a two-way frequency table for these data using the classes 10-14, 15-19, 20-24, and 25-29 for the morning, and the classes 15-19, 20-24, and 25-29 for the afternoon.
Produce a two-way frequency table for these data using the classes 10-14, 15-19, 20-24, and 25-29 for the morning, and the classes 15-19, 20-24, and 25-29 for the afternoon. Question
Question
Question
Question
Question
Question
Question
Question
Question
Question
Question
Question
Question
Question
Question
Question
Question
Question
Question
Question

Unlock Deck
Sign up to unlock the cards in this deck!
Unlock Deck
Unlock Deck
1/63
Play
Full screen (f)
Deck 2: Summarizing Data: Listing and Grouping
1
A sample of 18 tries to connect to an online service using a phone line.
-The class boundaries of the second class are
A)
B)
C) 30-34.9
D) 29.9-34.9
-The class boundaries of the second class are
A)
B)
C) 30-34.9
D) 29.9-34.9
2
A sample of 18 tries to connect to an online service using a phone line.
-The numbers 40 and 44 are examples of
A) class marks.
B) class boundaries.
C) class limits.
D) class intervals.
-The numbers 40 and 44 are examples of
A) class marks.
B) class boundaries.
C) class limits.
D) class intervals.
class limits.
3
A sample of 18 tries to connect to an online service using a phone line.
-The numbers 27 and 47 are examples of
A) class marks.
B) class boundaries.
C) class limits.
D) class intervals.
-The numbers 27 and 47 are examples of
A) class marks.
B) class boundaries.
C) class limits.
D) class intervals.
class marks.
4
A sample of 18 tries to connect to an online service using a phone line.
-If a cumulative "less than" distribution were constructed from the above frequency distribution, the cumulative frequency in the third row down would be
A) 1 .
B) 9 .
C) 6 .
D) 7 .
-If a cumulative "less than" distribution were constructed from the above frequency distribution, the cumulative frequency in the third row down would be
A) 1 .
B) 9 .
C) 6 .
D) 7 .
Unlock Deck
Unlock for access to all 63 flashcards in this deck.
Unlock Deck
k this deck
5
In a cumulative "less than" distribution, the classes are labeled using
A) class marks.
B) lower class limits.
C) upper class limits.
D) class boundaries.
A) class marks.
B) lower class limits.
C) upper class limits.
D) class boundaries.
Unlock Deck
Unlock for access to all 63 flashcards in this deck.
Unlock Deck
k this deck
6
In a cumulative "more than" distribution, the classes are labeled using
A) class marks.
B) lower class limits.
C) upper class limits.
D) class boundaries.
A) class marks.
B) lower class limits.
C) upper class limits.
D) class boundaries.
Unlock Deck
Unlock for access to all 63 flashcards in this deck.
Unlock Deck
k this deck
7
We can show the proportion of values falling into various class intervals by using a _______ distribution.
A) frequency
B) cumulative
C) quantitative
D) percentage
A) frequency
B) cumulative
C) quantitative
D) percentage
Unlock Deck
Unlock for access to all 63 flashcards in this deck.
Unlock Deck
k this deck
8
In order to present numerical categories of a variable with their corresponding frequencies, we use a _______ distribution.
A) cumulative
B) quantitative
C) qualitative
D) percentage
A) cumulative
B) quantitative
C) qualitative
D) percentage
Unlock Deck
Unlock for access to all 63 flashcards in this deck.
Unlock Deck
k this deck
9
Which of the following would be a desirable property of a frequency distribution?
A) contains open end classes
B) contains more than 15 classes
C) contains exactly 4 classes
D) contains equal class intervals
A) contains open end classes
B) contains more than 15 classes
C) contains exactly 4 classes
D) contains equal class intervals
Unlock Deck
Unlock for access to all 63 flashcards in this deck.
Unlock Deck
k this deck
10
Given the frequency distribution: For the histogram of this distribution, the height of the 30-59 interval should be _______
A) 18
B) 9
C) 54
D) 6
For the histogram of this distribution, the height of the 30-59 interval should be _______A) 18
B) 9
C) 54
D) 6
Unlock Deck
Unlock for access to all 63 flashcards in this deck.
Unlock Deck
k this deck
11
Table 1
A sample of 80 company employees is grouped into a table based on their weekly salaries:
-From the data in Table 1, construct a percentage distribution.
A sample of 80 company employees is grouped into a table based on their weekly salaries:
-From the data in Table 1, construct a percentage distribution.
Unlock Deck
Unlock for access to all 63 flashcards in this deck.
Unlock Deck
k this deck
12
Table 1
A sample of 80 company employees is grouped into a table based on their weekly salaries:
-From the data in Table 1, construct the cumulative "less than" distribution.
A sample of 80 company employees is grouped into a table based on their weekly salaries:
-From the data in Table 1, construct the cumulative "less than" distribution.
Unlock Deck
Unlock for access to all 63 flashcards in this deck.
Unlock Deck
k this deck
13
Table 1
A sample of 80 company employees is grouped into a table based on their weekly salaries:
-From the data in Table 1, construct a cumulative "greater than" distribution.
A sample of 80 company employees is grouped into a table based on their weekly salaries:
-From the data in Table 1, construct a cumulative "greater than" distribution.
Unlock Deck
Unlock for access to all 63 flashcards in this deck.
Unlock Deck
k this deck
14
Table 1
A sample of 80 company employees is grouped into a table based on their weekly salaries:
-From the data in Table 1, construct a cumulative "or less" distribution.
A sample of 80 company employees is grouped into a table based on their weekly salaries:
-From the data in Table 1, construct a cumulative "or less" distribution.
Unlock Deck
Unlock for access to all 63 flashcards in this deck.
Unlock Deck
k this deck
15
Solve the problem.
-Given the class marks 22, 30, 38, and 46, provide (i) class boundaries and (ii) class limits for this frequency distribution.
-Given the class marks 22, 30, 38, and 46, provide (i) class boundaries and (ii) class limits for this frequency distribution.
Unlock Deck
Unlock for access to all 63 flashcards in this deck.
Unlock Deck
k this deck
16
Solve the problem.
-Given the class boundaries , provide (i) class limits and (ii) class marks for this frequency distribution.
-Given the class boundaries , provide (i) class limits and (ii) class marks for this frequency distribution.
Unlock Deck
Unlock for access to all 63 flashcards in this deck.
Unlock Deck
k this deck
17
The following are three daily pizza sales in units for a local pizza restaurant for the past two weeks:
-For this data, construct a stem-and-leaf display with the stem labels 1, 2, and 3 (and, hence, with two-digit leaves).
-For this data, construct a stem-and-leaf display with the stem labels 1, 2, and 3 (and, hence, with two-digit leaves).
Unlock Deck
Unlock for access to all 63 flashcards in this deck.
Unlock Deck
k this deck
18
The following are three daily pizza sales in units for a local pizza restaurant for the past two weeks:
-For this data, construct a stem-and-leaf display with one-digit leaves.
-For this data, construct a stem-and-leaf display with one-digit leaves.
Unlock Deck
Unlock for access to all 63 flashcards in this deck.
Unlock Deck
k this deck
19
To group data on the number of potential buyers entering an automobile dealer's showroom for a given week, the sales manager uses the classes , and 125-149. Explain what difficulties might arise.
Unlock Deck
Unlock for access to all 63 flashcards in this deck.
Unlock Deck
k this deck
20
In a graph of frequency distribution with classes 10-19, 20-29, 30-59, and 60-69, explain why a histogram of the data might be misleading if all the heights of the rectangles are equal to the class frequencies.
Unlock Deck
Unlock for access to all 63 flashcards in this deck.
Unlock Deck
k this deck
21
List the data which correspond to the following stem-and-leaf display.
Unlock Deck
Unlock for access to all 63 flashcards in this deck.
Unlock Deck
k this deck
22
List the data which correspond to the following stem-and-leaf display.
Unlock Deck
Unlock for access to all 63 flashcards in this deck.
Unlock Deck
k this deck
23
The Highway Patrol, using radar, checked the speeds (in ) of 30 passing motorists at a checkpoint. The results are listed below. Construct a dot diagram for the data.
Unlock Deck
Unlock for access to all 63 flashcards in this deck.
Unlock Deck
k this deck
24
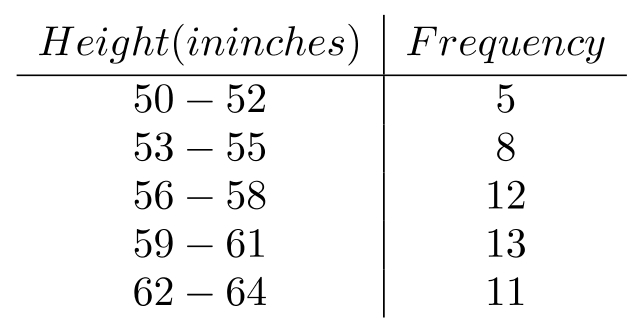
The heights (in inches) of 30 adult males are listed below. Construct a dot diagram for the data.
Unlock Deck
Unlock for access to all 63 flashcards in this deck.
Unlock Deck
k this deck
25
At a dairy products convention, an interviewer asked 40 persons to name their favorite dairy product. Their replies were ice cream, butter, cheese, butter, butter, milk, butter, sour cream, ice cream, cheese, butter, cheese, milk, cheese, butter, cheese, ice cream, butter, milk, butter, sour cream, ice cream, cheese, milk, butter, ice cream, cheese, butter, milk, sour cream, butter, cheese, milk, butter, cheese, milk, ice cream, sour cream, ice cream, and ice cream. Draw a bar chart with vertical bars for these categorical data.
Unlock Deck
Unlock for access to all 63 flashcards in this deck.
Unlock Deck
k this deck
26
In a software engineering class, the professor asked 48 students to name their favorite programming language. Their replies were Java, Perl, Perl, C++, Java, Lisp, Perl, Java, C++, Perl, Perl, Java, Smalltalk, Perl, Java, C++, Perl, Lisp, Perl, Perl, Java, Java, C++, Perl, Smalltalk, C++, Perl, Java, Lisp, Java, Perl, Perl, Perl, Smalltalk, C++, Java, Lisp, Perl, Java, Lisp, Java, Perl, Smalltalk, Java, Lisp, C++, Java, and Perl. Draw a bar chart with vertical bars for these categorical data.
Unlock Deck
Unlock for access to all 63 flashcards in this deck.
Unlock Deck
k this deck
27
A study was conducted to determine how people get jobs. Four hundred subjects were randomly selected and the results are listed below.
Construct a Pareto diagram in the form of a bar chart for the data. (Remember, in a Pareto diagram, the data is arranged in descending order.)
Construct a Pareto diagram in the form of a bar chart for the data. (Remember, in a Pareto diagram, the data is arranged in descending order.) Unlock Deck
Unlock for access to all 63 flashcards in this deck.
Unlock Deck
k this deck
28
The heights (in inches) of 30 adult males are listed below. Construct a Pareto diagram in the form of a bar chart for the data. (Remember, in a Pareto diagram, the data is arranged in descending order.)
Unlock Deck
Unlock for access to all 63 flashcards in this deck.
Unlock Deck
k this deck
29
For the data below, construct a frequency histogram and a frequency polygon.
Unlock Deck
Unlock for access to all 63 flashcards in this deck.
Unlock Deck
k this deck
30
For the data below, construct a frequency histogram and a frequency polygon.
Unlock Deck
Unlock for access to all 63 flashcards in this deck.
Unlock Deck
k this deck
31
The grade point averages for 40 students are listed below. Construct a frequency histogram and a frequency polygon using eight classes.
Unlock Deck
Unlock for access to all 63 flashcards in this deck.
Unlock Deck
k this deck
32
The heights (in inches) of 30 adult males are listed below. Construct a frequency histogram using five classes.
Unlock Deck
Unlock for access to all 63 flashcards in this deck.
Unlock Deck
k this deck
33
The heights (in inches) of 30 adult males are listed below. Construct a frequency polygon using five classes.
Unlock Deck
Unlock for access to all 63 flashcards in this deck.
Unlock Deck
k this deck
34
For the data below, construct an ogive.
Unlock Deck
Unlock for access to all 63 flashcards in this deck.
Unlock Deck
k this deck
35
For the data below, construct an ogive.
Unlock Deck
Unlock for access to all 63 flashcards in this deck.
Unlock Deck
k this deck
36
For the data below, construct an ogive.
Unlock Deck
Unlock for access to all 63 flashcards in this deck.
Unlock Deck
k this deck
37
For the data below, construct an ogive.
Unlock Deck
Unlock for access to all 63 flashcards in this deck.
Unlock Deck
k this deck
38
A study was conducted to determine how people get jobs. Four hundred subjects were randomly selected and the results are listed below.
Construct a pie chart of the data.
Construct a pie chart of the data. Unlock Deck
Unlock for access to all 63 flashcards in this deck.
Unlock Deck
k this deck
39
The grade point averages for 40 students are listed below. Construct an ogive using eight classes.
Unlock Deck
Unlock for access to all 63 flashcards in this deck.
Unlock Deck
k this deck
40
The heights (in inches) of 30 adult males are listed below. Construct a ogive using five classes.
Unlock Deck
Unlock for access to all 63 flashcards in this deck.
Unlock Deck
k this deck
41
The Highway Patrol, using radar, checked the speeds (in mph) of 30 passing motorists at a checkpoint. The results are listed below. Construct an ogive using six classes.
Unlock Deck
Unlock for access to all 63 flashcards in this deck.
Unlock Deck
k this deck
42
In a study of the growth of termite hills in the desert, an experiment was performed to determine how well the height of such hills can be determined from aerial photographs. Following are the heights of 36 termite hills (in centimeters) estimated from aerial photographs, , and measured on the ground, :
Produce a two-way frequency distribution with the classes 200-219, 220-239, 240-259, 260-279, and 280-299 for both variables.
Produce a two-way frequency distribution with the classes 200-219, 220-239, 240-259, 260-279, and 280-299 for both variables. Unlock Deck
Unlock for access to all 63 flashcards in this deck.
Unlock Deck
k this deck
43
Following are the numbers of minutes it took 27 students to memorize two lists of German adjectives, one in the morning and one in the late afternoon.
Produce a two-way frequency table for these data using the classes 10-14, 15-19, 20-24, and 25-29 for the morning, and the classes 15-19, 20-24, and 25-29 for the afternoon.
Produce a two-way frequency table for these data using the classes 10-14, 15-19, 20-24, and 25-29 for the morning, and the classes 15-19, 20-24, and 25-29 for the afternoon. Unlock Deck
Unlock for access to all 63 flashcards in this deck.
Unlock Deck
k this deck
44
One of the advantages of frequency distributions is that we can find the exact highest value in the data.
Unlock Deck
Unlock for access to all 63 flashcards in this deck.
Unlock Deck
k this deck
45
The sum of the frequencies in a frequency distribution is equal to the number of elements in the sample.
Unlock Deck
Unlock for access to all 63 flashcards in this deck.
Unlock Deck
k this deck
46
An ogive of a cumulative "less than" distribution always decreases as we move from left to right.
Unlock Deck
Unlock for access to all 63 flashcards in this deck.
Unlock Deck
k this deck
47
For a frequency distribution, we can never find the total of all the original scores.
Unlock Deck
Unlock for access to all 63 flashcards in this deck.
Unlock Deck
k this deck
48
It is possible for the class boundaries of an interval to be the same as its class limits.
Unlock Deck
Unlock for access to all 63 flashcards in this deck.
Unlock Deck
k this deck
49
A frequency polygon is a line graph of a cumulative frequency distribution.
Unlock Deck
Unlock for access to all 63 flashcards in this deck.
Unlock Deck
k this deck
50
A stem-and-leaf display contains no more information than a frequency distribution.
Unlock Deck
Unlock for access to all 63 flashcards in this deck.
Unlock Deck
k this deck
51
A frequency distribution always has equal class intervals.
Unlock Deck
Unlock for access to all 63 flashcards in this deck.
Unlock Deck
k this deck
52
Frequency distributions are of two types: quantitative and qualitative.
Unlock Deck
Unlock for access to all 63 flashcards in this deck.
Unlock Deck
k this deck
53
If two consecutive class intervals of a frequency distribution are 60-67 and 68-75, the class boundaries of the second interval are 68.95-75.95.
Unlock Deck
Unlock for access to all 63 flashcards in this deck.
Unlock Deck
k this deck
54
In constructing a frequency distribution from raw data, there will usually be between _______ and _______ classes.
Unlock Deck
Unlock for access to all 63 flashcards in this deck.
Unlock Deck
k this deck
55
The single number that best represents a given interval of a frequency distribution is called the _______.
Unlock Deck
Unlock for access to all 63 flashcards in this deck.
Unlock Deck
k this deck
56
In a stem-and-leaf display, each digit to the right of the vertical line is called a _______.
Unlock Deck
Unlock for access to all 63 flashcards in this deck.
Unlock Deck
k this deck
57
Pie charts are graphical representations of _______ distributions.
Unlock Deck
Unlock for access to all 63 flashcards in this deck.
Unlock Deck
k this deck
58
If categories of a distribution differ in kind rather than degree, the resulting table is called a _______.
Unlock Deck
Unlock for access to all 63 flashcards in this deck.
Unlock Deck
k this deck
59
A bar chart of a frequency distribution is called a _______.
Unlock Deck
Unlock for access to all 63 flashcards in this deck.
Unlock Deck
k this deck
60
A class mark is defined as the average of _______
Unlock Deck
Unlock for access to all 63 flashcards in this deck.
Unlock Deck
k this deck
61
A class interval can be defined as a _______
Unlock Deck
Unlock for access to all 63 flashcards in this deck.
Unlock Deck
k this deck
62
For an ogive, the horizontal axis should contain the class _______
Unlock Deck
Unlock for access to all 63 flashcards in this deck.
Unlock Deck
k this deck
63
A numerical distribution is the same as a _______ distribution.
Unlock Deck
Unlock for access to all 63 flashcards in this deck.
Unlock Deck
k this deck
Unlock Deck
Unlock for access to all 63 flashcards in this deck.


