Deck 14: Appendix 14: Chi-Square Tests
Full screen (f)
Question
Question
Question
(Use the information below for the next two questions.)
A major car manufacturer was interested in whether its midsize car was selling consistently in two markets with respect to the annual income of the car purchasers. 500 new car buyers in Chicago and Miami were surveyed. In Chicago the following pattern was observed:
< $20,000 5%
$20,000-$29,999 20%
$30,000-$39,999 40%
$40,000-$49,999 30%
? $50,000 5%
Among those surveyed in Miami, 20 earned under $20,000; 70 earned between $20,000 and $30,000; 265 earned between $30,000 and $40,000; 125 earned between $40,000 and $50,000; and 20 earned more than $50,000.
-Using the data provided, the calculated value of =
=
A) 0.883.
B) 36.3.
C) 11.95.
D) -0.542.
E) not enough information is provided to calculate the value.
A major car manufacturer was interested in whether its midsize car was selling consistently in two markets with respect to the annual income of the car purchasers. 500 new car buyers in Chicago and Miami were surveyed. In Chicago the following pattern was observed:
< $20,000 5%
$20,000-$29,999 20%
$30,000-$39,999 40%
$40,000-$49,999 30%
? $50,000 5%
Among those surveyed in Miami, 20 earned under $20,000; 70 earned between $20,000 and $30,000; 265 earned between $30,000 and $40,000; 125 earned between $40,000 and $50,000; and 20 earned more than $50,000.
-Using the data provided, the calculated value of
=A) 0.883.
B) 36.3.
C) 11.95.
D) -0.542.
E) not enough information is provided to calculate the value.
Question
Question
Question
Which formula is used to estimate the chi-square goodness-of-fit measure, where i is the observed number of cases falling in the ith category, Ei is the expected number of cases falling in the ith category; and k is the number of degrees of freedom.
A)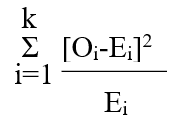
B)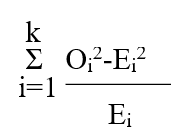
C)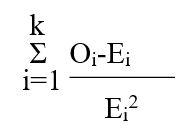
D)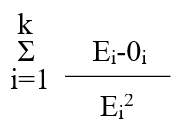
E)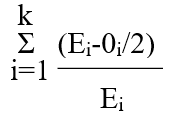
A)
B)
C)
D)
E)
Question
Question
Question
Question
Question
Question
Question
Question
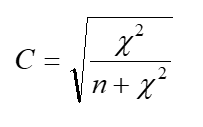
The following formula is for:
A) the chi-square correction for attenuation.
B) the index of predictive association.
C) the chi-square test for distribution symmetry.
D) the contingency coefficient.
E) the coefficient of concordance.
A) the chi-square correction for attenuation.
B) the index of predictive association.
C) the chi-square test for distribution symmetry.
D) the contingency coefficient.
E) the coefficient of concordance.
Question
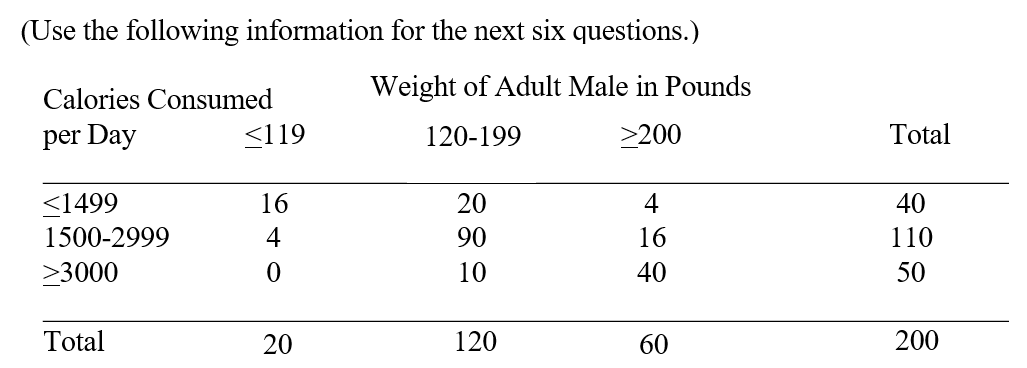
-Based on the above information, calculate the expected number of adult males who weigh 200 lbs. or more and consume 3000 or more calories per day.
A) 40
B) 15
C) 55
D) 20
E) none of the above
Question
-Assume that all expected frequencies have been computed. What is the next step in the contingency table analysis?
A) Compare the calculated expected frequencies with the observed frequencies using the t-test.
B) Compute the contingency coefficient.
C) Compute the chi-square
D) Compute the r2
E) None of the above.
Question
-How many degrees of freedom are associated with the above contingency table analysis?
A) 9
B) 6
C) 199
D) 198
E) none of the above
Question
-Given no information about the weight of adult males, what is the best estimate of the number of calories consumed per day by adult males?
A) 1499
B) 1500-2999
C) 3000
D) 2250
E) none of the above
Question
-Suppose that you are predicting the number of calories consumed by adult males by the weight of adult males. Calculate the index of predictive association.
A) 0.00
B) 0.44
C) 1.00
D) 0.40
E) none of the above
Question
-What percentage of the predictions about calorie consumption would be made correctly by taking weight into account?
A) 73%
B) 63%
C) 67%
D) 77%
E) none of the above
Question
Question
Question
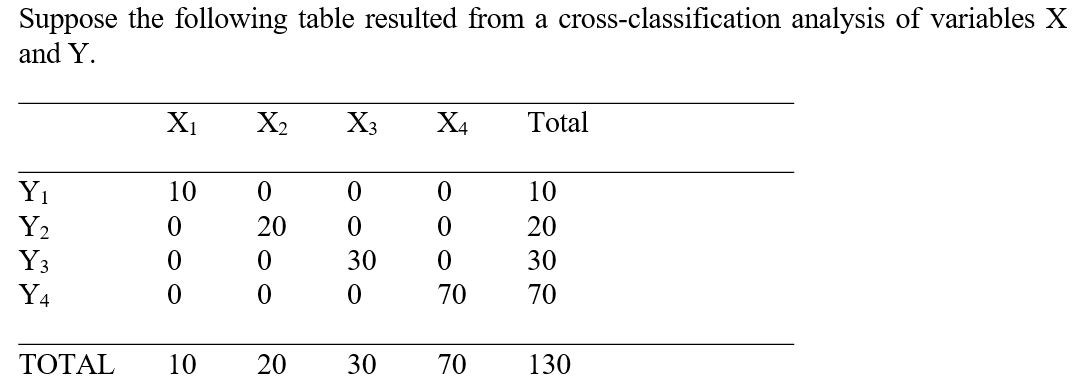
-The index of predictive association for this data
A) is 0.
B) is .5.
C) is -1.
D) is 1.
E) cannot be determined.
Question
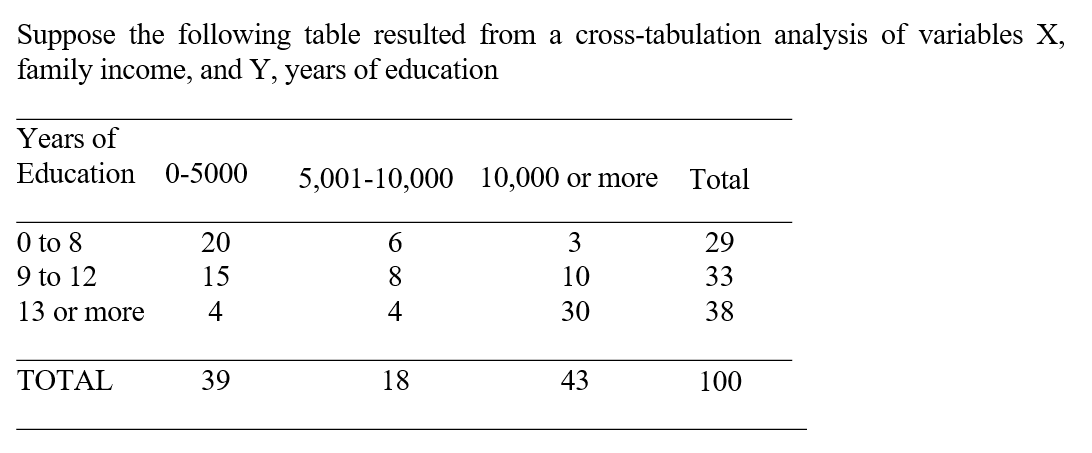
-Given
 when predicting the A classification from the B classification, the index of predictive association for the above data is
A) 0.
B) .25.
C) .32.
D) .50.
E) .67.
Question
Question

Unlock Deck
Sign up to unlock the cards in this deck!
Unlock Deck
Unlock Deck
1/26
Play
Full screen (f)
Deck 14: Appendix 14: Chi-Square Tests
1
The chi-square test is applicable in situations where
A) the subjects are matched.
B) frequencies are unimportant.
C) the researcher is interested in all classes of the variable and does not wish to dichotomize it.
D) the trials are dependent.
E) more than two related samples are being compared.
A) the subjects are matched.
B) frequencies are unimportant.
C) the researcher is interested in all classes of the variable and does not wish to dichotomize it.
D) the trials are dependent.
E) more than two related samples are being compared.
the researcher is interested in all classes of the variable and does not wish to dichotomize it.
2
Which statement(s) pertaining to the chi-square distribution is true?
A) The chi-square distribution is completely determined by the degrees of freedom.
B) The mean of the chi-square distribution is equal to the number of degrees of freedom.
C) The variance of the chi-square distribution is equal to two times the number of degrees of freedom.
D) b and c above
E) all of the above
all of the above
3
(Use the information below for the next two questions.)
A major car manufacturer was interested in whether its midsize car was selling consistently in two markets with respect to the annual income of the car purchasers. 500 new car buyers in Chicago and Miami were surveyed. In Chicago the following pattern was observed:
< $20,000 5%
$20,000-$29,999 20%
$30,000-$39,999 40%
$40,000-$49,999 30%
? $50,000 5%
Among those surveyed in Miami, 20 earned under $20,000; 70 earned between $20,000 and $30,000; 265 earned between $30,000 and $40,000; 125 earned between $40,000 and $50,000; and 20 earned more than $50,000.
-Using the data provided, the calculated value of =
A) 0.883.
B) 36.3.
C) 11.95.
D) -0.542.
E) not enough information is provided to calculate the value.
A major car manufacturer was interested in whether its midsize car was selling consistently in two markets with respect to the annual income of the car purchasers. 500 new car buyers in Chicago and Miami were surveyed. In Chicago the following pattern was observed:
< $20,000 5%
$20,000-$29,999 20%
$30,000-$39,999 40%
$40,000-$49,999 30%
? $50,000 5%
Among those surveyed in Miami, 20 earned under $20,000; 70 earned between $20,000 and $30,000; 265 earned between $30,000 and $40,000; 125 earned between $40,000 and $50,000; and 20 earned more than $50,000.
-Using the data provided, the calculated value of
=A) 0.883.
B) 36.3.
C) 11.95.
D) -0.542.
E) not enough information is provided to calculate the value.
36.3.
4
A researcher had calculated the sample chi-square test statistic to be equal to ?2 = 7.71. For an alpha level of .10 (i.e., alpha = .10) and 4 degrees of freedom, the critical value of the chi-square statistic is 7.78. The appropriate conclusion is that
A) the sample result is likely to be attributed to chance alone.
B) the null hypothesis should not be rejected.
C) the null hypothesis should be rejected.
D) a and b above are correct.
E) a and c above are correct.
A) the sample result is likely to be attributed to chance alone.
B) the null hypothesis should not be rejected.
C) the null hypothesis should be rejected.
D) a and b above are correct.
E) a and c above are correct.
Unlock Deck
Unlock for access to all 26 flashcards in this deck.
Unlock Deck
k this deck
5
An analyst wishes to analyze a set of nominal data to determine if some observed pattern of frequencies is in accord with a stated null hypothesis. The preferred statistical technique is:
A) the z-test for one mean
B) Chi-square goodness-of-fit test
C) the z-test for two means
D) the Kolmogorov-Smirnov test
E) the z-test for one proportion
A) the z-test for one mean
B) Chi-square goodness-of-fit test
C) the z-test for two means
D) the Kolmogorov-Smirnov test
E) the z-test for one proportion
Unlock Deck
Unlock for access to all 26 flashcards in this deck.
Unlock Deck
k this deck
6
Which formula is used to estimate the chi-square goodness-of-fit measure, where i is the observed number of cases falling in the ith category, Ei is the expected number of cases falling in the ith category; and k is the number of degrees of freedom.
A)
B)
C)
D)
E)
A)
B)
C)
D)
E)
Unlock Deck
Unlock for access to all 26 flashcards in this deck.
Unlock Deck
k this deck
7
The chi-square contingency table is ideally suited for
A) determining whether two random samples come from populations with the same median.
B) analyzing observations on the same individual in a pretest-posttest experiment.
C) an analysis that involves two related samples.
D) determining whether a given set of observations has indeed been drawn at random from a single population.
E) investigating the independence of variables in cross classifications.
Unlock Deck
Unlock for access to all 26 flashcards in this deck.
Unlock Deck
k this deck
8
Which of the following statements regarding contingency tables is FALSE?
A) To generate the expected frequencies for each cell in a chi-square contingency table test, one need simply multiply the marginal frequencies and divide by the total number of cases.
B) The marginal total of a row in a chi-square contingency table test is determined as the product of the expected frequencies for that row.
C) In a contingency table test, the null hypothesis is that the variables of classification are independent.
D) The expected number of cases in each cell in a contingency table test rest on the assumption that the variables of classification are independent.
E) When the observations forming the cross tabulation are related as in a before-after experiment, the chi-square contingency table is not applicable.
Unlock Deck
Unlock for access to all 26 flashcards in this deck.
Unlock Deck
k this deck
9
In a two-way contingency table with four rows and four columns, the appropriate degrees of freedom for the chi-square test statistic is
A) 3,3.
B) 15.
C) 3,12.
D) 9.
E) to determine the appropriate degrees of freedom one must know n, the number of subjects in the experiment.
A) 3,3.
B) 15.
C) 3,12.
D) 9.
E) to determine the appropriate degrees of freedom one must know n, the number of subjects in the experiment.
Unlock Deck
Unlock for access to all 26 flashcards in this deck.
Unlock Deck
k this deck
10
The upper and lower limits of the contingency coefficient are
A) -1,1.
B) 0,1.
C) 0, and an upper limit which is a function of the number of categories for each variable.
D) -1, and an upper limit which is a function of the number of categories for each variable.
E) none of the above.
A) -1,1.
B) 0,1.
C) 0, and an upper limit which is a function of the number of categories for each variable.
D) -1, and an upper limit which is a function of the number of categories for each variable.
E) none of the above.
Unlock Deck
Unlock for access to all 26 flashcards in this deck.
Unlock Deck
k this deck
11
If r is the number of rows and c is the number of columns, the total number of degrees of freedom in a two-way contingency table is given by
A) rc.
B) (r + 1)(c + 1).
C) (r - 1)(c - 1).
D)
E)
A) rc.
B) (r + 1)(c + 1).
C) (r - 1)(c - 1).
D)
E)
Unlock Deck
Unlock for access to all 26 flashcards in this deck.
Unlock Deck
k this deck
12
Which of the following statements pertaining to the contingency coefficient is FALSE?
A) The contingency coefficient is directly related to the chi-square test.
B) Its upper value limit is determined by the number of categories in a problem.
C) Some of the difficulties encountered in interpreting the contingency coefficient are overcome by squaring the coefficient, thereby obtaining the proportion of variance in the criterion variable explained by the predictor variable.
D) The contingency coefficient as a measure of association is difficult to interpret purely by examining the calculated value.
E) The contingency coefficient provides a measure of the strength of the association between the variables.
Unlock Deck
Unlock for access to all 26 flashcards in this deck.
Unlock Deck
k this deck
13
A researcher interested in measuring the association between two nominally scaled attributes should use
A) the contingency coefficient.
B) t-test for nominal data.
C) Pearson's product moment correlation coefficient.
D) the coefficient of consistency.
E) none of the above.
A) the contingency coefficient.
B) t-test for nominal data.
C) Pearson's product moment correlation coefficient.
D) the coefficient of consistency.
E) none of the above.
Unlock Deck
Unlock for access to all 26 flashcards in this deck.
Unlock Deck
k this deck
14
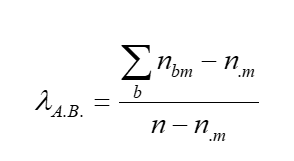
The following formula is for:
A) the chi-square correction for attenuation.
B) the index of predictive association.
C) the chi-square test for distribution symmetry.
D) the contingency coefficient.
E) the coefficient of concordance.
A) the chi-square correction for attenuation.
B) the index of predictive association.
C) the chi-square test for distribution symmetry.
D) the contingency coefficient.
E) the coefficient of concordance.
Unlock Deck
Unlock for access to all 26 flashcards in this deck.
Unlock Deck
k this deck
15
-Based on the above information, calculate the expected number of adult males who weigh 200 lbs. or more and consume 3000 or more calories per day.
A) 40
B) 15
C) 55
D) 20
E) none of the above
Unlock Deck
Unlock for access to all 26 flashcards in this deck.
Unlock Deck
k this deck
16
-Assume that all expected frequencies have been computed. What is the next step in the contingency table analysis?
A) Compare the calculated expected frequencies with the observed frequencies using the t-test.
B) Compute the contingency coefficient.
C) Compute the chi-square
D) Compute the r2
E) None of the above.
Unlock Deck
Unlock for access to all 26 flashcards in this deck.
Unlock Deck
k this deck
17
-How many degrees of freedom are associated with the above contingency table analysis?
A) 9
B) 6
C) 199
D) 198
E) none of the above
Unlock Deck
Unlock for access to all 26 flashcards in this deck.
Unlock Deck
k this deck
18
-Given no information about the weight of adult males, what is the best estimate of the number of calories consumed per day by adult males?
A) 1499
B) 1500-2999
C) 3000
D) 2250
E) none of the above
Unlock Deck
Unlock for access to all 26 flashcards in this deck.
Unlock Deck
k this deck
19
-Suppose that you are predicting the number of calories consumed by adult males by the weight of adult males. Calculate the index of predictive association.
A) 0.00
B) 0.44
C) 1.00
D) 0.40
E) none of the above
Unlock Deck
Unlock for access to all 26 flashcards in this deck.
Unlock Deck
k this deck
20
-What percentage of the predictions about calorie consumption would be made correctly by taking weight into account?
A) 73%
B) 63%
C) 67%
D) 77%
E) none of the above
Unlock Deck
Unlock for access to all 26 flashcards in this deck.
Unlock Deck
k this deck
21
Which of the following statements pertaining to the index of predictive association is FALSE?
A) The index of predictive association is useful when nominally scaled data are available and when we are interested in the degree of improvement in predictions of the criterion variable brought about by considering the classes of the predictor variable.
B) The index of predictive association is equal to one, if the B classification is of no help in predicting the A classification.
C) The index of predictive association gA.B. measures the relative decrease in the probability of error by taking account of the B classification in predicting the A classification over the error of prediction with the B classification unknown.
D) a and b above
E) a and c above
Unlock Deck
Unlock for access to all 26 flashcards in this deck.
Unlock Deck
k this deck
22
The ERROR when predicting an N classification when the M classification is unknown is 60%. N.M = .5. If the M classification is taken into account,_____of the N classification should now be predicted correctly.
A) 30%
B) 40%
C) 50%
D) 60%
E) 70%
A) 30%
B) 40%
C) 50%
D) 60%
E) 70%
Unlock Deck
Unlock for access to all 26 flashcards in this deck.
Unlock Deck
k this deck
23
-The index of predictive association for this data
A) is 0.
B) is .5.
C) is -1.
D) is 1.
E) cannot be determined.
Unlock Deck
Unlock for access to all 26 flashcards in this deck.
Unlock Deck
k this deck
24
-Given
when predicting the A classification from the B classification, the index of predictive association for the above data isA) 0.
B) .25.
C) .32.
D) .50.
E) .67.
Unlock Deck
Unlock for access to all 26 flashcards in this deck.
Unlock Deck
k this deck
25
A log-linear model is an extension of a:
A) t-test
B) linear regression model
C) cross-tab
D) chi-square
E) contingency index
A) t-test
B) linear regression model
C) cross-tab
D) chi-square
E) contingency index
Unlock Deck
Unlock for access to all 26 flashcards in this deck.
Unlock Deck
k this deck
26
Imagine you are a brand manager, and you have a variable, "brand" that is coded 1/0: 1 if the consumer bought your brand, 0 if they bought some competitor brand. Which of the following uses of this variable is improper:
A) a t-test on a preference rating scale, using "brand" to define the groups
B) a regression using age, household size, and income to predict "brand"
C) a regression using "brand" to predict preference
D) a log linear model applied to a "brand" by gender cross-tab
E) a logit using age and income to predict "brand"
Unlock Deck
Unlock for access to all 26 flashcards in this deck.
Unlock Deck
k this deck
Unlock Deck
Unlock for access to all 26 flashcards in this deck.


