Deck 3: Data Visualization and Summary Measures
Full screen (f)
Question
Using the following table, what is the percent of the relative frequency of a Blue car being observed? 
A) 22.06%
B) 2.206%
C) 21.000%
D) 0.221%
A) 22.06%
B) 2.206%
C) 21.000%
D) 0.221%
Question
Using the following table, what is the percent of the relative frequency of a Blue car being observed? 
A) 21.48%
B) 2.148%
C) 20.3%
D) 0.2148%
A) 21.48%
B) 2.148%
C) 20.3%
D) 0.2148%
Question
Question
Question
Question
Marin produced the following histogram based on his observations on the age of players willing to sample a video game. He then organized the age into frequencies and interval width of the respective intervals. Based on the results, which range has the best frequency for future video game sampling? 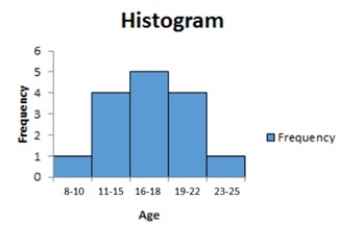
A) 16-18
B) 19-22
C) 23-25
D) 8-10
A) 16-18
B) 19-22
C) 23-25
D) 8-10
Question
Using the following histogram, how would the distribution be described? 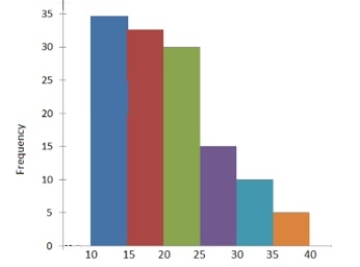
A) bell-shaped
B) symmetric skewed
C) positively skewed
D) negatively skewed
A) bell-shaped
B) symmetric skewed
C) positively skewed
D) negatively skewed
Question
Question
The following chart represents the results of a two categorical variable study reflecting on education level survey in 2006 and the same survey results from 2016. Which type of chart is being displayed? 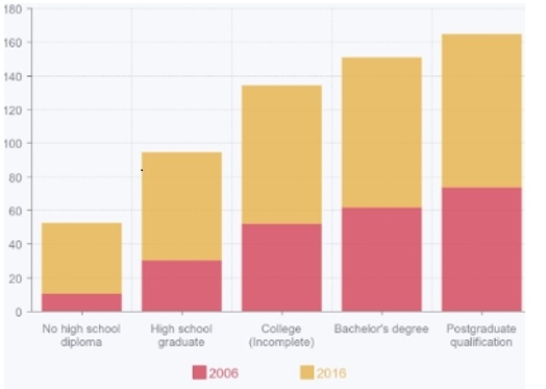
A) scatterplot
B) contingency table
C) histogram
D) stacked column chart
A) scatterplot
B) contingency table
C) histogram
D) stacked column chart
Question
Below is the Scatterplot of 2 numeric variables. What type of relationship is represented? 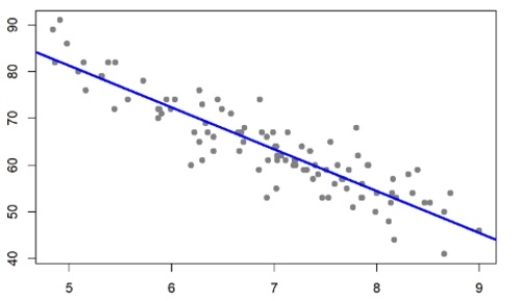
A) nonlinear relationship
B) linear relationship
C) matrix relationship
D) no relationship
A) nonlinear relationship
B) linear relationship
C) matrix relationship
D) no relationship
Question
Question
Question
What is the arithmetic mean in the following table on the variable score? 
A) 0.93
B) 0.88
C) 0.735
D) 0.8450
A) 0.93
B) 0.88
C) 0.735
D) 0.8450
Question
What is the arithmetic mean in the following table on the variable score? 
A) 0.92
B) 0.88
C) 0.765
D) 0.8575
A) 0.92
B) 0.88
C) 0.765
D) 0.8575
Question
Question
Question
Question
Question
Question
Question
Question
Using the following Boxplot, identify the median score on the test. 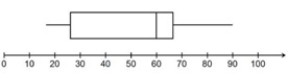
A) 28
B) 68
C) 60
D) 90
A) 28
B) 68
C) 60
D) 90
Question
Using the following Boxplot, what is the star to the far right considered? 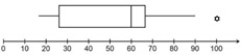
A) upper quartile mark
B) an outlier
C) a whisker
D) a deviation
A) upper quartile mark
B) an outlier
C) a whisker
D) a deviation
Question
In the following Boxplot, the left whisker is longer than the right whisker. This indicates that the underlining distribution is _______. 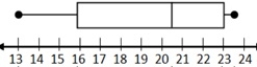
A) negatively skewed
B) median skewed
C) positively skewed
D) no indicated skewed
A) negatively skewed
B) median skewed
C) positively skewed
D) no indicated skewed
Question
Question
Question
Question
Question
Question
The following table is the summary statistics for Scores. Calculate the Sharpe ratio of growth. Assume Rf = 4. 
A) 4.322
B) 1.245
C) 7.792
D) 6.989
A) 4.322
B) 1.245
C) 7.792
D) 6.989
Question
The following table is the summary statistics for Scores. Calculate the Sharpe ratio of growth. Assume Rf = 4. 
A) 3.699
B) 1.232
C) 6.472
D) 5.438
A) 3.699
B) 1.232
C) 6.472
D) 5.438
Question
Alex is working on an investment portfolio reviewing Gas and Diesel summary statistics. Which investment would be the better risk per unit, assuming Rf = 2? 
A) Gas provides a higher Sharpe ratio with 34.2178, thus more reward per unit of risk.
B) Gas provides a higher Sharpe ratio with 61.1395, thus more reward per unit of risk.
C) Diesel provides a higher Sharpe ratio with 59.3583, thus more reward per unit of risk.
D) Diesel provides a higher Sharpe ratio with 42.9331, thus more reward per unit of risk.
Question
Alex is working on an investment portfolio reviewing Gas and Diesel summary statistics. Which investment would be the better risk per unit, assuming Rf = 2? 
A) Gas provides a higher Sharpe ratio with 32.5607, thus more reward per unit of risk.
B) Gas provides a higher Sharpe ratio with 73.9700, thus more reward per unit of risk.
C) Diesel provides a higher Sharpe ratio with 153.8165, thus more reward per unit of risk.
D) Diesel provides a higher Sharpe ratio with 42.5738, thus more reward per unit of risk.
Question
Question
Question
Question
Question
Question
Question
Question
Question
The following scatterplot is of % of fat and BMI Index Score. What type of linear relationship is being displayed? 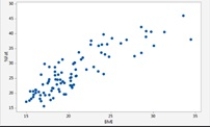
A) negative linear relationship
B) positive linear relationship
C) no relationship
D) scattered negative relationship
A) negative linear relationship
B) positive linear relationship
C) no relationship
D) scattered negative relationship
Question
Question
Question
Question
Question
Question
Question
Question
Question
Question

Unlock Deck
Sign up to unlock the cards in this deck!
Unlock Deck
Unlock Deck
1/52
Play
Full screen (f)
Deck 3: Data Visualization and Summary Measures
1
Using the following table, what is the percent of the relative frequency of a Blue car being observed?
A) 22.06%
B) 2.206%
C) 21.000%
D) 0.221%
A) 22.06%
B) 2.206%
C) 21.000%
D) 0.221%
22.06%
2
Using the following table, what is the percent of the relative frequency of a Blue car being observed?
A) 21.48%
B) 2.148%
C) 20.3%
D) 0.2148%
A) 21.48%
B) 2.148%
C) 20.3%
D) 0.2148%
21.48%
3
Using R, Bart wants to create a bar chart showing the frequency of the color of cars that pass over the I-270 overpass at the Main Street exit. What function should he use?
A) table
B) barplot
C) abline
D) view
A) table
B) barplot
C) abline
D) view
barplot
4
Bill wants to calculate the width of each interval by using the approximation formula. He first created a frequency distribution with 4 intervals. The minimum and maximum for the variable are -31.1 and 65.42 respectfully. Calculate the width of each interval for Bill.
A) 16.355
B) 7.775
C) 24.130
D) -24.130
A) 16.355
B) 7.775
C) 24.130
D) -24.130
Unlock Deck
Unlock for access to all 52 flashcards in this deck.
Unlock Deck
k this deck
5
Bill wants to calculate the width of each interval by using the approximation formula. He first created a frequency distribution with 5 intervals. The minimum and maximum for the variable are -32.4 and 65.42 respectfully. Calculate the width of each interval for Bill.
A) 13.084
B) 6.604
C) 19.564
D) -19.564
A) 13.084
B) 6.604
C) 19.564
D) -19.564
Unlock Deck
Unlock for access to all 52 flashcards in this deck.
Unlock Deck
k this deck
6
Marin produced the following histogram based on his observations on the age of players willing to sample a video game. He then organized the age into frequencies and interval width of the respective intervals. Based on the results, which range has the best frequency for future video game sampling?
A) 16-18
B) 19-22
C) 23-25
D) 8-10
A) 16-18
B) 19-22
C) 23-25
D) 8-10
Unlock Deck
Unlock for access to all 52 flashcards in this deck.
Unlock Deck
k this deck
7
Using the following histogram, how would the distribution be described?
A) bell-shaped
B) symmetric skewed
C) positively skewed
D) negatively skewed
A) bell-shaped
B) symmetric skewed
C) positively skewed
D) negatively skewed
Unlock Deck
Unlock for access to all 52 flashcards in this deck.
Unlock Deck
k this deck
8
As a researcher, you should be mindful on constructing and interpreting graphs. All of the following are recommended guidelines you should follow except for one. Which one does not reflect a guideline?
A) The simplest graph should be used for a given set of data.
B) Axis should be clearly marked and labeled.
C) On a bar chart or histogram, bar widths should always reflect various widths of the data.
D) Be mindful of the upper limits on the vertical axis to prevent compression, hiding variant details.
Unlock Deck
Unlock for access to all 52 flashcards in this deck.
Unlock Deck
k this deck
9
The following chart represents the results of a two categorical variable study reflecting on education level survey in 2006 and the same survey results from 2016. Which type of chart is being displayed?
A) scatterplot
B) contingency table
C) histogram
D) stacked column chart
A) scatterplot
B) contingency table
C) histogram
D) stacked column chart
Unlock Deck
Unlock for access to all 52 flashcards in this deck.
Unlock Deck
k this deck
10
Below is the Scatterplot of 2 numeric variables. What type of relationship is represented?
A) nonlinear relationship
B) linear relationship
C) matrix relationship
D) no relationship
A) nonlinear relationship
B) linear relationship
C) matrix relationship
D) no relationship
Unlock Deck
Unlock for access to all 52 flashcards in this deck.
Unlock Deck
k this deck
11
Simone is a marketing consultant hired to review the product sales for a new high-end barista machine line. The product line has four variations, selling in four specialty store regions. To clearly show where each variation is selling best and in which regions, she plans to provide a color-scaled chart using percentage by type and location. What is the name of the chart she will be using?
A) pivot table
B) bubble plot
C) color map
D) heat map
A) pivot table
B) bubble plot
C) color map
D) heat map
Unlock Deck
Unlock for access to all 52 flashcards in this deck.
Unlock Deck
k this deck
12
What is the only meaningful measure of the central location for a categorical variable?
A) mean
B) mode
C) median
D) model
A) mean
B) mode
C) median
D) model
Unlock Deck
Unlock for access to all 52 flashcards in this deck.
Unlock Deck
k this deck
13
What is the arithmetic mean in the following table on the variable score?
A) 0.93
B) 0.88
C) 0.735
D) 0.8450
A) 0.93
B) 0.88
C) 0.735
D) 0.8450
Unlock Deck
Unlock for access to all 52 flashcards in this deck.
Unlock Deck
k this deck
14
What is the arithmetic mean in the following table on the variable score?
A) 0.92
B) 0.88
C) 0.765
D) 0.8575
A) 0.92
B) 0.88
C) 0.765
D) 0.8575
Unlock Deck
Unlock for access to all 52 flashcards in this deck.
Unlock Deck
k this deck
15
Carmen is a professor at a local university. In collecting data on her Introduction to Business course for a year, she wants to calculate the z-score for a student who scores a 84 on the final exam. The mean and the standard deviation scores on the exam are 70 and 6, respectively. Calculate the z-score.
A) 1.33
B) 2.33
C) 0.33
D) 2.67
A) 1.33
B) 2.33
C) 0.33
D) 2.67
Unlock Deck
Unlock for access to all 52 flashcards in this deck.
Unlock Deck
k this deck
16
Carmen is a professor at a local university. In collecting data on her Introduction to Business course for a year, she wants to calculate the z-score for a student who scores a 90 on the final exam. The mean and the standard deviation scores on the exam are 76 and 6, respectively. Calculate the z-score.
A) 1.33
B) 2.33
C) 0.33
D) 2.67
A) 1.33
B) 2.33
C) 0.33
D) 2.67
Unlock Deck
Unlock for access to all 52 flashcards in this deck.
Unlock Deck
k this deck
17
The empirical rule states all the following except
A) Almost all observations fall in the interval x ± 3s.
B) Approximately 95% of all observations fall in the interval x ± 2s.
C) Approximately 65% of all observations fall in the interval x ± s.
D) Approximately 68% of all observations fall in the interval x ± s.
A) Almost all observations fall in the interval x ± 3s.
B) Approximately 95% of all observations fall in the interval x ± 2s.
C) Approximately 65% of all observations fall in the interval x ± s.
D) Approximately 68% of all observations fall in the interval x ± s.
Unlock Deck
Unlock for access to all 52 flashcards in this deck.
Unlock Deck
k this deck
18
The mean credit score is 645 out of 310 used car loan applicants with a standard deviation of 17. Assuming a bell-shaped curve, what is the number of loan applicants that fall within a score of 611 and 679?
A) 68
B) 211
C) 295
D) 310
A) 68
B) 211
C) 295
D) 310
Unlock Deck
Unlock for access to all 52 flashcards in this deck.
Unlock Deck
k this deck
19
The mean credit score is 640 out of 300 used car loan applicants with a standard deviation of 16. Assuming a bell-shaped curve, what is the number of loan applicants that fall within a score of 608 and 672?
A) 96
B) 204
C) 285
D) 300
A) 96
B) 204
C) 285
D) 300
Unlock Deck
Unlock for access to all 52 flashcards in this deck.
Unlock Deck
k this deck
20
Candice is preparing for her final exam in Statistics. She knows she needs an 68 out of 100 to earn an A overall in the course. Her instructor provided the following information to the students.
- On the final, 200 students have taken it with a mean score of 60 and a standard deviation of 6. Assume the distribution of scores is bell-shaped. Calculate to see if a score of 68 is within one standard deviation of the mean.
A) Yes, 68 is the upper limit of one standard deviation from the mean.
B) Yes, the upper level of one standard deviation is 66.
C) Yes, 68 is greater than the 54, one standard deviation below the mean.
D) No, 68 is greater than the mean of 60.
Unlock Deck
Unlock for access to all 52 flashcards in this deck.
Unlock Deck
k this deck
21
Candice is preparing for her final exam in Statistics. She knows she needs an 80 out of 100 to earn an A overall in the course. Her instructor provided the following information to the students.
-On the final, 200 students have taken it with a mean score of 72 and a standard deviation of 6. Assume the distribution of scores is bell-shaped. Calculate to see if a score of 80 is within one standard deviation of the mean.
A) Yes, 80 is the upper number of one standard deviation from the mean.
B) No, the upper level of one standard deviation is 78.
C) Yes, 80 is greater than the 66, one standard deviation below the mean.
D) No, 80 is greater than the mean of 72.
Unlock Deck
Unlock for access to all 52 flashcards in this deck.
Unlock Deck
k this deck
22
Using the following Boxplot, identify the median score on the test.
A) 28
B) 68
C) 60
D) 90
A) 28
B) 68
C) 60
D) 90
Unlock Deck
Unlock for access to all 52 flashcards in this deck.
Unlock Deck
k this deck
23
Using the following Boxplot, what is the star to the far right considered?
A) upper quartile mark
B) an outlier
C) a whisker
D) a deviation
A) upper quartile mark
B) an outlier
C) a whisker
D) a deviation
Unlock Deck
Unlock for access to all 52 flashcards in this deck.
Unlock Deck
k this deck
24
In the following Boxplot, the left whisker is longer than the right whisker. This indicates that the underlining distribution is _______.
A) negatively skewed
B) median skewed
C) positively skewed
D) no indicated skewed
A) negatively skewed
B) median skewed
C) positively skewed
D) no indicated skewed
Unlock Deck
Unlock for access to all 52 flashcards in this deck.
Unlock Deck
k this deck
25
The degree of strength of the linear relationship between x and y is called?
A) correlation determination
B) index
C) standard deviation
D) correlation coefficient
A) correlation determination
B) index
C) standard deviation
D) correlation coefficient
Unlock Deck
Unlock for access to all 52 flashcards in this deck.
Unlock Deck
k this deck
26
As observations become more dispersed, the difference between the minimum and maximum observation of a variable is called __________.
A) the range
B) the variable
C) the interquartile
D) the mean absolute deviation
A) the range
B) the variable
C) the interquartile
D) the mean absolute deviation
Unlock Deck
Unlock for access to all 52 flashcards in this deck.
Unlock Deck
k this deck
27
The interquartile range is IQR = Q3 - Q1. Thus, it can be thought of as
A) the 75% interquartile range.
B) the quartile or 25% of the variable.
C) the middle 50% of the variable.
D) the incorporation of all observations.
A) the 75% interquartile range.
B) the quartile or 25% of the variable.
C) the middle 50% of the variable.
D) the incorporation of all observations.
Unlock Deck
Unlock for access to all 52 flashcards in this deck.
Unlock Deck
k this deck
28
Find the Mean Absolute Deviation (MAD) of 10, 9, 7, 9, 10.
A) 2.0
B) 0.80
C) 9.0
D) 1.0
A) 2.0
B) 0.80
C) 9.0
D) 1.0
Unlock Deck
Unlock for access to all 52 flashcards in this deck.
Unlock Deck
k this deck
29
Find the Mean Absolute Deviation (MAD) of 10, 9, 3, 8, 10.
A) 5
B) 2
C) 8
D) 4
A) 5
B) 2
C) 8
D) 4
Unlock Deck
Unlock for access to all 52 flashcards in this deck.
Unlock Deck
k this deck
30
The following table is the summary statistics for Scores. Calculate the Sharpe ratio of growth. Assume Rf = 4.
A) 4.322
B) 1.245
C) 7.792
D) 6.989
A) 4.322
B) 1.245
C) 7.792
D) 6.989
Unlock Deck
Unlock for access to all 52 flashcards in this deck.
Unlock Deck
k this deck
31
The following table is the summary statistics for Scores. Calculate the Sharpe ratio of growth. Assume Rf = 4.
A) 3.699
B) 1.232
C) 6.472
D) 5.438
A) 3.699
B) 1.232
C) 6.472
D) 5.438
Unlock Deck
Unlock for access to all 52 flashcards in this deck.
Unlock Deck
k this deck
32
Alex is working on an investment portfolio reviewing Gas and Diesel summary statistics. Which investment would be the better risk per unit, assuming Rf = 2?
A) Gas provides a higher Sharpe ratio with 34.2178, thus more reward per unit of risk.
B) Gas provides a higher Sharpe ratio with 61.1395, thus more reward per unit of risk.
C) Diesel provides a higher Sharpe ratio with 59.3583, thus more reward per unit of risk.
D) Diesel provides a higher Sharpe ratio with 42.9331, thus more reward per unit of risk.
Unlock Deck
Unlock for access to all 52 flashcards in this deck.
Unlock Deck
k this deck
33
Alex is working on an investment portfolio reviewing Gas and Diesel summary statistics. Which investment would be the better risk per unit, assuming Rf = 2?
A) Gas provides a higher Sharpe ratio with 32.5607, thus more reward per unit of risk.
B) Gas provides a higher Sharpe ratio with 73.9700, thus more reward per unit of risk.
C) Diesel provides a higher Sharpe ratio with 153.8165, thus more reward per unit of risk.
D) Diesel provides a higher Sharpe ratio with 42.5738, thus more reward per unit of risk.
Unlock Deck
Unlock for access to all 52 flashcards in this deck.
Unlock Deck
k this deck
34
The standard deviation of midterm scores and the final exam are 10.0 and 7.0, respectively. Which of the two exams offers more risk and why?
A) Both the midterm and the final share the same amount of risk.
B) The midterm exam is riskier because the standard deviation is higher.
C) The midterm exam is riskier because the standard deviation is lower.
D) There is not enough information to determine which is the riskier of the two.
A) Both the midterm and the final share the same amount of risk.
B) The midterm exam is riskier because the standard deviation is higher.
C) The midterm exam is riskier because the standard deviation is lower.
D) There is not enough information to determine which is the riskier of the two.
Unlock Deck
Unlock for access to all 52 flashcards in this deck.
Unlock Deck
k this deck
35
The standard deviation of midterm scores and the final exam are 8 and 6, respectively. Which of the two exams offers more risk and why?
A) Both the midterm and the final share the same amount of risk.
B) The midterm exam is riskier because the standard deviation is higher.
C) The final exam is riskier because the standard deviation is lower.
D) There is not enough information to determine which is the riskier of the two.
A) Both the midterm and the final share the same amount of risk.
B) The midterm exam is riskier because the standard deviation is higher.
C) The final exam is riskier because the standard deviation is lower.
D) There is not enough information to determine which is the riskier of the two.
Unlock Deck
Unlock for access to all 52 flashcards in this deck.
Unlock Deck
k this deck
36
Survey Results provided the skewness coefficient is -0.141974 and the (excess) kurtosis coefficient is 1.15926. These values imply that the return value for Survey is _______ skewed, and the distribution has a _____ tail than a normal distribution.
A) positively; longer
B) positively; shorter
C) negatively; longer
D) negatively; shorter
A) positively; longer
B) positively; shorter
C) negatively; longer
D) negatively; shorter
Unlock Deck
Unlock for access to all 52 flashcards in this deck.
Unlock Deck
k this deck
37
In analyzing the S&P 500 and the XYZ Inc. in a five-year study, the covariance (S&P 500, XYZ Inc.) is 4,254.40. What kind of linear relationship does the S&P 500 and the XYZ Inc. have?
A) a negative linear relationship
B) a positive linear relationship
C) no linear relationship
D) a neutral linear relationship
A) a negative linear relationship
B) a positive linear relationship
C) no linear relationship
D) a neutral linear relationship
Unlock Deck
Unlock for access to all 52 flashcards in this deck.
Unlock Deck
k this deck
38
In analyzing the S&P 500 and the XYZ Inc. in a five-year study, the covariance (S&P 500, XYZ Inc.) is 9,107.30. What kind of linear relationship does the S&P 500 and the XYZ Inc. have?
A) a negative linear relationship
B) a positive linear relationship
C) no linear relationship
D) a neutral linear relationship
A) a negative linear relationship
B) a positive linear relationship
C) no linear relationship
D) a neutral linear relationship
Unlock Deck
Unlock for access to all 52 flashcards in this deck.
Unlock Deck
k this deck
39
If the correlations coefficient is 0, then
A) x and y are not linearly related.
B) x and y are absolute and perfectly related.
C) x and y have a perfect positive relationship.
D) x and y have a perfect negative relationship.
A) x and y are not linearly related.
B) x and y are absolute and perfectly related.
C) x and y have a perfect positive relationship.
D) x and y have a perfect negative relationship.
Unlock Deck
Unlock for access to all 52 flashcards in this deck.
Unlock Deck
k this deck
40
If the coefficient correlation is computed to be -0.15, this means the relationship between the two variables are _______.
A) strong, positive
B) strong, negative
C) weak, positive
D) weak, negative
A) strong, positive
B) strong, negative
C) weak, positive
D) weak, negative
Unlock Deck
Unlock for access to all 52 flashcards in this deck.
Unlock Deck
k this deck
41
If the coefficient correlation is computed to be -0.85, this means the relationship between the two variables are _______.
A) strong, but positive
B) weak and negative
C) weak, but positive
D) strong, but negative
A) strong, but positive
B) weak and negative
C) weak, but positive
D) strong, but negative
Unlock Deck
Unlock for access to all 52 flashcards in this deck.
Unlock Deck
k this deck
42
The following scatterplot is of % of fat and BMI Index Score. What type of linear relationship is being displayed?
A) negative linear relationship
B) positive linear relationship
C) no relationship
D) scattered negative relationship
A) negative linear relationship
B) positive linear relationship
C) no relationship
D) scattered negative relationship
Unlock Deck
Unlock for access to all 52 flashcards in this deck.
Unlock Deck
k this deck
43
An easy way to convert relative frequencies into percentages is by dividing by 100.
Unlock Deck
Unlock for access to all 52 flashcards in this deck.
Unlock Deck
k this deck
44
When working with numerical variables, the frequency distribution is equal to the number of observations that falls into each interval.
Unlock Deck
Unlock for access to all 52 flashcards in this deck.
Unlock Deck
k this deck
45
Constructing a contingency table allows for a clear visualization of the relationship between two categorical variables.
Unlock Deck
Unlock for access to all 52 flashcards in this deck.
Unlock Deck
k this deck
46
In a scatter plot diagram, if there is no discernable pattern, then there is a positive relationship between the numerical variables.
Unlock Deck
Unlock for access to all 52 flashcards in this deck.
Unlock Deck
k this deck
47
A scatterplot with a categorical variable allows for the dynamic view of the addition of a categorical variable to the numeric plot points adding an additional layer of visible detail.
Unlock Deck
Unlock for access to all 52 flashcards in this deck.
Unlock Deck
k this deck
48
A study focused on the following numerical variables: Age, Income, and Candy (lbs). A bubble chart will help the researcher understand the relationship based on the location of the age and income plots and the size of the bubble based on candy consumption.
Unlock Deck
Unlock for access to all 52 flashcards in this deck.
Unlock Deck
k this deck
49
A line chart displays the numerical variable of a series of data points connected by a line.
Unlock Deck
Unlock for access to all 52 flashcards in this deck.
Unlock Deck
k this deck
50
Central location is defined as the way numerical data tends to cluster around a middle or central value.
Unlock Deck
Unlock for access to all 52 flashcards in this deck.
Unlock Deck
k this deck
51
In a large data set, the arithmetic mean is the primary measure of the central location.
Unlock Deck
Unlock for access to all 52 flashcards in this deck.
Unlock Deck
k this deck
52
Converting observations into z-scores is also called doubling the observation.
Unlock Deck
Unlock for access to all 52 flashcards in this deck.
Unlock Deck
k this deck
Unlock Deck
Unlock for access to all 52 flashcards in this deck.


