Deck 9: Supervised Data Mining: K-Nearest Neighbors and Naãve Bayes
Full screen (f)
Question
Using the table below, find the k-nearest neighbor for record 4 using k = 3 for age. 
A) 24, 30, & 36
B) 30, 36, & 44
C) 30, 32, & 36
D) 32, 36, & 44
A) 24, 30, & 36
B) 30, 36, & 44
C) 30, 32, & 36
D) 32, 36, & 44
Question
Using the table below, find the k-nearest neighbor for record 4 using k = 3 for age. 
A) 24, 31, & 34
B) 31, 34, & 44
C) 31, 32, & 34
D) 32, 34, & 44
A) 24, 31, & 34
B) 31, 34, & 44
C) 31, 32, & 34
D) 32, 34, & 44
Question
A new applicant, age 32, is applying for a loan. Using the table below, what is the estimated probability the loan will default using k = 3. 
A) 100%
B) 33%
C) 67%
D) 0%
A) 100%
B) 33%
C) 67%
D) 0%
Question
A new applicant, age 32, is applying for a loan. Using the table below, what is the estimated probability the loan will default using k = 3. 
A) 100%
B) 66%
C) 33%
D) 0%
A) 100%
B) 66%
C) 33%
D) 0%
Question
For a new observation of (0, 0, 0), what is the k-nearest neighbor when k = 1. 
A) 2, 0, 1
B) 1, 2, 0
C) 0, 2, 1
D) -1, 1, 0
A) 2, 0, 1
B) 1, 2, 0
C) 0, 2, 1
D) -1, 1, 0
Question
For a new observation of (0, 0, 0), what is the k-nearest neighbor when k = 1. 
A) 1, 1, 1
B) -2, -1, 0
C) 0, 1, 3
D) -1, 0, 1
A) 1, 1, 1
B) -2, -1, 0
C) 0, 1, 3
D) -1, 0, 1
Question
What is the estimated probability that the cheese sample tested in NW will be Gouda? k = 3 
A) 40%
B) 60%
C) 34%
D) 67%
A) 40%
B) 60%
C) 34%
D) 67%
Question
What is the estimated probability that the cheese sample tested in NW will be Gouda? k = 3 
A) 40%
B) 60%
C) 34%
D) 67%
A) 40%
B) 60%
C) 34%
D) 67%
Question
A new applicant, age 45, is applying for a loan. Using the table below, what is the estimated probability the loan will be approved? k = 4. 
A) The probable default rate is 50%, the loan will be declined.
B) The probable success rate is 50%, the loan will be approved.
C) The probable success rate is 30%, the loan will be approved.
D) The probable default rate is 25%, the loan will be declined.
A) The probable default rate is 50%, the loan will be declined.
B) The probable success rate is 50%, the loan will be approved.
C) The probable success rate is 30%, the loan will be approved.
D) The probable default rate is 25%, the loan will be declined.
Question
A new applicant, age 45, is applying for a loan. Using the table below, what is the estimated probability the loan will be approved? k = 4. 
A) The probable default rate is 75%, the loan will be declined.
B) The probable success rate is 75%, the loan will be approved.
C) The probable success rate is 30%, the loan will be approved.
D) The probable default rate is 25%, the loan will be declined.
A) The probable default rate is 75%, the loan will be declined.
B) The probable success rate is 75%, the loan will be approved.
C) The probable success rate is 30%, the loan will be approved.
D) The probable default rate is 25%, the loan will be declined.
Question
Using the following table, which k should be used in the subsequent calculations? 
A) 8
B) 5
C) 6
D) None of the percentages should be used.
A) 8
B) 5
C) 6
D) None of the percentages should be used.
Question
Using the following table, which k should be used in the subsequent calculations? 
A) 8
B) 5
C) 6
D) None of the percentages should be used.
A) 8
B) 5
C) 6
D) None of the percentages should be used.
Question
Question
Question
What is the Euclidean distance between Observation 1 and the origin point of (0, 0, 0)? 
A) 3
B) 1
C) 0
D) 2
A) 3
B) 1
C) 0
D) 2
Question
What is the Euclidean distance between Observation 1 and the origin point of (0, 0, 0)? 
A) 2
B) 1
C) 0
D) 3
A) 2
B) 1
C) 0
D) 3
Question
The chart below is a summary of the main results of a test data set representing the population observed purchasing a virtual digital assistant. What does the accuracy rate indicate? 
A) 85.6% of the population has purchased a virtual assistant.
B) 60% of the observations are correctly classified.
C) 85.6% of the observations are correctly classified.
D) 14.4% of the observations are correctly classified.
A) 85.6% of the population has purchased a virtual assistant.
B) 60% of the observations are correctly classified.
C) 85.6% of the observations are correctly classified.
D) 14.4% of the observations are correctly classified.
Question
The chart below is a summary of the main results of a test data set representing the population observed purchasing a virtual digital assistant. What does the accuracy rate indicate? 
A) 88.5% of the population has purchased a virtual assistant.
B) 90% of the observations are correctly classified.
C) 88.5% of the observations are correctly classified.
D) 11.5% of the observations are correctly classified.
A) 88.5% of the population has purchased a virtual assistant.
B) 90% of the observations are correctly classified.
C) 88.5% of the observations are correctly classified.
D) 11.5% of the observations are correctly classified.
Question
The chart below is a summary of the main results of a test data set representing the population observed purchasing a virtual digital assistant. What is the percent of the results that are incorrectly classified? 
A) 11%
B) 8%
C) 12.05%
D) 10.70%
A) 11%
B) 8%
C) 12.05%
D) 10.70%
Question
The chart below is a summary of the main results of a test data set representing the population observed purchasing a virtual digital assistant. What is the percent of the results that are incorrectly classified? 
A) 12%
B) 10%
C) 12.85%
D) 11.5%
A) 12%
B) 10%
C) 12.85%
D) 11.5%
Question
Question
Question
Question
Question
The following table is the count of observations in each class of the training data set on approvals and declines for a loan at a local bank. Using the naïve Bayes method, calculate the conditional probability of both the male and female being approved (declined) for the loan and indicate which one should be categorized with approved classification? 
A) 0.56 > 0.44 for male; 0.301 < 0.699 for female, providing male with the approved classification.
B) 0.56 > 0.44 for male; 0.40 < 0.60 for female, providing male with the approved classification.
C) 0.301 < 0.699 for male; 0.56 > 0.44 for female, providing female with the approved classification.
D) 0.301 < 0.699 for male; 0.50 >= 0.50 for female, providing female with the approved classification.
Question
The following table is the count of observations in each class of the training data set on approvals and declines for a loan at a local bank. Using the naïve Bayes method, calculate the conditional probability of both the male and female being approved (declined) for the loan and indicate which one should be categorized with approved classification? 
A) 0.57 > 0.43 for male; 0.333 < 0.667 for female, providing male with the approved classification.
B) 0.57 > 0.43 for male; 0.40 < 0.60 for female, providing male with the approved classification.
C) 0.333 < 0.667 for male; 0.57 > 0.43 for female, providing female with the approved classification.
D) 0.333 < 0.667 for male; 0.50 >= 0.50 for female, providing female with the approved classification.
Question
Question
The following table reflects the observations made on the color and type of vehicle, if a speeding ticket was received (1) or a warning (0), and if there was a prior driving violation (yes or no). Using the naïve Bayes calculation, what is the conditional probability of receiving a ticket with a red vehicle. 
A) 0.76
B) 0.41
C) 0.28
D) 0.63
A) 0.76
B) 0.41
C) 0.28
D) 0.63
Question
The following table reflects the observations made on the color and type of vehicle, if a speeding ticket was received (1) or a warning (0), and if there was a prior driving violation (yes or no). Using the naïve Bayes calculation, what is the conditional probability of receiving a ticket with a red vehicle. 
A) 0.88
B) 0.53
C) 0.40
D) 0.75
A) 0.88
B) 0.53
C) 0.40
D) 0.75
Question
An R's ROC curve with AUC = 0.9453 is presented below from an analysis on potential increased membership level from current basic members at Costco Wholesale. What does the AUC indicate on the prediction on increased membership enrollment among current base members? 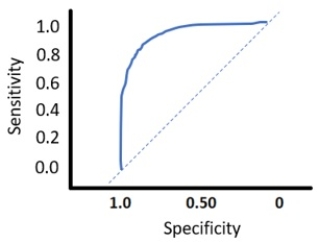
A) The high AUC indicates an anomaly in that it requires data smoothing to match the baseline.
B) The high AUC indicates the KNN model performs well and better than the baseline model.
C) The high AUC indicates the KNN model is not predicting the level increase based on the baseline model.
D) The high AUC indicates there is a 0.05% probability the KNN model performs as predicted.
Question
The marketing group and Rings Are Us is trying to predict if undergraduate or graduate students are more inclined to purchase (y = 1) or not purchase (y = 0) a class ring at graduation. Using the following count on the training data set, calculate the conditional probability of both to determine which should be classified to the purchase group. 
A) Undergraduate 0.7 > 0.272; Graduate 0.428 < 0.272. The undergraduate is assigned to the purchaser group.
B) Undergraduate 0.7 > 0.3; Graduate 0.486 < 0.514. The undergraduate is assigned to the purchaser group.
C) Undergraduate 0.303 > 0.272; Graduate 0.476 < 0.524. The undergraduate is assigned to the purchaser group.
D) Undergraduate 0.30 < 0.20; Graduate 0.524 > 0.476. The graduate is assigned to the purchaser group.
Question
The marketing group and Rings Are Us is trying to predict if undergraduate or graduate students are more inclined to purchase (y = 1) or not purchase (y = 0) a class ring at graduation. Using the following count on the training data set, calculate the conditional probability of both to determine which should be classified to the purchase group. 
A) Undergraduate 0.70 > 0.272; Graduate 0.428 < 0.272. The undergraduate is assigned to the purchaser group.
B) Undergraduate 0.70 > 0.30; Graduate 0.476 < 0.524. The undergraduate is assigned to the purchaser group.
C) Undergraduate 0.303 > 0.272; Graduate 0.476 < 0.524. The undergraduate is assigned to the purchaser group.
D) Undergraduate 0.30 < 0.20; Graduate 0.524 > 0.476. The graduate is assigned to the purchaser group.
Question
Question
Question
Question
Question
Question
Using the following table, what is the estimate of P(Color) = Black and what is the smoothed estimate of P(Color). k = 1. 
A) P(Color = Black) = 0.30 and Smoothed 0.471
B) P(Color = Black) = 0.30 and Smoothed 0.380
C) P(Color = Black) = 0.7 and Smoothed 0.471
D) P(Color = Black) = 0.40 and Smoothed 0.471
A) P(Color = Black) = 0.30 and Smoothed 0.471
B) P(Color = Black) = 0.30 and Smoothed 0.380
C) P(Color = Black) = 0.7 and Smoothed 0.471
D) P(Color = Black) = 0.40 and Smoothed 0.471
Question
Using the following table, what is the estimate of P(Color) = Black and what is the smoothed estimate of P(Color). k = 1. 
A) P(Color = Black) = 0.70 and Smoothed 0.471
B) P(Color = Black) = 0.30 and Smoothed 0.380
C) P(Color = Black) = 0.30 and Smoothed 0.308
D) P(Color = Black) = 0.30 and Smoothed 0.471
A) P(Color = Black) = 0.70 and Smoothed 0.471
B) P(Color = Black) = 0.30 and Smoothed 0.380
C) P(Color = Black) = 0.30 and Smoothed 0.308
D) P(Color = Black) = 0.30 and Smoothed 0.471
Question
In a decile-wise lift chart, what does the lift value of the leftmost bar imply? 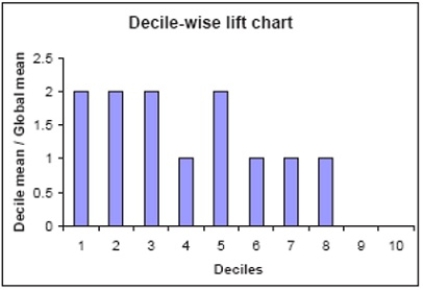
A) The lift value is determined by the smoothing of the data.
B) The first 10% yields twice as many as a random selection of 10% would.
C) The bar represents 10% of the data cumulative score.
D) The first 10% is twice as prevalent as 20%.
A) The lift value is determined by the smoothing of the data.
B) The first 10% yields twice as many as a random selection of 10% would.
C) The bar represents 10% of the data cumulative score.
D) The first 10% is twice as prevalent as 20%.
Question
Question
What is the Euclidean distance between Observation 2 and the origin point of (0, 0, 0)? 
A) 0
B) 2
C) 5
D) 3
A) 0
B) 2
C) 5
D) 3
Question
Using the following table of the results of a paper towel study and selection, the XYZ company is making a new product with Durability = 3 and Feel = 4. Using the Euclidean distance, which Type is closest to the new observation? 
A) Type 2
B) Type 1
C) Type 4
D) Type 3
A) Type 2
B) Type 1
C) Type 4
D) Type 3
Question
Using the following table of the results of a paper towel study and selection, the XYZ company is making a new product with Durability = 3 and Feel = 4. What is the k-nearest neighbors when k = 2? 
A) Types 2 & 4
B) Types 1 & 4
C) Types 2 & 3
D) Types 3 & 4
A) Types 2 & 4
B) Types 1 & 4
C) Types 2 & 3
D) Types 3 & 4
Question
Question
Question
Question
Question
Question
Question
Question
Question
Question

Unlock Deck
Sign up to unlock the cards in this deck!
Unlock Deck
Unlock Deck
1/54
Play
Full screen (f)
Deck 9: Supervised Data Mining: K-Nearest Neighbors and Naãve Bayes
1
Using the table below, find the k-nearest neighbor for record 4 using k = 3 for age.
A) 24, 30, & 36
B) 30, 36, & 44
C) 30, 32, & 36
D) 32, 36, & 44
A) 24, 30, & 36
B) 30, 36, & 44
C) 30, 32, & 36
D) 32, 36, & 44
24, 30, & 36
2
Using the table below, find the k-nearest neighbor for record 4 using k = 3 for age.
A) 24, 31, & 34
B) 31, 34, & 44
C) 31, 32, & 34
D) 32, 34, & 44
A) 24, 31, & 34
B) 31, 34, & 44
C) 31, 32, & 34
D) 32, 34, & 44
24, 31, & 34
3
A new applicant, age 32, is applying for a loan. Using the table below, what is the estimated probability the loan will default using k = 3.
A) 100%
B) 33%
C) 67%
D) 0%
A) 100%
B) 33%
C) 67%
D) 0%
67%
4
A new applicant, age 32, is applying for a loan. Using the table below, what is the estimated probability the loan will default using k = 3.
A) 100%
B) 66%
C) 33%
D) 0%
A) 100%
B) 66%
C) 33%
D) 0%
Unlock Deck
Unlock for access to all 54 flashcards in this deck.
Unlock Deck
k this deck
5
For a new observation of (0, 0, 0), what is the k-nearest neighbor when k = 1.
A) 2, 0, 1
B) 1, 2, 0
C) 0, 2, 1
D) -1, 1, 0
A) 2, 0, 1
B) 1, 2, 0
C) 0, 2, 1
D) -1, 1, 0
Unlock Deck
Unlock for access to all 54 flashcards in this deck.
Unlock Deck
k this deck
6
For a new observation of (0, 0, 0), what is the k-nearest neighbor when k = 1.
A) 1, 1, 1
B) -2, -1, 0
C) 0, 1, 3
D) -1, 0, 1
A) 1, 1, 1
B) -2, -1, 0
C) 0, 1, 3
D) -1, 0, 1
Unlock Deck
Unlock for access to all 54 flashcards in this deck.
Unlock Deck
k this deck
7
What is the estimated probability that the cheese sample tested in NW will be Gouda? k = 3
A) 40%
B) 60%
C) 34%
D) 67%
A) 40%
B) 60%
C) 34%
D) 67%
Unlock Deck
Unlock for access to all 54 flashcards in this deck.
Unlock Deck
k this deck
8
What is the estimated probability that the cheese sample tested in NW will be Gouda? k = 3
A) 40%
B) 60%
C) 34%
D) 67%
A) 40%
B) 60%
C) 34%
D) 67%
Unlock Deck
Unlock for access to all 54 flashcards in this deck.
Unlock Deck
k this deck
9
A new applicant, age 45, is applying for a loan. Using the table below, what is the estimated probability the loan will be approved? k = 4.
A) The probable default rate is 50%, the loan will be declined.
B) The probable success rate is 50%, the loan will be approved.
C) The probable success rate is 30%, the loan will be approved.
D) The probable default rate is 25%, the loan will be declined.
A) The probable default rate is 50%, the loan will be declined.
B) The probable success rate is 50%, the loan will be approved.
C) The probable success rate is 30%, the loan will be approved.
D) The probable default rate is 25%, the loan will be declined.
Unlock Deck
Unlock for access to all 54 flashcards in this deck.
Unlock Deck
k this deck
10
A new applicant, age 45, is applying for a loan. Using the table below, what is the estimated probability the loan will be approved? k = 4.
A) The probable default rate is 75%, the loan will be declined.
B) The probable success rate is 75%, the loan will be approved.
C) The probable success rate is 30%, the loan will be approved.
D) The probable default rate is 25%, the loan will be declined.
A) The probable default rate is 75%, the loan will be declined.
B) The probable success rate is 75%, the loan will be approved.
C) The probable success rate is 30%, the loan will be approved.
D) The probable default rate is 25%, the loan will be declined.
Unlock Deck
Unlock for access to all 54 flashcards in this deck.
Unlock Deck
k this deck
11
Using the following table, which k should be used in the subsequent calculations?
A) 8
B) 5
C) 6
D) None of the percentages should be used.
A) 8
B) 5
C) 6
D) None of the percentages should be used.
Unlock Deck
Unlock for access to all 54 flashcards in this deck.
Unlock Deck
k this deck
12
Using the following table, which k should be used in the subsequent calculations?
A) 8
B) 5
C) 6
D) None of the percentages should be used.
A) 8
B) 5
C) 6
D) None of the percentages should be used.
Unlock Deck
Unlock for access to all 54 flashcards in this deck.
Unlock Deck
k this deck
13
If the performance measures from the training data are considerably higher than the values from the validation and test data, what could be the issue?
A) Proportion
B) Sensitivity
C) Duplication
D) Overfitting
A) Proportion
B) Sensitivity
C) Duplication
D) Overfitting
Unlock Deck
Unlock for access to all 54 flashcards in this deck.
Unlock Deck
k this deck
14
An issue with the naïve Bayes classifier is determining rare outcomes because the estimate is 0. To overcome this problem, the algorithm allows a replacement of zero probability with a nonzero value. This technique is called
A) replacement.
B) smoothing.
C) discrete.
D) combinations.
A) replacement.
B) smoothing.
C) discrete.
D) combinations.
Unlock Deck
Unlock for access to all 54 flashcards in this deck.
Unlock Deck
k this deck
15
What is the Euclidean distance between Observation 1 and the origin point of (0, 0, 0)?
A) 3
B) 1
C) 0
D) 2
A) 3
B) 1
C) 0
D) 2
Unlock Deck
Unlock for access to all 54 flashcards in this deck.
Unlock Deck
k this deck
16
What is the Euclidean distance between Observation 1 and the origin point of (0, 0, 0)?
A) 2
B) 1
C) 0
D) 3
A) 2
B) 1
C) 0
D) 3
Unlock Deck
Unlock for access to all 54 flashcards in this deck.
Unlock Deck
k this deck
17
The chart below is a summary of the main results of a test data set representing the population observed purchasing a virtual digital assistant. What does the accuracy rate indicate?
A) 85.6% of the population has purchased a virtual assistant.
B) 60% of the observations are correctly classified.
C) 85.6% of the observations are correctly classified.
D) 14.4% of the observations are correctly classified.
A) 85.6% of the population has purchased a virtual assistant.
B) 60% of the observations are correctly classified.
C) 85.6% of the observations are correctly classified.
D) 14.4% of the observations are correctly classified.
Unlock Deck
Unlock for access to all 54 flashcards in this deck.
Unlock Deck
k this deck
18
The chart below is a summary of the main results of a test data set representing the population observed purchasing a virtual digital assistant. What does the accuracy rate indicate?
A) 88.5% of the population has purchased a virtual assistant.
B) 90% of the observations are correctly classified.
C) 88.5% of the observations are correctly classified.
D) 11.5% of the observations are correctly classified.
A) 88.5% of the population has purchased a virtual assistant.
B) 90% of the observations are correctly classified.
C) 88.5% of the observations are correctly classified.
D) 11.5% of the observations are correctly classified.
Unlock Deck
Unlock for access to all 54 flashcards in this deck.
Unlock Deck
k this deck
19
The chart below is a summary of the main results of a test data set representing the population observed purchasing a virtual digital assistant. What is the percent of the results that are incorrectly classified?
A) 11%
B) 8%
C) 12.05%
D) 10.70%
A) 11%
B) 8%
C) 12.05%
D) 10.70%
Unlock Deck
Unlock for access to all 54 flashcards in this deck.
Unlock Deck
k this deck
20
The chart below is a summary of the main results of a test data set representing the population observed purchasing a virtual digital assistant. What is the percent of the results that are incorrectly classified?
A) 12%
B) 10%
C) 12.85%
D) 11.5%
A) 12%
B) 10%
C) 12.85%
D) 11.5%
Unlock Deck
Unlock for access to all 54 flashcards in this deck.
Unlock Deck
k this deck
21
Marta is partitioning her data set into 60% for training and 40% for validation. She is first specifying 'Member' as her target variable. What will she need to program to ensure consistency to fix a random seed?
A) myIndex
B) trainSet
C) createDataPartition
D) set.seed
A) myIndex
B) trainSet
C) createDataPartition
D) set.seed
Unlock Deck
Unlock for access to all 54 flashcards in this deck.
Unlock Deck
k this deck
22
Which chart allows for the categorization of large data sets from high to low values, dividing sets of observations into an easy visual representation of the data.
A) Decile-wise chart
B) Cumulative lift chart
C) Scatterplot
D) ROC Curve
A) Decile-wise chart
B) Cumulative lift chart
C) Scatterplot
D) ROC Curve
Unlock Deck
Unlock for access to all 54 flashcards in this deck.
Unlock Deck
k this deck
23
This chart measures the effectiveness of a predictive model, containing both a baseline and a lift curve.
A) Decile-wise chart
B) Cumulative lift chart
C) Scatterplot
D) ROC Curve
A) Decile-wise chart
B) Cumulative lift chart
C) Scatterplot
D) ROC Curve
Unlock Deck
Unlock for access to all 54 flashcards in this deck.
Unlock Deck
k this deck
24
This chart determines how well the model performs in terms of sensitivity and specificity.
A) Decile-wise chart
B) Cumulative lift chart
C) Scatterplot
D) ROC Curve
A) Decile-wise chart
B) Cumulative lift chart
C) Scatterplot
D) ROC Curve
Unlock Deck
Unlock for access to all 54 flashcards in this deck.
Unlock Deck
k this deck
25
The following table is the count of observations in each class of the training data set on approvals and declines for a loan at a local bank. Using the naïve Bayes method, calculate the conditional probability of both the male and female being approved (declined) for the loan and indicate which one should be categorized with approved classification?
A) 0.56 > 0.44 for male; 0.301 < 0.699 for female, providing male with the approved classification.
B) 0.56 > 0.44 for male; 0.40 < 0.60 for female, providing male with the approved classification.
C) 0.301 < 0.699 for male; 0.56 > 0.44 for female, providing female with the approved classification.
D) 0.301 < 0.699 for male; 0.50 >= 0.50 for female, providing female with the approved classification.
Unlock Deck
Unlock for access to all 54 flashcards in this deck.
Unlock Deck
k this deck
26
The following table is the count of observations in each class of the training data set on approvals and declines for a loan at a local bank. Using the naïve Bayes method, calculate the conditional probability of both the male and female being approved (declined) for the loan and indicate which one should be categorized with approved classification?
A) 0.57 > 0.43 for male; 0.333 < 0.667 for female, providing male with the approved classification.
B) 0.57 > 0.43 for male; 0.40 < 0.60 for female, providing male with the approved classification.
C) 0.333 < 0.667 for male; 0.57 > 0.43 for female, providing female with the approved classification.
D) 0.333 < 0.667 for male; 0.50 >= 0.50 for female, providing female with the approved classification.
Unlock Deck
Unlock for access to all 54 flashcards in this deck.
Unlock Deck
k this deck
27
A researcher is preparing data for a k-fold cross-validation. The number of groups the sample data is to be split into is 10. What would k equal in a 10-fold cross-validation?
A) k = 1
B) k = 5
C) k = 10
D) k cannot be determined until applied to a machine model.
A) k = 1
B) k = 5
C) k = 10
D) k cannot be determined until applied to a machine model.
Unlock Deck
Unlock for access to all 54 flashcards in this deck.
Unlock Deck
k this deck
28
The following table reflects the observations made on the color and type of vehicle, if a speeding ticket was received (1) or a warning (0), and if there was a prior driving violation (yes or no). Using the naïve Bayes calculation, what is the conditional probability of receiving a ticket with a red vehicle.
A) 0.76
B) 0.41
C) 0.28
D) 0.63
A) 0.76
B) 0.41
C) 0.28
D) 0.63
Unlock Deck
Unlock for access to all 54 flashcards in this deck.
Unlock Deck
k this deck
29
The following table reflects the observations made on the color and type of vehicle, if a speeding ticket was received (1) or a warning (0), and if there was a prior driving violation (yes or no). Using the naïve Bayes calculation, what is the conditional probability of receiving a ticket with a red vehicle.
A) 0.88
B) 0.53
C) 0.40
D) 0.75
A) 0.88
B) 0.53
C) 0.40
D) 0.75
Unlock Deck
Unlock for access to all 54 flashcards in this deck.
Unlock Deck
k this deck
30
An R's ROC curve with AUC = 0.9453 is presented below from an analysis on potential increased membership level from current basic members at Costco Wholesale. What does the AUC indicate on the prediction on increased membership enrollment among current base members?
A) The high AUC indicates an anomaly in that it requires data smoothing to match the baseline.
B) The high AUC indicates the KNN model performs well and better than the baseline model.
C) The high AUC indicates the KNN model is not predicting the level increase based on the baseline model.
D) The high AUC indicates there is a 0.05% probability the KNN model performs as predicted.
Unlock Deck
Unlock for access to all 54 flashcards in this deck.
Unlock Deck
k this deck
31
The marketing group and Rings Are Us is trying to predict if undergraduate or graduate students are more inclined to purchase (y = 1) or not purchase (y = 0) a class ring at graduation. Using the following count on the training data set, calculate the conditional probability of both to determine which should be classified to the purchase group.
A) Undergraduate 0.7 > 0.272; Graduate 0.428 < 0.272. The undergraduate is assigned to the purchaser group.
B) Undergraduate 0.7 > 0.3; Graduate 0.486 < 0.514. The undergraduate is assigned to the purchaser group.
C) Undergraduate 0.303 > 0.272; Graduate 0.476 < 0.524. The undergraduate is assigned to the purchaser group.
D) Undergraduate 0.30 < 0.20; Graduate 0.524 > 0.476. The graduate is assigned to the purchaser group.
Unlock Deck
Unlock for access to all 54 flashcards in this deck.
Unlock Deck
k this deck
32
The marketing group and Rings Are Us is trying to predict if undergraduate or graduate students are more inclined to purchase (y = 1) or not purchase (y = 0) a class ring at graduation. Using the following count on the training data set, calculate the conditional probability of both to determine which should be classified to the purchase group.
A) Undergraduate 0.70 > 0.272; Graduate 0.428 < 0.272. The undergraduate is assigned to the purchaser group.
B) Undergraduate 0.70 > 0.30; Graduate 0.476 < 0.524. The undergraduate is assigned to the purchaser group.
C) Undergraduate 0.303 > 0.272; Graduate 0.476 < 0.524. The undergraduate is assigned to the purchaser group.
D) Undergraduate 0.30 < 0.20; Graduate 0.524 > 0.476. The graduate is assigned to the purchaser group.
Unlock Deck
Unlock for access to all 54 flashcards in this deck.
Unlock Deck
k this deck
33
Specificity is
A) TP ÷ (TP + FN).
B) TN ÷ (TN + FP).
C) TP ÷ (TN + FP).
D) 1 − TN ÷ (TN + FP).
A) TP ÷ (TP + FN).
B) TN ÷ (TN + FP).
C) TP ÷ (TN + FP).
D) 1 − TN ÷ (TN + FP).
Unlock Deck
Unlock for access to all 54 flashcards in this deck.
Unlock Deck
k this deck
34
To examine classification for k-fold cross-validation and naïve Bayes, two packages contain the necessary functions for partitioning the data. These are
A) caret & klaR
B) caret & Crisp
C) klarR & SEMMA
D) predictive & caret
A) caret & klaR
B) caret & Crisp
C) klarR & SEMMA
D) predictive & caret
Unlock Deck
Unlock for access to all 54 flashcards in this deck.
Unlock Deck
k this deck
35
Mark is reviewing a partial summary of results from a test data set on a small health clinic. With an accuracy 84% (100 count), Sensitivity 55%, and Specificity 100%, can Mark correctly predict the true positive rate to identify those with the flu?
A) Yes, because the specificity is 100% identifying healthy patients.
B) No, because the test set identified all patients with the flu.
C) No, because the sensitivity rate is only 55% in identifying those with the flu.
D) Yes, because there is a 84% accuracy rate with all healthy identified.
A) Yes, because the specificity is 100% identifying healthy patients.
B) No, because the test set identified all patients with the flu.
C) No, because the sensitivity rate is only 55% in identifying those with the flu.
D) Yes, because there is a 84% accuracy rate with all healthy identified.
Unlock Deck
Unlock for access to all 54 flashcards in this deck.
Unlock Deck
k this deck
36
Mark is reviewing a partial summary of results from a test data set on a small health clinic. With an accuracy 75% (100 count), Sensitivity 50%, and Specificity 100%, can Mark correctly predict the true positive rate to identify those with the flu?
A) Yes, because the specificity is 100% identifying healthy patients.
B) No, because the test set identified all patients with the flu.
C) No, because the sensitivity rate is only 50% in identifying those with the flu.
D) Yes, because there is a 75% accuracy rate with all healthy identified.
A) Yes, because the specificity is 100% identifying healthy patients.
B) No, because the test set identified all patients with the flu.
C) No, because the sensitivity rate is only 50% in identifying those with the flu.
D) Yes, because there is a 75% accuracy rate with all healthy identified.
Unlock Deck
Unlock for access to all 54 flashcards in this deck.
Unlock Deck
k this deck
37
Of the following options, which does not represent the naïve Bayes method?
A) All predictor variables are categorical.
B) All predictor variables are independent.
C) Does not capture possible interactions between predictor variables.
D) Works best on a small data set.
A) All predictor variables are categorical.
B) All predictor variables are independent.
C) Does not capture possible interactions between predictor variables.
D) Works best on a small data set.
Unlock Deck
Unlock for access to all 54 flashcards in this deck.
Unlock Deck
k this deck
38
Using the following table, what is the estimate of P(Color) = Black and what is the smoothed estimate of P(Color). k = 1.
A) P(Color = Black) = 0.30 and Smoothed 0.471
B) P(Color = Black) = 0.30 and Smoothed 0.380
C) P(Color = Black) = 0.7 and Smoothed 0.471
D) P(Color = Black) = 0.40 and Smoothed 0.471
A) P(Color = Black) = 0.30 and Smoothed 0.471
B) P(Color = Black) = 0.30 and Smoothed 0.380
C) P(Color = Black) = 0.7 and Smoothed 0.471
D) P(Color = Black) = 0.40 and Smoothed 0.471
Unlock Deck
Unlock for access to all 54 flashcards in this deck.
Unlock Deck
k this deck
39
Using the following table, what is the estimate of P(Color) = Black and what is the smoothed estimate of P(Color). k = 1.
A) P(Color = Black) = 0.70 and Smoothed 0.471
B) P(Color = Black) = 0.30 and Smoothed 0.380
C) P(Color = Black) = 0.30 and Smoothed 0.308
D) P(Color = Black) = 0.30 and Smoothed 0.471
A) P(Color = Black) = 0.70 and Smoothed 0.471
B) P(Color = Black) = 0.30 and Smoothed 0.380
C) P(Color = Black) = 0.30 and Smoothed 0.308
D) P(Color = Black) = 0.30 and Smoothed 0.471
Unlock Deck
Unlock for access to all 54 flashcards in this deck.
Unlock Deck
k this deck
40
In a decile-wise lift chart, what does the lift value of the leftmost bar imply?
A) The lift value is determined by the smoothing of the data.
B) The first 10% yields twice as many as a random selection of 10% would.
C) The bar represents 10% of the data cumulative score.
D) The first 10% is twice as prevalent as 20%.
A) The lift value is determined by the smoothing of the data.
B) The first 10% yields twice as many as a random selection of 10% would.
C) The bar represents 10% of the data cumulative score.
D) The first 10% is twice as prevalent as 20%.
Unlock Deck
Unlock for access to all 54 flashcards in this deck.
Unlock Deck
k this deck
41
To validate the model on the validation set, Mary calibrates the output of the model to examining all possible outcomes of the prediction (true positive, true negative, false positive, false negative). One way is to use a cutoff value and use functions such as the ifelse () function. These statements are called
A) prediction.
B) set.seed.
C) reference.
D) confusionMatrix.
A) prediction.
B) set.seed.
C) reference.
D) confusionMatrix.
Unlock Deck
Unlock for access to all 54 flashcards in this deck.
Unlock Deck
k this deck
42
What is the Euclidean distance between Observation 2 and the origin point of (0, 0, 0)?
A) 0
B) 2
C) 5
D) 3
A) 0
B) 2
C) 5
D) 3
Unlock Deck
Unlock for access to all 54 flashcards in this deck.
Unlock Deck
k this deck
43
Using the following table of the results of a paper towel study and selection, the XYZ company is making a new product with Durability = 3 and Feel = 4. Using the Euclidean distance, which Type is closest to the new observation?
A) Type 2
B) Type 1
C) Type 4
D) Type 3
A) Type 2
B) Type 1
C) Type 4
D) Type 3
Unlock Deck
Unlock for access to all 54 flashcards in this deck.
Unlock Deck
k this deck
44
Using the following table of the results of a paper towel study and selection, the XYZ company is making a new product with Durability = 3 and Feel = 4. What is the k-nearest neighbors when k = 2?
A) Types 2 & 4
B) Types 1 & 4
C) Types 2 & 3
D) Types 3 & 4
A) Types 2 & 4
B) Types 1 & 4
C) Types 2 & 3
D) Types 3 & 4
Unlock Deck
Unlock for access to all 54 flashcards in this deck.
Unlock Deck
k this deck
45
The use of classifying or predicting the value to create an outcome is called scoring a record.
Unlock Deck
Unlock for access to all 54 flashcards in this deck.
Unlock Deck
k this deck
46
KNN is a simple data mining tool, known for developing personalized recommendations for many online company applications.
Unlock Deck
Unlock for access to all 54 flashcards in this deck.
Unlock Deck
k this deck
47
Naïve Bayes classifiers are relatively simple, efficient, and assume dependency among predictors.
Unlock Deck
Unlock for access to all 54 flashcards in this deck.
Unlock Deck
k this deck
48
KNN belongs to a category of mining techniques called computer-based-reasoning.
Unlock Deck
Unlock for access to all 54 flashcards in this deck.
Unlock Deck
k this deck
49
While k-nearest neighbors is effective as a classifier, it provides no information on predictor importance.
Unlock Deck
Unlock for access to all 54 flashcards in this deck.
Unlock Deck
k this deck
50
The naïve Bayes method is an unsupervised data mining technique that uses partitioning to assess model performance.
Unlock Deck
Unlock for access to all 54 flashcards in this deck.
Unlock Deck
k this deck
51
When performing a naïve Bayes analysis, all predictor variables must be categorical.
Unlock Deck
Unlock for access to all 54 flashcards in this deck.
Unlock Deck
k this deck
52
Unlike the KNN method, the naïve Bayes method does not use the validation data set to optimize model complexity.
Unlock Deck
Unlock for access to all 54 flashcards in this deck.
Unlock Deck
k this deck
53
To use the naïve Bayes method, numerical variables can be converted into discrete categories, through a process called binning, and then stored in a newly created categorical value.
Unlock Deck
Unlock for access to all 54 flashcards in this deck.
Unlock Deck
k this deck
54
Binning is a process where categorical data is transformed into numerical segments that can be appended back to the original data set to use a naïve Bayes method.
Unlock Deck
Unlock for access to all 54 flashcards in this deck.
Unlock Deck
k this deck
Unlock Deck
Unlock for access to all 54 flashcards in this deck.


