Deck 10: Supervised Data Mining: Decision Trees
Full screen (f)
Question
Question
Question
Question
Question
Question
Question
Question
Question
Question
Question
Viewing the results in the following scatterplot, for the 11 cases to the left subset (Age < 40), two belong to Class 1 and nine belong to Class 0. In the right subset (Age ? 40) three belong to Class 1 and one belong to Class 0. What is the Index score for the two subsets? 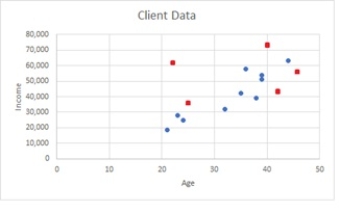
A) (Age < 40) = 0.3636; (Age 40) = 0.50
B) (Age < 40) = 0.20; (Age 40) = 0.25
C) (Age < 40) = 0.298; (Age 40) = 0.375
D) (Age < 40) = 0.375; (Age 40) = 0.298
A) (Age < 40) = 0.3636; (Age 40) = 0.50
B) (Age < 40) = 0.20; (Age 40) = 0.25
C) (Age < 40) = 0.298; (Age 40) = 0.375
D) (Age < 40) = 0.375; (Age 40) = 0.298
Question
Question
Question
A split at the $32,000 Income point creates a top and bottom partition. Compute the overall (weighted) Gini index given an Income Split of $32,000. 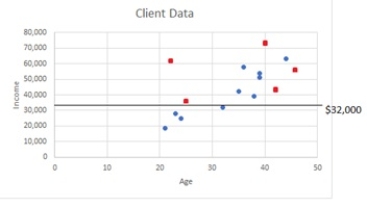
A) MSEsplit (Income=$36,000) = 0.2667
B) MSEsplit (Income=$36,000) = 0.0000
C) MSEsplit (Income=$36,000) = 0.4959
D) MSEsplit (Income=$36,000) = 0.3637
A) MSEsplit (Income=$36,000) = 0.2667
B) MSEsplit (Income=$36,000) = 0.0000
C) MSEsplit (Income=$36,000) = 0.4959
D) MSEsplit (Income=$36,000) = 0.3637
Question
Which description best fits the following tree structure for loan debt balance with a single age predictor? 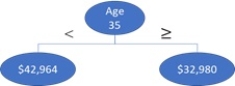
A) The split points presented represent the MSE calculated points for Age = 35.
B) The MAD of the single age predictor is $42,964 and $32,980 respectfully.
C) The MSE split for Age = 35 is between the two partitions of $42,964 and $32,980, respectfully.
D) The average loan debt balance of the two partitions are $42,964 and $32,980, respectfully, when Age = 35.
Question
Question
Question
Using the following pruning table, what does the Rel Error represent? 
A) Rel error is the calculated difference after the standard deviation is removed.
B) Rel error is the cross-validation error associated with each candidate tree.
C) Rel error is the error for predictions of the data that were used to estimate the model.
D) Rel error is the parameter associated with the candidate tree and complexity level.
Question
Using the following pruning table, which tree is the minimum error tree? 
A) Level 3
B) Level 2
C) Level 1
D) Additional Levels needed to identify minimum tree among candidate trees.
A) Level 3
B) Level 2
C) Level 1
D) Additional Levels needed to identify minimum tree among candidate trees.
Question
Using the following chart for age and income, determine the split points for income. 
A) {33000, 36000, 41000, 47000, 51500, 57500, 63000}
B) {33000, 41000, 47000, 51500, 63000}
C) {36000, 47000, 57500, 63000}
D) {36000, 41000, 47000, 51500, 57500}
A) {33000, 36000, 41000, 47000, 51500, 57500, 63000}
B) {33000, 41000, 47000, 51500, 63000}
C) {36000, 47000, 57500, 63000}
D) {36000, 41000, 47000, 51500, 57500}
Question
Using the following chart for age and income, determine the split points for income. 
A) {33000, 36000, 41000, 47000, 52500, 58500, 63,000}
B) {33000, 41000, 47000, 52500, 63000}
C) {36000, 47000, 58500, 63000}
D) {36000, 41000, 47000, 52500, 58500}
A) {33000, 36000, 41000, 47000, 52500, 58500, 63,000}
B) {33000, 41000, 47000, 52500, 63000}
C) {36000, 47000, 58500, 63000}
D) {36000, 41000, 47000, 52500, 58500}
Question
Question
Question
Question
Question
Question
Question
Using the following sample of a regression prune log, the minimum error tree is decision node # 19 with a standard error of 4.689492 (not shown). Using the information provided, which decision node number represents the best-pruned tree? 
A) decision node #21
B) decision node #5
C) decision node #4
D) decision node #17
A) decision node #21
B) decision node #5
C) decision node #4
D) decision node #17
Question
The following table reflects a partial Analytic Solver's Performance measure for a hotel cost during an NFL game night. What is the MAD implying? 
A) The predicted mean absolute deviation is 0.53 of the mean absolute percentage error.
B) The predicted cost is relatively low, providing the need for full tree.
C) The predicted average cost is lesser than the standard error, thus impure.
D) The predicted cost on average differs from the actual cost by $52.56.
Question
The following table reflects a partial Analytic Solver's Performance measure for a hotel cost during an NFL game night. What is the MAD implying? 
A) The predicted mean absolute deviation is 0.51 of the mean absolute percentage error.
B) The predicted cost is relatively low, providing the need for full tree.
C) The predicted average cost is lesser than the standard error, thus impure.
D) The predicted cost on average differs from the actual cost by $50.56.
Question
Question
Using the following pruning table, which tree is the best-pruned tree? 
A) Level 3
B) Level 2
C) Level 1
D) Additional Levels needed to identify best-pruned tree.
A) Level 3
B) Level 2
C) Level 1
D) Additional Levels needed to identify best-pruned tree.
Question
Question
Question
Question
Question
Question
Question
Question
In the following tree, how many leaf nodes are there? 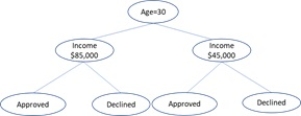
A) six
B) seven
C) two
D) four
A) six
B) seven
C) two
D) four
Question
Question
Question
Question
Question
Question
Question
Question
Question
Question
Question

Unlock Deck
Sign up to unlock the cards in this deck!
Unlock Deck
Unlock Deck
1/51
Play
Full screen (f)
Deck 10: Supervised Data Mining: Decision Trees
1
When a target variable is categorical, the CART algorithm produces a __________ tree to predict the class memberships of new cases.
A) classification
B) regression
C) minimum
D) pruned
A) classification
B) regression
C) minimum
D) pruned
classification
2
Which tree is the least complex and contains the smallest validation error?
A) best-pruned tree
B) full-grown tree
C) minimum error tree
D) categorical tree
A) best-pruned tree
B) full-grown tree
C) minimum error tree
D) categorical tree
minimum error tree
3
Based on the following sorted 20 values for age, what are the possible split points?
{20, 22, 24, 26, 28, 31, 32, 34, 35, 40, 42, 43, 45, 47, 49, 51, 52, 53, 55, 57}
A) {20, 21, 23, 25, 27, 29.5, 31.5, 33, 34.5, 37.5, 41, 42.5, 44, 46, 48, 50, 51.5, 52.5, 54, 56}
B) {21, 23, 25, 27, 29.5, 31.5, 33, 34.5, 37.5, 41, 42.5, 44, 46, 48, 50, 51.5, 52.5, 54, 56, 57}
C) {0, 21, 23, 25, 27, 29.5, 31.5, 33, 34.5, 37.5, 41, 42.5, 44, 46, 48, 50, 51.5, 52.5, 54, 56}
D) {21, 23, 25, 27, 29.5, 31.5, 33, 34.5, 37.5, 41, 42.5, 44, 46, 48, 50, 51.5, 52.5, 54, 56}
{21, 23, 25, 27, 29.5, 31.5, 33, 34.5, 37.5, 41, 42.5, 44, 46, 48, 50, 51.5, 52.5, 54, 56}
4
Based on the following sorted 20 values for age, what are the possible split points?
{20, 22, 24, 26, 28, 31, 32, 33, 35, 40, 42, 43, 45, 47, 49, 50, 52, 53, 55, 57}
A) {20, 21, 23, 25, 27, 29.5, 31.5, 32.5, 34, 37.5, 41, 42.5, 44, 46, 48, 49.5, 51, 52, 54, 56}
B) {21, 23, 25, 27, 29.5, 31.5, 32.5, 34, 37.5, 41, 42.5, 44, 46, 48, 49, 51, 52.5, 54, 56, 57}
C) {0, 21, 23, 25, 27, 29.5, 31.5, 32.5, 34, 37.5, 41, 42.5, 44, 46, 48, 49, 51, 52.5, 54, 56}
D) {21, 23, 25, 27, 29.5, 31.5, 32.5, 34, 37.5, 41, 42.5, 44, 46, 48, 49.5, 51, 52.5, 54, 56}
Unlock Deck
Unlock for access to all 51 flashcards in this deck.
Unlock Deck
k this deck
5
Based on the following values for income, what are the possible split points?
{12,665, 15,432, 28,763, 34,876, 43,987, 53,677}
A) {14048.5, 22097.5, 31819.5, 39431.5, 48832, 53677}
B) {12665, 14048.5, 22097.5, 31819.5, 39431.5, 48832}
C) {14048.5, 22097.5, 31819.5, 39431.5, 48832}
D) {14048, 22097, 31819, 39431, 48832}
{12,665, 15,432, 28,763, 34,876, 43,987, 53,677}
A) {14048.5, 22097.5, 31819.5, 39431.5, 48832, 53677}
B) {12665, 14048.5, 22097.5, 31819.5, 39431.5, 48832}
C) {14048.5, 22097.5, 31819.5, 39431.5, 48832}
D) {14048, 22097, 31819, 39431, 48832}
Unlock Deck
Unlock for access to all 51 flashcards in this deck.
Unlock Deck
k this deck
6
Based on the following values for income, what are the possible split points?
{12665, 15432, 28763, 34876, 41967, 52997}
A) {14048.50, 22097.50, 31819.50, 38421.50, 47482, 52997}
B) {12665, 14048.50, 22097.50, 31819.50, 38421.50, 47482}
C) {14048.50, 22097.50, 31819.50, 38421.50, 47482}
D) {14048, 22097, 31819, 38421, 47482}
{12665, 15432, 28763, 34876, 41967, 52997}
A) {14048.50, 22097.50, 31819.50, 38421.50, 47482, 52997}
B) {12665, 14048.50, 22097.50, 31819.50, 38421.50, 47482}
C) {14048.50, 22097.50, 31819.50, 38421.50, 47482}
D) {14048, 22097, 31819, 38421, 47482}
Unlock Deck
Unlock for access to all 51 flashcards in this deck.
Unlock Deck
k this deck
7
If 73% of the cases belong to Class 0 and 27% belong to Class 1, what is the Gini index?
A) 0.39
B) 0
C) 0.54
D) 0.15
A) 0.39
B) 0
C) 0.54
D) 0.15
Unlock Deck
Unlock for access to all 51 flashcards in this deck.
Unlock Deck
k this deck
8
If 80% of the cases belong to Class 0 and 20% belong to Class 1, what is the Gini index?
A) 0.32
B) 0
C) 0.40
D) 0.16
A) 0.32
B) 0
C) 0.40
D) 0.16
Unlock Deck
Unlock for access to all 51 flashcards in this deck.
Unlock Deck
k this deck
9
In reviewing the split of data, Maggie notes among the 13 cases, 2 belong to Class 1 and the remaining to Class 0. What is the Gini index for the cases and is it pure or impure?
A) 0.00 default because it is under 0.5 and pure.
B) 0.26 is closer to 0 implying relative purity.
C) 0.24 is at the halfway point is not considered pure.
D) 0.74 is over the 0.5 level and is impure.
A) 0.00 default because it is under 0.5 and pure.
B) 0.26 is closer to 0 implying relative purity.
C) 0.24 is at the halfway point is not considered pure.
D) 0.74 is over the 0.5 level and is impure.
Unlock Deck
Unlock for access to all 51 flashcards in this deck.
Unlock Deck
k this deck
10
In reviewing the split of data, Maggie notes among the 15 cases, 2 belong to Class 1 and the remaining to Class 0. What is the Gini index for the cases and is it pure or impure?
A) 0.00 default because it is under 0.5 and pure.
B) 0.23 is closer to 0 implying relative purity.
C) 0.27 is at the halfway point is not considered pure.
D) 0.77 is over the 0.5 level and is impure.
A) 0.00 default because it is under 0.5 and pure.
B) 0.23 is closer to 0 implying relative purity.
C) 0.27 is at the halfway point is not considered pure.
D) 0.77 is over the 0.5 level and is impure.
Unlock Deck
Unlock for access to all 51 flashcards in this deck.
Unlock Deck
k this deck
11
Viewing the results in the following scatterplot, for the 11 cases to the left subset (Age < 40), two belong to Class 1 and nine belong to Class 0. In the right subset (Age ? 40) three belong to Class 1 and one belong to Class 0. What is the Index score for the two subsets?
A) (Age < 40) = 0.3636; (Age 40) = 0.50
B) (Age < 40) = 0.20; (Age 40) = 0.25
C) (Age < 40) = 0.298; (Age 40) = 0.375
D) (Age < 40) = 0.375; (Age 40) = 0.298
A) (Age < 40) = 0.3636; (Age 40) = 0.50
B) (Age < 40) = 0.20; (Age 40) = 0.25
C) (Age < 40) = 0.298; (Age 40) = 0.375
D) (Age < 40) = 0.375; (Age 40) = 0.298
Unlock Deck
Unlock for access to all 51 flashcards in this deck.
Unlock Deck
k this deck
12
Robin wanted to know if the age partition chosen for her data was the best fit for her 20 case, 90% Class 1, 10% Class 0 partition. She completed the Gini impurity index with the results of (Age < 32) = 0.2312 and (Age 32) = 0.2934. What is the weighted combination and what did partition at Age 32 produce?
A) Robin was able to reduce the Gini index from 0.2934 to 0.2641 confirming the best split for age.
B) Robin was able to reduce the Gini index from 0.2934 to 0.20 confirming the best split for age.
C) Robin was able to reduce the Gini index from 0.2934 to 0.2374 confirming the best split for age.
D) Robin realized with the 0.2641 weighted average, the age split was not the best split for the age range.
Unlock Deck
Unlock for access to all 51 flashcards in this deck.
Unlock Deck
k this deck
13
Robin wanted to know if the age partition chosen for her data was the best fit for her 30 case, 90% Class 1, 10% Class 0 partition. She completed the Gini impurity index with the results of (Age < 32) = 0.2034 and (Age 32) = 0.2786. What is the weighted combination and what did partition at Age 32 produce?
A) Robin was able to reduce the Gini index from 0.2786 to 0.2507, confirming the best split for age.
B) Robin was able to reduce the Gini index from 0.2786 to 0.20, confirming the best split for age.
C) Robin was able to reduce the Gini index from 0.2786 to 0.2109, confirming the best split for age.
D) Robin realized with the 0.2507 weighted average, the age split was not the best split for the age range.
Unlock Deck
Unlock for access to all 51 flashcards in this deck.
Unlock Deck
k this deck
14
A split at the $32,000 Income point creates a top and bottom partition. Compute the overall (weighted) Gini index given an Income Split of $32,000.
A) MSEsplit (Income=$36,000) = 0.2667
B) MSEsplit (Income=$36,000) = 0.0000
C) MSEsplit (Income=$36,000) = 0.4959
D) MSEsplit (Income=$36,000) = 0.3637
A) MSEsplit (Income=$36,000) = 0.2667
B) MSEsplit (Income=$36,000) = 0.0000
C) MSEsplit (Income=$36,000) = 0.4959
D) MSEsplit (Income=$36,000) = 0.3637
Unlock Deck
Unlock for access to all 51 flashcards in this deck.
Unlock Deck
k this deck
15
Which description best fits the following tree structure for loan debt balance with a single age predictor?
A) The split points presented represent the MSE calculated points for Age = 35.
B) The MAD of the single age predictor is $42,964 and $32,980 respectfully.
C) The MSE split for Age = 35 is between the two partitions of $42,964 and $32,980, respectfully.
D) The average loan debt balance of the two partitions are $42,964 and $32,980, respectfully, when Age = 35.
Unlock Deck
Unlock for access to all 51 flashcards in this deck.
Unlock Deck
k this deck
16
In R, to determine the number of splits in the default classification tree, the rpart function uses what to determine when to stop growing the tree?
A) nsplit
B) complexity parameter
C) prune
D) predict
A) nsplit
B) complexity parameter
C) prune
D) predict
Unlock Deck
Unlock for access to all 51 flashcards in this deck.
Unlock Deck
k this deck
17
In a R complexity parameter table, the xerror column represents:
A) the cross-validation errors associated with each candidate tree.
B) the recommended measure for the full tree.
C) the maximum error point for the first node split.
D) the root node type argument point.
A) the cross-validation errors associated with each candidate tree.
B) the recommended measure for the full tree.
C) the maximum error point for the first node split.
D) the root node type argument point.
Unlock Deck
Unlock for access to all 51 flashcards in this deck.
Unlock Deck
k this deck
18
Using the following pruning table, what does the Rel Error represent?
A) Rel error is the calculated difference after the standard deviation is removed.
B) Rel error is the cross-validation error associated with each candidate tree.
C) Rel error is the error for predictions of the data that were used to estimate the model.
D) Rel error is the parameter associated with the candidate tree and complexity level.
Unlock Deck
Unlock for access to all 51 flashcards in this deck.
Unlock Deck
k this deck
19
Using the following pruning table, which tree is the minimum error tree?
A) Level 3
B) Level 2
C) Level 1
D) Additional Levels needed to identify minimum tree among candidate trees.
A) Level 3
B) Level 2
C) Level 1
D) Additional Levels needed to identify minimum tree among candidate trees.
Unlock Deck
Unlock for access to all 51 flashcards in this deck.
Unlock Deck
k this deck
20
Using the following chart for age and income, determine the split points for income.
A) {33000, 36000, 41000, 47000, 51500, 57500, 63000}
B) {33000, 41000, 47000, 51500, 63000}
C) {36000, 47000, 57500, 63000}
D) {36000, 41000, 47000, 51500, 57500}
A) {33000, 36000, 41000, 47000, 51500, 57500, 63000}
B) {33000, 41000, 47000, 51500, 63000}
C) {36000, 47000, 57500, 63000}
D) {36000, 41000, 47000, 51500, 57500}
Unlock Deck
Unlock for access to all 51 flashcards in this deck.
Unlock Deck
k this deck
21
Using the following chart for age and income, determine the split points for income.
A) {33000, 36000, 41000, 47000, 52500, 58500, 63,000}
B) {33000, 41000, 47000, 52500, 63000}
C) {36000, 47000, 58500, 63000}
D) {36000, 41000, 47000, 52500, 58500}
A) {33000, 36000, 41000, 47000, 52500, 58500, 63,000}
B) {33000, 41000, 47000, 52500, 63000}
C) {36000, 47000, 58500, 63000}
D) {36000, 41000, 47000, 52500, 58500}
Unlock Deck
Unlock for access to all 51 flashcards in this deck.
Unlock Deck
k this deck
22
Which is not a purpose of running classification and regression trees (CART)?
A) To remove nodes that do not produce additional information
B) To simplify and reduce complexity
C) To identify the most diverse case set for the target variable
D) To reduce the chances of overfitting
A) To remove nodes that do not produce additional information
B) To simplify and reduce complexity
C) To identify the most diverse case set for the target variable
D) To reduce the chances of overfitting
Unlock Deck
Unlock for access to all 51 flashcards in this deck.
Unlock Deck
k this deck
23
If the RMSE for the validation set is 56.91 and the RMSE for the test set is 55.39, then what range will the new data RMSE lie in?
A) 55.39-56.91 range
B) 55-56 range
C) 55.39-57 range
D) 55-57 range
A) 55.39-56.91 range
B) 55-56 range
C) 55.39-57 range
D) 55-57 range
Unlock Deck
Unlock for access to all 51 flashcards in this deck.
Unlock Deck
k this deck
24
If the RMSE for the validation set is 58.78 and the RMSE for the test set is 57.12, then what range will the new data RMSE lie in?
A) 57.12-58.78 range
B) 57-58 range
C) 57.12-59 range
D) 57-59 range
A) 57.12-58.78 range
B) 57-58 range
C) 57.12-59 range
D) 57-59 range
Unlock Deck
Unlock for access to all 51 flashcards in this deck.
Unlock Deck
k this deck
25
A regression tree was developed to predict customer spending for a hotel during football season. One of the leaf nodes consists of six cases in the training set with the following values: 312.00, 350.00, 285.00, 295.00, 423.00, 249.00. What is the predicted spending amount on a hotel for the night for a customer that falls into this leaf node?
A) 319.00
B) 320.40
C) 322.50
D) 318.80
A) 319.00
B) 320.40
C) 322.50
D) 318.80
Unlock Deck
Unlock for access to all 51 flashcards in this deck.
Unlock Deck
k this deck
26
A regression tree was developed to predict customer spending for a hotel during football season. One of the leaf nodes consists of six cases in the training set with the following values: 312.00, 350.00, 285.00, 295.00, 380.00, 220.00. What is the predicted spending amount on a hotel for the night for a customer that falls into this leaf node?
A) 307.00
B) 308.40
C) 310.50
D) 306.80
A) 307.00
B) 308.40
C) 310.50
D) 306.80
Unlock Deck
Unlock for access to all 51 flashcards in this deck.
Unlock Deck
k this deck
27
When using the CART algorithm, the Gini index is used in the classification tree, however in a regression tree, _____ is used to measure impurity.
A) mean percentage error
B) mean squared error
C) mean absolute deviation
D) mean absolute percentage error
A) mean percentage error
B) mean squared error
C) mean absolute deviation
D) mean absolute percentage error
Unlock Deck
Unlock for access to all 51 flashcards in this deck.
Unlock Deck
k this deck
28
Using the following sample of a regression prune log, the minimum error tree is decision node # 19 with a standard error of 4.689492 (not shown). Using the information provided, which decision node number represents the best-pruned tree?
A) decision node #21
B) decision node #5
C) decision node #4
D) decision node #17
A) decision node #21
B) decision node #5
C) decision node #4
D) decision node #17
Unlock Deck
Unlock for access to all 51 flashcards in this deck.
Unlock Deck
k this deck
29
The following table reflects a partial Analytic Solver's Performance measure for a hotel cost during an NFL game night. What is the MAD implying?
A) The predicted mean absolute deviation is 0.53 of the mean absolute percentage error.
B) The predicted cost is relatively low, providing the need for full tree.
C) The predicted average cost is lesser than the standard error, thus impure.
D) The predicted cost on average differs from the actual cost by $52.56.
Unlock Deck
Unlock for access to all 51 flashcards in this deck.
Unlock Deck
k this deck
30
The following table reflects a partial Analytic Solver's Performance measure for a hotel cost during an NFL game night. What is the MAD implying?
A) The predicted mean absolute deviation is 0.51 of the mean absolute percentage error.
B) The predicted cost is relatively low, providing the need for full tree.
C) The predicted average cost is lesser than the standard error, thus impure.
D) The predicted cost on average differs from the actual cost by $50.56.
Unlock Deck
Unlock for access to all 51 flashcards in this deck.
Unlock Deck
k this deck
31
When generating a single regression tree visually, the prp function is used. Based on the following example code, what does setting type = 1 mean?
>prp(default_tree, type = 1, extra = 1, under = TRUE)
A) type = 1 argument is the number of observations that fall into each node displayed.
B) type = 1 argument places the number of cases under each decision node in the diagram.
C) type = 1 argument allows for all nodes, except leaf nodes, to be labeled in the diagram.
D) type = 1 argument allows for the predicting variable to be displayed in root node.
Unlock Deck
Unlock for access to all 51 flashcards in this deck.
Unlock Deck
k this deck
32
Using the following pruning table, which tree is the best-pruned tree?
A) Level 3
B) Level 2
C) Level 1
D) Additional Levels needed to identify best-pruned tree.
A) Level 3
B) Level 2
C) Level 1
D) Additional Levels needed to identify best-pruned tree.
Unlock Deck
Unlock for access to all 51 flashcards in this deck.
Unlock Deck
k this deck
33
Which option is not one of the three common strategies used in creating ensemble models?
A) bagging
B) boosting
C) bootstrapping
D) random Forest
A) bagging
B) boosting
C) bootstrapping
D) random Forest
Unlock Deck
Unlock for access to all 51 flashcards in this deck.
Unlock Deck
k this deck
34
If the performance measures are based on a cutoff value of 0.5, then if we lower the cutoff value, more cases will be in the target class, resulting in different performance measurement values. What chart can be used to review the data that are independent of the cutoff value?
A) cumulative lift chart
B) decile-wise lift chart
C) ROC curve
D) All options are independent of the cutoff value.
A) cumulative lift chart
B) decile-wise lift chart
C) ROC curve
D) All options are independent of the cutoff value.
Unlock Deck
Unlock for access to all 51 flashcards in this deck.
Unlock Deck
k this deck
35
If predictor variables are highly correlated, then repeated sampling of the training data and a random selection of features are used to construct trees. This is an example of which strategy?
A) random Forest
B) bagging
C) boosting
D) banking
A) random Forest
B) bagging
C) boosting
D) banking
Unlock Deck
Unlock for access to all 51 flashcards in this deck.
Unlock Deck
k this deck
36
In a random forest model, as a guideline the user needs to select a number of the random features for each tree. If there are 196 predictor variables in the data, each tree will randomly select how many features to be included in the tree?
A) 5
B) 18
C) 196
D) 14
A) 5
B) 18
C) 196
D) 14
Unlock Deck
Unlock for access to all 51 flashcards in this deck.
Unlock Deck
k this deck
37
In a random forest model, as a guideline the user needs to select a number of the random features for each tree. If there are 9 predictor variables in the data, each tree will randomly select how many features to be included in the tree?
A) 4
B) 1
C) 9
D) 3
A) 4
B) 1
C) 9
D) 3
Unlock Deck
Unlock for access to all 51 flashcards in this deck.
Unlock Deck
k this deck
38
When constructing the argument for a bagging tree strategy, the varImpPlot function displays feature importance graphically. For this we set the type argument to either equal 1 or 2. If type = 2, then what does this command?
A) to show the average decrease in the predictive variable mean in a percentage form
B) that R will use the average decrease in the Gini impurity index to compare the feature importance
C) to show the feature importance as the average decrease in overall accuracy
D) that R will use the average increase in the Gini impurity index to compare future importance
Unlock Deck
Unlock for access to all 51 flashcards in this deck.
Unlock Deck
k this deck
39
Ensemble tree models combine multiple single-tree models to reduce the variation in prediction error. Of the strategies, which may lead to overfitting?
A) boosting
B) random Forest
C) bagging
D) banking
A) boosting
B) random Forest
C) bagging
D) banking
Unlock Deck
Unlock for access to all 51 flashcards in this deck.
Unlock Deck
k this deck
40
In the following tree, how many leaf nodes are there?
A) six
B) seven
C) two
D) four
A) six
B) seven
C) two
D) four
Unlock Deck
Unlock for access to all 51 flashcards in this deck.
Unlock Deck
k this deck
41
A pure subset contains leaf nodes where cases have contradicting values to the target variable, to enhance the variable case outcomes and allow for further splits.
Unlock Deck
Unlock for access to all 51 flashcards in this deck.
Unlock Deck
k this deck
42
Decision trees produced by the CART algorithm are binary, meaning that there are two branches for each decision node.
Unlock Deck
Unlock for access to all 51 flashcards in this deck.
Unlock Deck
k this deck
43
The best-pruned tree is the smallest set, least complex tree, with the smallest validation error.
Unlock Deck
Unlock for access to all 51 flashcards in this deck.
Unlock Deck
k this deck
44
Small changes in the training set, while using the CART algorithm, will result in drastically different trees.
Unlock Deck
Unlock for access to all 51 flashcards in this deck.
Unlock Deck
k this deck
45
A subset with the highest degree of impurity is when a 50% and 50% split occur between classes.
Unlock Deck
Unlock for access to all 51 flashcards in this deck.
Unlock Deck
k this deck
46
Based on the Gini index, 0.10 implies a higher degree of purity because it is closer to 0 than 0.5.
Unlock Deck
Unlock for access to all 51 flashcards in this deck.
Unlock Deck
k this deck
47
In a decision tree, the recursive process of partitions continues and only terminates when the Gini index reaches 0.5.
Unlock Deck
Unlock for access to all 51 flashcards in this deck.
Unlock Deck
k this deck
48
To measure impurity in a regression tree, mean square error (MSE) is used.
Unlock Deck
Unlock for access to all 51 flashcards in this deck.
Unlock Deck
k this deck
49
The overall MSE split for Age = 24 is $21,987,111.29 and for Age = 23 is $20,983,723.40. Of the two presented, Age = 24 is slightly higher and has a lower level of impurity for constructing a regression tree.
Unlock Deck
Unlock for access to all 51 flashcards in this deck.
Unlock Deck
k this deck
50
The overall MSE split for Age = 25 is $22,987,111.29 and for Age = 23 is $21,983,723.40. Of the two presented, Age = 25 is slightly higher and has a lower level of impurity for constructing a regression tree.
Unlock Deck
Unlock for access to all 51 flashcards in this deck.
Unlock Deck
k this deck
51
Before constructing a decision tree, one of the first steps is identifying possible splits of the predictor variable.
Unlock Deck
Unlock for access to all 51 flashcards in this deck.
Unlock Deck
k this deck
Unlock Deck
Unlock for access to all 51 flashcards in this deck.


