Deck 1: Linear Functions and Change
Full screen (f)
Question
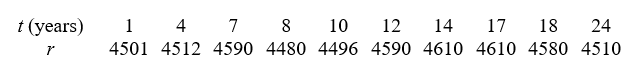
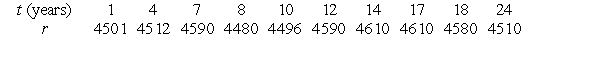
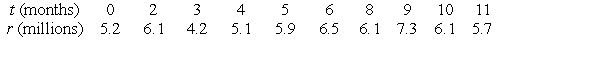
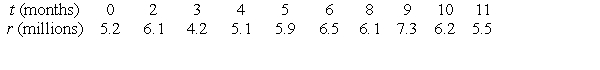
Several years ago, the wild rabbits of Australia were seriously threatened by a virus that was accidentally released into their population. Suppose that the following table gives the number r of rabbits (in millions) remaining t months after the release of the virus.
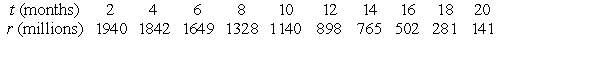 Use a calculator program to find the slope of the regression line for this data. Round to 3 decimal places.
Use a calculator program to find the slope of the regression line for this data. Round to 3 decimal places. Question
Several years ago, the wild rabbits of Australia were seriously threatened by a virus that was accidentally released into their population. Suppose that the following table gives the number r of rabbits (in millions) remaining t months after the release of the virus.
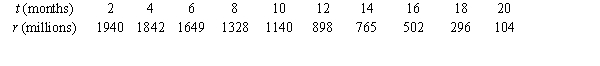
- Use a calculator program to find the regression line for this data and use this to estimate how many million rabbits were left after 15 months. Round to the nearest whole number.
- Use a calculator program to find the regression line for this data and use this to estimate how many million rabbits were left after 15 months. Round to the nearest whole number.
Question
Several years ago, the wild rabbits of Australia were seriously threatened by a virus that was accidentally released into their population. Suppose that the following table gives the number r of rabbits (in millions) remaining t months after the release of the virus.
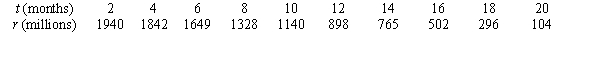
- Use a calculator program to find the regression line for this data. What is the physical interpretation of the t-intercept?
A) The decrease in the population if the virus is present an additional month.
B) The number of months the virus took to lower the population by 1 milllion.
C) The initial rabbit population when the virus was introduced.
D) The time in months at which the rabbit population falls to zero.
Question
Question
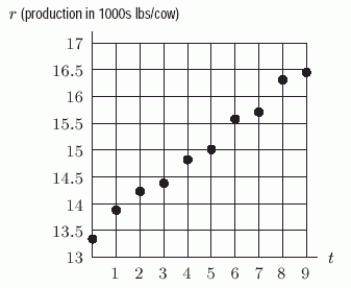
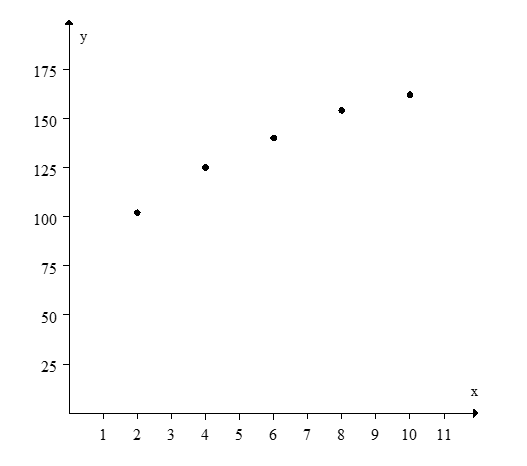
The following figure gives the annual amount of milk produced (in 1000s of pounds) per US milk cow as a function of t, the number of years since 1986. Is the regression line r = 0.34t + 13.4 reasonably correct?
Question
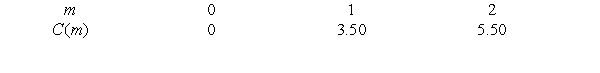
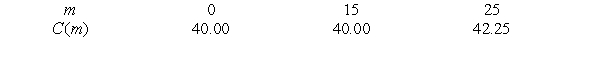
The following table shows the cost of a taxi ride, in dollars, as a function of miles traveled.
 Estimate

.
Estimate .
Question
The following table shows the cost of a taxi ride, in dollars, as a function of miles traveled.
 If
If

, estimate m to 1 decimal place.
If , estimate m to 1 decimal place.
Question
The following figure shows scatter plots with r values 0.9, 0.5, 0 ,-0.5, and -0.9. Which scatter plot has r value 0.5?
A)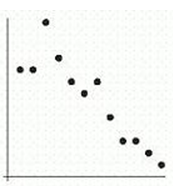
B)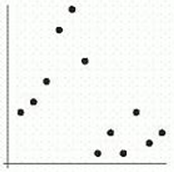
C)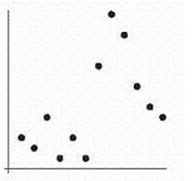
D)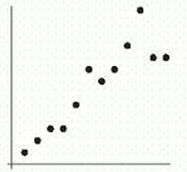
E)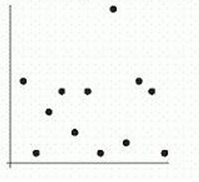
A)
B)
C)
D)
E)
Question
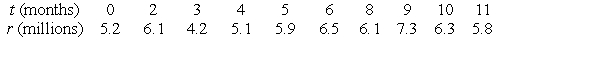
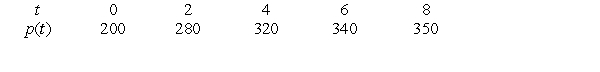
The following table gives the number P of people living in a town t years after 1990.
-
Use a calculator program to find the slope of the regression line for this data. Round to 3 decimal places.
-
Use a calculator program to find the slope of the regression line for this data. Round to 3 decimal places.
Question
The following table gives the number P of people living in a town t years after 1990.
-Use a calculator program to find the regression line for this data and use this to estimate how many lived in the year 2011. Round to the nearest whole number.
-Use a calculator program to find the regression line for this data and use this to estimate how many lived in the year 2011. Round to the nearest whole number.
Question
The following table shows the size of a cell phone bill, in dollars, as a function of the number of text messages.

- Use a calculator program to find a regression line for this data. Estimate

using the formula for the regression line.
- Use a calculator program to find a regression line for this data. Estimate
using the formula for the regression line.
Question
The following table shows the cost of a cell phone bill, in dollars, as a function of the number of texts.
 Use a calculator program to find a regression line for this data. From the formula for the regression line, estimate the value of m that satisfies

. Round up to the nearest number of texts.
Use a calculator program to find a regression line for this data. From the formula for the regression line, estimate the value of m that satisfies . Round up to the nearest number of texts.
Question
The following table gives the profits (in millions) of a manufacturing company
 months after January 1, 2008.
- Use a calculator program to find the vertical intercept of the regression line for this data. Round to 2 decimal places.
months after January 1, 2008.- Use a calculator program to find the vertical intercept of the regression line for this data. Round to 2 decimal places.
Question
The following table gives the profits (in millions) of a manufacturing company  months after January 1, 2008.

-Use a calculator program to find the regression line for this data and use this to estimate the profit on January 1, 2009. Round your
answer to one decimal place.
months after January 1, 2008. -Use a calculator program to find the regression line for this data and use this to estimate the profit on January 1, 2009. Round your
answer to one decimal place.
Question
The following tables give the profits (in millions) of a manufacturing company  months after January 1, 2008.
 Use a calculator program to find the regression line for this data. What is the physical interpretation of the t-intercept?
months after January 1, 2008. Use a calculator program to find the regression line for this data. What is the physical interpretation of the t-intercept? Question
Does an  value of 0.07 seem reasonable for the following set of data?
value of 0.07 seem reasonable for the following set of data? Question
Several years ago, the wild rabbits of Australia were seriously threatened by a virus that was accidentally released into their population. Suppose that the following table gives the number r of rabbits (in millions) remaining t months after the release of the virus.
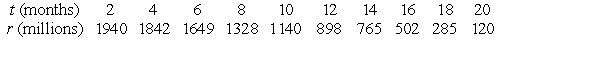 Find the regression line for this data. Round to 3 decimal places.
Find the regression line for this data. Round to 3 decimal places. Question
The following table gives the number of people P living in a town t years after 1990.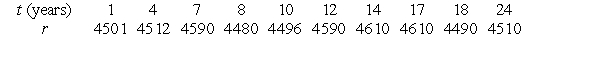 Use a calculator program to find the regression line for this data.
Use a calculator program to find the regression line for this data. Question
The following table shows the cost of a cell phone bill, in dollars, as a function of the number of texts.
 Use a calculator program to find a regression line for this data.
Use a calculator program to find a regression line for this data. Question
The following table gives the profits (in millions) of a manufacturing company  months after January 1, 2008.
 Use a calculator program to find the regression line for this data.
months after January 1, 2008. Use a calculator program to find the regression line for this data. Question
Suppose that  is linear with an x-intercept of 6 and parallel to
 . If
. If , then b = _____ and m = _____.
is linear with an x-intercept of 6 and parallel to . If , then b = _____ and m = _____. Question
Suppose that  is linear, passes through the point (-1, 3), and is parallel to
  . If
. If , then b = _____ and m = _____.
is linear, passes through the point (-1, 3), and is parallel to . If , then b = _____ and m = _____. Question
Suppose that  is linear, has slope -0.5, and forms the hypotenuse of the right triangle lying in Quadrant I whose area is 36 and whose legs lie on the x and y axes. If
  , then b = _____ and m = _____.
is linear, has slope -0.5, and forms the hypotenuse of the right triangle lying in Quadrant I whose area is 36 and whose legs lie on the x and y axes. If , then b = _____ and m = _____. Question
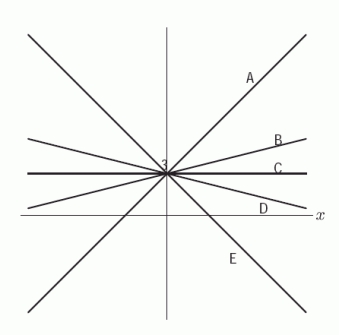
The following figure gives lines A, B, C, D, and E. Their equations are given below. Which is the equation for line E ?
A)
B)
C)
D)
E)
A)
B)
C)
D)
E)
Question
Mark all of the following functions that are increasing.
A)
B)
C)
D)
E)
F)
A)
B)
C)
D)
E)
F)
Question
Mark all of the following functions that have graphs that are parallel.
A)
B)
C)
D)
E)
F)
A)
B)
C)
D)
E)
F)
Question
Mark all of the following functions that pass through the point (0, 6).
A)
B)
C)
D)
E)
F)
A)
B)
C)
D)
E)
F)
Question
Mark all of the following functions that are neither increasing nor decreasing.
A)
B)
C)
D)
E)
F)
A)
B)
C)
D)
E)
F)
Question
Are the lines  and
and parallel, perpendicular, or neither?
and parallel, perpendicular, or neither? Question
Many economists believe that a country's inflation rate will rise if its unemployment rate falls. The following figure show the relationship between the inflation rate, I, and the unemployment rate, u, in four different countries.
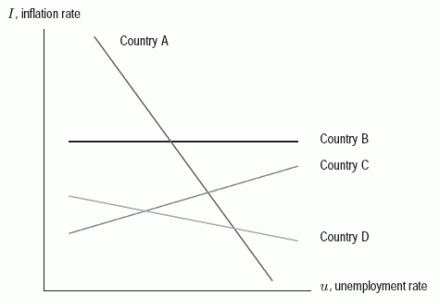 In which of the four countries does a change in the unemployment rate have no apparent effect on the inflation rate?
In which of the four countries does a change in the unemployment rate have no apparent effect on the inflation rate? Question
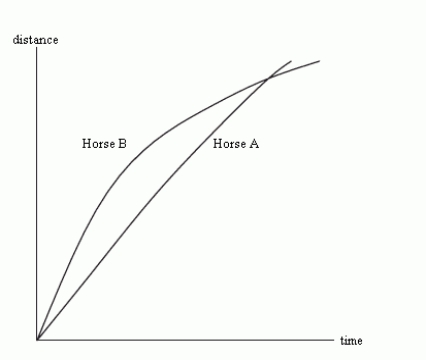
The following figure show the distance of two horses from the starting point of a race as a function of time. Which horse won the race? (Answer "A" or "B")
Question
Question
If  and
and represent the population (in millions) of two countries, A and B, then in what year will the population of country A double the population of country B? Round to 2 decimal places.
and represent the population (in millions) of two countries, A and B, then in what year will the population of country A double the population of country B? Round to 2 decimal places. Question
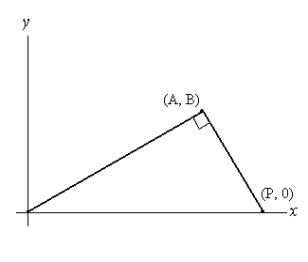
Find the vertical intercept of the line l shown n the following figure.
Question
Question
The cost, C, of producing q items is given by the formula  , where
  And m are positive constants. If the quantity produced increases, what happens to the cost of production?
A) It decreases.
B) It stays the same.
C) It increases.
D)
, where And m are positive constants. If the quantity produced increases, what happens to the cost of production?A) It decreases.
B) It stays the same.
C) It increases.
D)
Question
At a price of $2.55 per gallon, the average weekly demand by consumers for gasoline is 43 gallons. If the price rises to $2.75, the weekly demand drops to 41 gallons. Assuming demand is linear, let
 , where Q is the weekly quantity of gasoline demanded and p is the price per gallon. What is the slope m, along with its economic significance?
A) -0.40; if gasoline prices increase by $1 per gallon, then there will be a 0.40 gallon decrease in weekly demand.
B) -2; if gasoline prices increase by $1 per gallon, then there will be a 2 gallon decrease in weekly demand.
C) -10; if gasoline prices increase by $1 per gallon, then there will be a 10 gallon decrease in weekly demand.
D) -0.20; if gasoline prices increase by $1 per gallon, then there will be a 0.20 gallon decrease in weekly demand.
, where Q is the weekly quantity of gasoline demanded and p is the price per gallon. What is the slope m, along with its economic significance?A) -0.40; if gasoline prices increase by $1 per gallon, then there will be a 0.40 gallon decrease in weekly demand.
B) -2; if gasoline prices increase by $1 per gallon, then there will be a 2 gallon decrease in weekly demand.
C) -10; if gasoline prices increase by $1 per gallon, then there will be a 10 gallon decrease in weekly demand.
D) -0.20; if gasoline prices increase by $1 per gallon, then there will be a 0.20 gallon decrease in weekly demand.
Question
At a price of $3.00 per gallon, the average weekly demand by consumers for gasoline is 40 gallons. If the price rises to $3.05, the weekly demand drops to 35 gallons. Assuming demand is linear, let
 , where Q is the weekly quantity of gasoline demanded and p is the price per gallon. What is the economic interpretation of the Q-intercept?
A) The number of gallons demanded if gas were free.
B) The the price at which no gasoline will be demanded.
C) The amount the demand decreases if the price rises $1.
D) The amount the price decreases if the demand is increased by 1 gallon.
, where Q is the weekly quantity of gasoline demanded and p is the price per gallon. What is the economic interpretation of the Q-intercept?A) The number of gallons demanded if gas were free.
B) The the price at which no gasoline will be demanded.
C) The amount the demand decreases if the price rises $1.
D) The amount the price decreases if the demand is increased by 1 gallon.
Question
What is the equation of the line with x-intercept
 And y-intercept
 ?
?
A)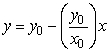
B)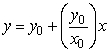
C)
D)
E) There is not a unique equation for this line.
And y-intercept?A)
B)
C)
D)
E) There is not a unique equation for this line.
Question
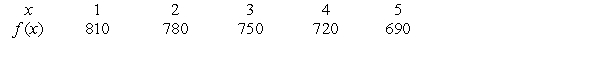
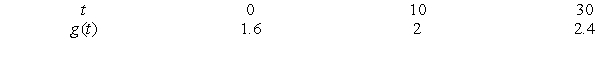
An athlete wanting to strengthen his cardiovascular system will bench-press a weight, w, as many times, N, as possible. The following table shows the relationship between N and w.
 Assuming linearity, let N be a function of w. What is the physical interpretation of the slope?
A) The number of bench-presses the athlete can do if there is no weight.
B) The decrease in the number of bench-presses the athlete can do as the weight increases by 1 pound.
C) The decrease in the weight the athlete can lift as an additional bench-press is required.
D) The amount of weight at which the athlete can no longer do any bench-presses.
Assuming linearity, let N be a function of w. What is the physical interpretation of the slope?A) The number of bench-presses the athlete can do if there is no weight.
B) The decrease in the number of bench-presses the athlete can do as the weight increases by 1 pound.
C) The decrease in the weight the athlete can lift as an additional bench-press is required.
D) The amount of weight at which the athlete can no longer do any bench-presses.
Question
What is the vertical intercept of the line l in the following figure in terms of the constants A and B? 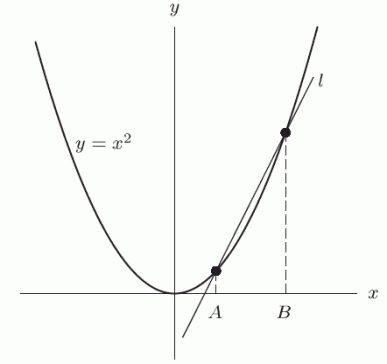
A)
B)
C)
D)
A)
B)
C)
D)
Question
The formula for the line intersecting the graph of
 at x = 0.1 and x = 0.2 is given by
  , where b = _____ and m = _____.
at x = 0.1 and x = 0.2 is given by , where b = _____ and m = _____. Question
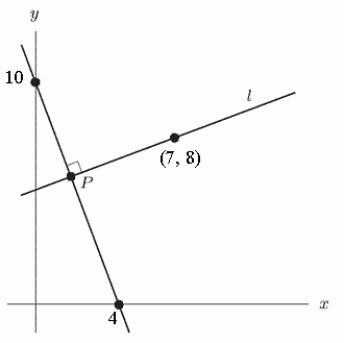
Find the x-coordinate of the point P shown in the following figure. Round to 3 decimal places.

Question
In the following figure, let A = 10 and B = 5. Find the equation of the line through (A, B) and (P, 0) and use it to find the value of P.
Question
Suppose that  is linear and that
  and
and . If
. If  , then b = _____ and m = _____.
is linear and that and . If , then b = _____ and m = _____. Question
Suppose that  is linear with slope -0.5 and passing through the point (-2, 9). If
  , then b = _____ and m = _____.
is linear with slope -0.5 and passing through the point (-2, 9). If , then b = _____ and m = _____. Question
Suppose that  is linear with an x-intercept of -2 and a y-intercept of 4. If
  , then b = _____ and m = _____.
is linear with an x-intercept of -2 and a y-intercept of 4. If , then b = _____ and m = _____. Question
What is the formula for the line graphed in the following figure?
A)
B)
C)
D)
A)
B)
C)
D)
Question
If the equation 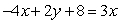 is written in the form
  , then b = _____ and m = _____.
is written in the form , then b = _____ and m = _____. Question
Let  define a linear function with slope 1/2 that passes through the point (-1, 6). Then b = _____ and m = _____.
define a linear function with slope 1/2 that passes through the point (-1, 6). Then b = _____ and m = _____. Question
Let  define a linear function with y-intercept 3 that passes through the point (-1, -1). Then b = _____ and m = _____.
define a linear function with y-intercept 3 that passes through the point (-1, -1). Then b = _____ and m = _____. Question
Let  be the formula for the linear function defined in the following table. Then b = _____ and m = _____.
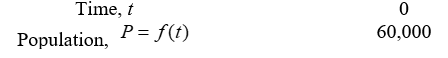
be the formula for the linear function defined in the following table. Then b = _____ and m = _____. Question
A car company has found that there is a linear relationship between the amount of money it spends on advertising and the number of cars it sells. When it spent 55,000 dollars on advertising, it sold 515 cars. Moreover, for each additional 10 thousand dollars spent, they sell 30 more cars. Let  be the formula for the number of cars sold as a function of x, the amount of money spent on advertising. Then b = _____ and m = _____.
be the formula for the number of cars sold as a function of x, the amount of money spent on advertising. Then b = _____ and m = _____. Question
A car company has found that there is a linear relationship between the amount of money it spends on advertising and the number of cars it sells. When it spent 55,000 dollars on advertising, it sold 482.5 cars. Moreover, for each additional 10 thousand dollars spent, they sell 15 more cars. Let  Be the formula for the number of cars sold as a function of x, the amount of money spent on advertising. What is the practical interpretation of the vertical intercept of the equation?
A) The dollars spent on advertising per car sold.
B) The number of cars sold with no money spent on advertising.
C) The amount of advertising spent before any cars are sold.
D) The number of cars sold per dollar spent on advertising.
Be the formula for the number of cars sold as a function of x, the amount of money spent on advertising. What is the practical interpretation of the vertical intercept of the equation?A) The dollars spent on advertising per car sold.
B) The number of cars sold with no money spent on advertising.
C) The amount of advertising spent before any cars are sold.
D) The number of cars sold per dollar spent on advertising.
Question
ComElectric, the Cambridge power company, charges its customers $9.00 a month and $0.068 per kwh, plus a $0.0325 per kwh surcharge. (A kwh, or kilowatt-hour, is a unit of electricity supplied). The formula for the monthly cost for x kwh of electricity is  dollars, where b = _____ and m = _____.
dollars, where b = _____ and m = _____. Question
If a linear population function is 50,000 in year t = 0 and grows by 750 people per year, then  , where b = _____ and m = _____
, where b = _____ and m = _____ Question
At a price of $2.65 per gallon, the average weekly demand by consumers for gasoline is 42 gallons. If the price rises to $2.75, the weekly demand drops to 38 gallons. Assuming demand is linear, let  , where Q is the weekly quantity of gasoline demanded and p is the price per gallon. Then b = _____ and m = _____.
, where Q is the weekly quantity of gasoline demanded and p is the price per gallon. Then b = _____ and m = _____. Question
Question
An airplane has room for 330 coach-fare seats. It can replace any 3 coach-fare seats with 2 first-class seats. Suppose the airplane is configured with x coach-fare seats and y first-class seats, with no space wasted. If  , then b = _____ and m = _____.
, then b = _____ and m = _____. Question
If a linear population function is 60,000 in year t = 0 and 90,000 by year t = 20, then  , where b = _____ and m = _____.
, where b = _____ and m = _____. Question
An athlete wanting to strengthen his cardiovascular system will bench-press a weight, w, as many times, N, as possible. The following table shows the relationship between N and w.
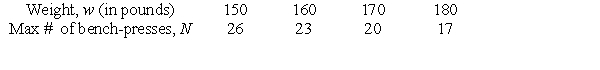 Assuming linearity, let
  . Then b = _____ and m = _____.
Assuming linearity, let . Then b = _____ and m = _____. Question
An athlete wanting to strengthen his cardiovascular system will bench-press a weight, w, as many times, N, as possible. The following table shows the relationship between N and w.
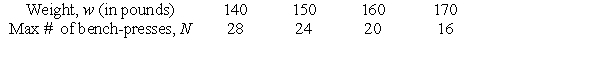 Assuming linearity, what is the maximum weight this athlete will be able bench-press 6 times? Round to the nearest whole number.
Assuming linearity, what is the maximum weight this athlete will be able bench-press 6 times? Round to the nearest whole number. Question
Question
Question
Question
The following table shows the relationship between s, the side length of an equilateral triangle, p, the perimeter of the triangle, and A, the area of the triangle.
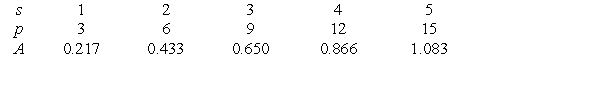 If A is a linear function of s, give its rate of change. If it is not linear, enter "not linear".
If A is a linear function of s, give its rate of change. If it is not linear, enter "not linear". Question
A salesman earns  , where n is the number of products sold, and
  is the weekly wage in dollars. What does the number 450 represent? (Mark all that apply)
A) The slope
B) The vertical intercept
C) The salesman's base salary
D) The salesman's commission for each product sold
, where n is the number of products sold, and is the weekly wage in dollars. What does the number 450 represent? (Mark all that apply)A) The slope
B) The vertical intercept
C) The salesman's base salary
D) The salesman's commission for each product sold
Question
The distance traveled by a car is  miles, where t is the number of hours driven. What is the vertical intercept?
miles, where t is the number of hours driven. What is the vertical intercept? Question
The distance traveled by a car is  Miles, where t is the number of hours driven. What is the meaning of the number 80? (Mark all that apply)
A) The vertical intercept
B) The slope
C) The total distance traveled
D) The speed of the car
Miles, where t is the number of hours driven. What is the meaning of the number 80? (Mark all that apply)A) The vertical intercept
B) The slope
C) The total distance traveled
D) The speed of the car
Question
Could the following table represent a linear function?
Question
Could the following table represent a linear function?
Question
Could the following table represent a linear function?
Question
Which of the following figures shows the graph of a person's weight, w, as a function of time t, in months if the person starts out at 150 pounds and loses 10 pounds a month?
A)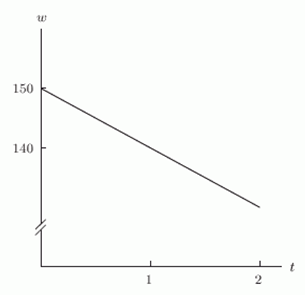
B)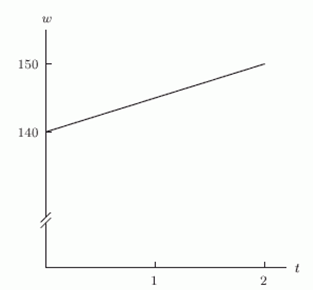
C)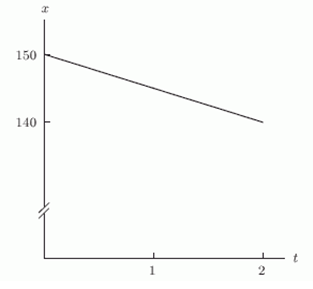
D)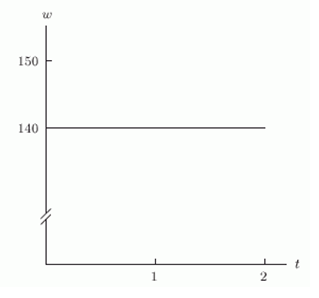
A)
B)
C)
D)
Question
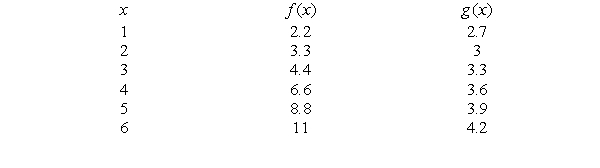
One of the functions represented in the table below is linear. What is its vertical intercept?
Question
For the line  ,
,
a) what is the slope of the line?
b) what is the y-intercept of the line?
,a) what is the slope of the line?
b) what is the y-intercept of the line?
Question
A cookie store has a fixed monthly cost of $550. It costs the cookie store $0.25 to make a cookie and the store sells each cookie for $1.50. Express revenue R, cost C, and profit P for the cookie store when making and selling  cookies in a month.
cookies in a month. Question
A certain baseball card's value is given by
 where
where  is the number of years after the card was issued. Interpret the constants 1.1 and 4.2.
where is the number of years after the card was issued. Interpret the constants 1.1 and 4.2. Question
The population of a pack of rats can be represented by the formula Where
Where  Represents the population in hundreds, and
  represents the time, in months, since January 2010. Which of the following is correct regarding the vertical intercept?
A)
B)
C)
D)
Where Represents the population in hundreds, and represents the time, in months, since January 2010. Which of the following is correct regarding the vertical intercept?A)
B)
C)
D)
Question
The population of a pack of rats can be represented by the formula Where
Where  Represents the population in hundreds, and
  Represents the time, in months, since January 2010. Which of the following is correct regarding the slope.
A)
B)
C)
D)
Where Represents the population in hundreds, and Represents the time, in months, since January 2010. Which of the following is correct regarding the slope.A)
B)
C)
D)
Question

Unlock Deck
Sign up to unlock the cards in this deck!
Unlock Deck
Unlock Deck
1/127
Play
Full screen (f)
Deck 1: Linear Functions and Change
1
Several years ago, the wild rabbits of Australia were seriously threatened by a virus that was accidentally released into their population. Suppose that the following table gives the number r of rabbits (in millions) remaining t months after the release of the virus.
Use a calculator program to find the slope of the regression line for this data. Round to 3 decimal places.
Use a calculator program to find the slope of the regression line for this data. Round to 3 decimal places.-105.406
2
Several years ago, the wild rabbits of Australia were seriously threatened by a virus that was accidentally released into their population. Suppose that the following table gives the number r of rabbits (in millions) remaining t months after the release of the virus.
- Use a calculator program to find the regression line for this data and use this to estimate how many million rabbits were left after 15 months. Round to the nearest whole number.
- Use a calculator program to find the regression line for this data and use this to estimate how many million rabbits were left after 15 months. Round to the nearest whole number.
622
3
Several years ago, the wild rabbits of Australia were seriously threatened by a virus that was accidentally released into their population. Suppose that the following table gives the number r of rabbits (in millions) remaining t months after the release of the virus.
- Use a calculator program to find the regression line for this data. What is the physical interpretation of the t-intercept?
A) The decrease in the population if the virus is present an additional month.
B) The number of months the virus took to lower the population by 1 milllion.
C) The initial rabbit population when the virus was introduced.
D) The time in months at which the rabbit population falls to zero.
The time in months at which the rabbit population falls to zero.
4
A study was done that collected data on 100 individuals' grade point averages and the number of hours per week they spent working. A linear regression was done on this data and the corresponding correlation coefficient was 0.3. What does this tell you about the relationship between grade point averages and working?
A) Increasing working does not affect grade point average.
B) Increasing working increases grade point average.
C) Increasing working decreases grade point average.
A) Increasing working does not affect grade point average.
B) Increasing working increases grade point average.
C) Increasing working decreases grade point average.
Unlock Deck
Unlock for access to all 127 flashcards in this deck.
Unlock Deck
k this deck
5
The following figure gives the annual amount of milk produced (in 1000s of pounds) per US milk cow as a function of t, the number of years since 1986. Is the regression line r = 0.34t + 13.4 reasonably correct?
Unlock Deck
Unlock for access to all 127 flashcards in this deck.
Unlock Deck
k this deck
6
The following table shows the cost of a taxi ride, in dollars, as a function of miles traveled.
Estimate
.
Estimate .
Unlock Deck
Unlock for access to all 127 flashcards in this deck.
Unlock Deck
k this deck
7
The following table shows the cost of a taxi ride, in dollars, as a function of miles traveled.
If
, estimate m to 1 decimal place.
If , estimate m to 1 decimal place.
Unlock Deck
Unlock for access to all 127 flashcards in this deck.
Unlock Deck
k this deck
8
The following figure shows scatter plots with r values 0.9, 0.5, 0 ,-0.5, and -0.9. Which scatter plot has r value 0.5?
A)
B)
C)
D)
E)
A)
B)
C)
D)
E)
Unlock Deck
Unlock for access to all 127 flashcards in this deck.
Unlock Deck
k this deck
9
The following table gives the number P of people living in a town t years after 1990.
-
Use a calculator program to find the slope of the regression line for this data. Round to 3 decimal places.
-
Use a calculator program to find the slope of the regression line for this data. Round to 3 decimal places.
Unlock Deck
Unlock for access to all 127 flashcards in this deck.
Unlock Deck
k this deck
10
The following table gives the number P of people living in a town t years after 1990.
-Use a calculator program to find the regression line for this data and use this to estimate how many lived in the year 2011. Round to the nearest whole number.
-Use a calculator program to find the regression line for this data and use this to estimate how many lived in the year 2011. Round to the nearest whole number.
Unlock Deck
Unlock for access to all 127 flashcards in this deck.
Unlock Deck
k this deck
11
The following table shows the size of a cell phone bill, in dollars, as a function of the number of text messages.
- Use a calculator program to find a regression line for this data. Estimate
using the formula for the regression line.
- Use a calculator program to find a regression line for this data. Estimate
using the formula for the regression line.
Unlock Deck
Unlock for access to all 127 flashcards in this deck.
Unlock Deck
k this deck
12
The following table shows the cost of a cell phone bill, in dollars, as a function of the number of texts.
Use a calculator program to find a regression line for this data. From the formula for the regression line, estimate the value of m that satisfies
. Round up to the nearest number of texts.
Use a calculator program to find a regression line for this data. From the formula for the regression line, estimate the value of m that satisfies . Round up to the nearest number of texts.
Unlock Deck
Unlock for access to all 127 flashcards in this deck.
Unlock Deck
k this deck
13
The following table gives the profits (in millions) of a manufacturing company
months after January 1, 2008.
- Use a calculator program to find the vertical intercept of the regression line for this data. Round to 2 decimal places.
months after January 1, 2008.- Use a calculator program to find the vertical intercept of the regression line for this data. Round to 2 decimal places.
Unlock Deck
Unlock for access to all 127 flashcards in this deck.
Unlock Deck
k this deck
14
The following table gives the profits (in millions) of a manufacturing company months after January 1, 2008.
-Use a calculator program to find the regression line for this data and use this to estimate the profit on January 1, 2009. Round your
answer to one decimal place.
months after January 1, 2008. -Use a calculator program to find the regression line for this data and use this to estimate the profit on January 1, 2009. Round your
answer to one decimal place.
Unlock Deck
Unlock for access to all 127 flashcards in this deck.
Unlock Deck
k this deck
15
The following tables give the profits (in millions) of a manufacturing company months after January 1, 2008.
Use a calculator program to find the regression line for this data. What is the physical interpretation of the t-intercept?
months after January 1, 2008. Use a calculator program to find the regression line for this data. What is the physical interpretation of the t-intercept? Unlock Deck
Unlock for access to all 127 flashcards in this deck.
Unlock Deck
k this deck
16
Does an value of 0.07 seem reasonable for the following set of data?
value of 0.07 seem reasonable for the following set of data? Unlock Deck
Unlock for access to all 127 flashcards in this deck.
Unlock Deck
k this deck
17
Several years ago, the wild rabbits of Australia were seriously threatened by a virus that was accidentally released into their population. Suppose that the following table gives the number r of rabbits (in millions) remaining t months after the release of the virus.
Find the regression line for this data. Round to 3 decimal places.
Find the regression line for this data. Round to 3 decimal places. Unlock Deck
Unlock for access to all 127 flashcards in this deck.
Unlock Deck
k this deck
18
The following table gives the number of people P living in a town t years after 1990. Use a calculator program to find the regression line for this data.
Use a calculator program to find the regression line for this data. Unlock Deck
Unlock for access to all 127 flashcards in this deck.
Unlock Deck
k this deck
19
The following table shows the cost of a cell phone bill, in dollars, as a function of the number of texts.
Use a calculator program to find a regression line for this data.
Use a calculator program to find a regression line for this data. Unlock Deck
Unlock for access to all 127 flashcards in this deck.
Unlock Deck
k this deck
20
The following table gives the profits (in millions) of a manufacturing company months after January 1, 2008.
Use a calculator program to find the regression line for this data.
months after January 1, 2008. Use a calculator program to find the regression line for this data. Unlock Deck
Unlock for access to all 127 flashcards in this deck.
Unlock Deck
k this deck
21
Suppose that is linear with an x-intercept of 6 and parallel to . If , then b = _____ and m = _____.
is linear with an x-intercept of 6 and parallel to . If , then b = _____ and m = _____. Unlock Deck
Unlock for access to all 127 flashcards in this deck.
Unlock Deck
k this deck
22
Suppose that is linear, passes through the point (-1, 3), and is parallel to . If , then b = _____ and m = _____.
is linear, passes through the point (-1, 3), and is parallel to . If , then b = _____ and m = _____. Unlock Deck
Unlock for access to all 127 flashcards in this deck.
Unlock Deck
k this deck
23
Suppose that is linear, has slope -0.5, and forms the hypotenuse of the right triangle lying in Quadrant I whose area is 36 and whose legs lie on the x and y axes. If , then b = _____ and m = _____.
is linear, has slope -0.5, and forms the hypotenuse of the right triangle lying in Quadrant I whose area is 36 and whose legs lie on the x and y axes. If , then b = _____ and m = _____. Unlock Deck
Unlock for access to all 127 flashcards in this deck.
Unlock Deck
k this deck
24
The following figure gives lines A, B, C, D, and E. Their equations are given below. Which is the equation for line E ?
A)
B)
C)
D)
E)
A)
B)
C)
D)
E)
Unlock Deck
Unlock for access to all 127 flashcards in this deck.
Unlock Deck
k this deck
25
Mark all of the following functions that are increasing.
A)
B)
C)
D)
E)
F)
A)
B)
C)
D)
E)
F)
Unlock Deck
Unlock for access to all 127 flashcards in this deck.
Unlock Deck
k this deck
26
Mark all of the following functions that have graphs that are parallel.
A)
B)
C)
D)
E)
F)
A)
B)
C)
D)
E)
F)
Unlock Deck
Unlock for access to all 127 flashcards in this deck.
Unlock Deck
k this deck
27
Mark all of the following functions that pass through the point (0, 6).
A)
B)
C)
D)
E)
F)
A)
B)
C)
D)
E)
F)
Unlock Deck
Unlock for access to all 127 flashcards in this deck.
Unlock Deck
k this deck
28
Mark all of the following functions that are neither increasing nor decreasing.
A)
B)
C)
D)
E)
F)
A)
B)
C)
D)
E)
F)
Unlock Deck
Unlock for access to all 127 flashcards in this deck.
Unlock Deck
k this deck
29
Are the lines and parallel, perpendicular, or neither?
and parallel, perpendicular, or neither? Unlock Deck
Unlock for access to all 127 flashcards in this deck.
Unlock Deck
k this deck
30
Many economists believe that a country's inflation rate will rise if its unemployment rate falls. The following figure show the relationship between the inflation rate, I, and the unemployment rate, u, in four different countries.
In which of the four countries does a change in the unemployment rate have no apparent effect on the inflation rate?
In which of the four countries does a change in the unemployment rate have no apparent effect on the inflation rate? Unlock Deck
Unlock for access to all 127 flashcards in this deck.
Unlock Deck
k this deck
31
The following figure show the distance of two horses from the starting point of a race as a function of time. Which horse won the race? (Answer "A" or "B")
Unlock Deck
Unlock for access to all 127 flashcards in this deck.
Unlock Deck
k this deck
32
You need to purchase a new computer printer. The cost of printer A is $80, and its ink cartridges are $29 each. The cost of printer B is $160, and its ink cartridges are $16 each. You estimate that you will need new ink cartridges about once a month. Find equations for the total cost of each printer after t months and use them to determine when you would have invested about the same amount of money in each. Round to the nearest tenth of a month.
Unlock Deck
Unlock for access to all 127 flashcards in this deck.
Unlock Deck
k this deck
33
If and represent the population (in millions) of two countries, A and B, then in what year will the population of country A double the population of country B? Round to 2 decimal places.
and represent the population (in millions) of two countries, A and B, then in what year will the population of country A double the population of country B? Round to 2 decimal places. Unlock Deck
Unlock for access to all 127 flashcards in this deck.
Unlock Deck
k this deck
34
Find the vertical intercept of the line l shown n the following figure.
Unlock Deck
Unlock for access to all 127 flashcards in this deck.
Unlock Deck
k this deck
35
An airplane has room for 360 coach-fare seats. It can replace any 3 coach-fare seats with 2 first-class seats. Suppose the airplane is configured with x coach-fare seats and y first-class seats, with no space wasted. If you found a formula for y as a function of x, what would be the significance of the x-intercept?
A) It is the number of first-class seats that could replace one coach seat.
B) It is the number of coach seats that could replace one first-class seat.
C) It is the number of first-class seats, if there are no coach seats.
D) It is the number of coach seats, if there are no first-class seats.
A) It is the number of first-class seats that could replace one coach seat.
B) It is the number of coach seats that could replace one first-class seat.
C) It is the number of first-class seats, if there are no coach seats.
D) It is the number of coach seats, if there are no first-class seats.
Unlock Deck
Unlock for access to all 127 flashcards in this deck.
Unlock Deck
k this deck
36
The cost, C, of producing q items is given by the formula , where And m are positive constants. If the quantity produced increases, what happens to the cost of production?
A) It decreases.
B) It stays the same.
C) It increases.
D)
, where And m are positive constants. If the quantity produced increases, what happens to the cost of production?A) It decreases.
B) It stays the same.
C) It increases.
D)
Unlock Deck
Unlock for access to all 127 flashcards in this deck.
Unlock Deck
k this deck
37
At a price of $2.55 per gallon, the average weekly demand by consumers for gasoline is 43 gallons. If the price rises to $2.75, the weekly demand drops to 41 gallons. Assuming demand is linear, let
, where Q is the weekly quantity of gasoline demanded and p is the price per gallon. What is the slope m, along with its economic significance?
A) -0.40; if gasoline prices increase by $1 per gallon, then there will be a 0.40 gallon decrease in weekly demand.
B) -2; if gasoline prices increase by $1 per gallon, then there will be a 2 gallon decrease in weekly demand.
C) -10; if gasoline prices increase by $1 per gallon, then there will be a 10 gallon decrease in weekly demand.
D) -0.20; if gasoline prices increase by $1 per gallon, then there will be a 0.20 gallon decrease in weekly demand.
, where Q is the weekly quantity of gasoline demanded and p is the price per gallon. What is the slope m, along with its economic significance?A) -0.40; if gasoline prices increase by $1 per gallon, then there will be a 0.40 gallon decrease in weekly demand.
B) -2; if gasoline prices increase by $1 per gallon, then there will be a 2 gallon decrease in weekly demand.
C) -10; if gasoline prices increase by $1 per gallon, then there will be a 10 gallon decrease in weekly demand.
D) -0.20; if gasoline prices increase by $1 per gallon, then there will be a 0.20 gallon decrease in weekly demand.
Unlock Deck
Unlock for access to all 127 flashcards in this deck.
Unlock Deck
k this deck
38
At a price of $3.00 per gallon, the average weekly demand by consumers for gasoline is 40 gallons. If the price rises to $3.05, the weekly demand drops to 35 gallons. Assuming demand is linear, let
, where Q is the weekly quantity of gasoline demanded and p is the price per gallon. What is the economic interpretation of the Q-intercept?
A) The number of gallons demanded if gas were free.
B) The the price at which no gasoline will be demanded.
C) The amount the demand decreases if the price rises $1.
D) The amount the price decreases if the demand is increased by 1 gallon.
, where Q is the weekly quantity of gasoline demanded and p is the price per gallon. What is the economic interpretation of the Q-intercept?A) The number of gallons demanded if gas were free.
B) The the price at which no gasoline will be demanded.
C) The amount the demand decreases if the price rises $1.
D) The amount the price decreases if the demand is increased by 1 gallon.
Unlock Deck
Unlock for access to all 127 flashcards in this deck.
Unlock Deck
k this deck
39
What is the equation of the line with x-intercept
And y-intercept
?
A)
B)
C)
D)
E) There is not a unique equation for this line.
And y-intercept?A)
B)
C)
D)
E) There is not a unique equation for this line.
Unlock Deck
Unlock for access to all 127 flashcards in this deck.
Unlock Deck
k this deck
40
An athlete wanting to strengthen his cardiovascular system will bench-press a weight, w, as many times, N, as possible. The following table shows the relationship between N and w.
Assuming linearity, let N be a function of w. What is the physical interpretation of the slope?
A) The number of bench-presses the athlete can do if there is no weight.
B) The decrease in the number of bench-presses the athlete can do as the weight increases by 1 pound.
C) The decrease in the weight the athlete can lift as an additional bench-press is required.
D) The amount of weight at which the athlete can no longer do any bench-presses.
Assuming linearity, let N be a function of w. What is the physical interpretation of the slope?A) The number of bench-presses the athlete can do if there is no weight.
B) The decrease in the number of bench-presses the athlete can do as the weight increases by 1 pound.
C) The decrease in the weight the athlete can lift as an additional bench-press is required.
D) The amount of weight at which the athlete can no longer do any bench-presses.
Unlock Deck
Unlock for access to all 127 flashcards in this deck.
Unlock Deck
k this deck
41
What is the vertical intercept of the line l in the following figure in terms of the constants A and B?
A)
B)
C)
D)
A)
B)
C)
D)
Unlock Deck
Unlock for access to all 127 flashcards in this deck.
Unlock Deck
k this deck
42
The formula for the line intersecting the graph of
at x = 0.1 and x = 0.2 is given by , where b = _____ and m = _____.
at x = 0.1 and x = 0.2 is given by , where b = _____ and m = _____. Unlock Deck
Unlock for access to all 127 flashcards in this deck.
Unlock Deck
k this deck
43
Find the x-coordinate of the point P shown in the following figure. Round to 3 decimal places.
Unlock Deck
Unlock for access to all 127 flashcards in this deck.
Unlock Deck
k this deck
44
In the following figure, let A = 10 and B = 5. Find the equation of the line through (A, B) and (P, 0) and use it to find the value of P.
Unlock Deck
Unlock for access to all 127 flashcards in this deck.
Unlock Deck
k this deck
45
Suppose that is linear and that and . If , then b = _____ and m = _____.
is linear and that and . If , then b = _____ and m = _____. Unlock Deck
Unlock for access to all 127 flashcards in this deck.
Unlock Deck
k this deck
46
Suppose that is linear with slope -0.5 and passing through the point (-2, 9). If , then b = _____ and m = _____.
is linear with slope -0.5 and passing through the point (-2, 9). If , then b = _____ and m = _____. Unlock Deck
Unlock for access to all 127 flashcards in this deck.
Unlock Deck
k this deck
47
Suppose that is linear with an x-intercept of -2 and a y-intercept of 4. If , then b = _____ and m = _____.
is linear with an x-intercept of -2 and a y-intercept of 4. If , then b = _____ and m = _____. Unlock Deck
Unlock for access to all 127 flashcards in this deck.
Unlock Deck
k this deck
48
What is the formula for the line graphed in the following figure?
A)
B)
C)
D)
A)
B)
C)
D)
Unlock Deck
Unlock for access to all 127 flashcards in this deck.
Unlock Deck
k this deck
49
If the equation is written in the form , then b = _____ and m = _____.
is written in the form , then b = _____ and m = _____. Unlock Deck
Unlock for access to all 127 flashcards in this deck.
Unlock Deck
k this deck
50
Let define a linear function with slope 1/2 that passes through the point (-1, 6). Then b = _____ and m = _____.
define a linear function with slope 1/2 that passes through the point (-1, 6). Then b = _____ and m = _____. Unlock Deck
Unlock for access to all 127 flashcards in this deck.
Unlock Deck
k this deck
51
Let define a linear function with y-intercept 3 that passes through the point (-1, -1). Then b = _____ and m = _____.
define a linear function with y-intercept 3 that passes through the point (-1, -1). Then b = _____ and m = _____. Unlock Deck
Unlock for access to all 127 flashcards in this deck.
Unlock Deck
k this deck
52
Let be the formula for the linear function defined in the following table. Then b = _____ and m = _____.
be the formula for the linear function defined in the following table. Then b = _____ and m = _____. Unlock Deck
Unlock for access to all 127 flashcards in this deck.
Unlock Deck
k this deck
53
A car company has found that there is a linear relationship between the amount of money it spends on advertising and the number of cars it sells. When it spent 55,000 dollars on advertising, it sold 515 cars. Moreover, for each additional 10 thousand dollars spent, they sell 30 more cars. Let be the formula for the number of cars sold as a function of x, the amount of money spent on advertising. Then b = _____ and m = _____.
be the formula for the number of cars sold as a function of x, the amount of money spent on advertising. Then b = _____ and m = _____. Unlock Deck
Unlock for access to all 127 flashcards in this deck.
Unlock Deck
k this deck
54
A car company has found that there is a linear relationship between the amount of money it spends on advertising and the number of cars it sells. When it spent 55,000 dollars on advertising, it sold 482.5 cars. Moreover, for each additional 10 thousand dollars spent, they sell 15 more cars. Let Be the formula for the number of cars sold as a function of x, the amount of money spent on advertising. What is the practical interpretation of the vertical intercept of the equation?
A) The dollars spent on advertising per car sold.
B) The number of cars sold with no money spent on advertising.
C) The amount of advertising spent before any cars are sold.
D) The number of cars sold per dollar spent on advertising.
Be the formula for the number of cars sold as a function of x, the amount of money spent on advertising. What is the practical interpretation of the vertical intercept of the equation?A) The dollars spent on advertising per car sold.
B) The number of cars sold with no money spent on advertising.
C) The amount of advertising spent before any cars are sold.
D) The number of cars sold per dollar spent on advertising.
Unlock Deck
Unlock for access to all 127 flashcards in this deck.
Unlock Deck
k this deck
55
ComElectric, the Cambridge power company, charges its customers $9.00 a month and $0.068 per kwh, plus a $0.0325 per kwh surcharge. (A kwh, or kilowatt-hour, is a unit of electricity supplied). The formula for the monthly cost for x kwh of electricity is dollars, where b = _____ and m = _____.
dollars, where b = _____ and m = _____. Unlock Deck
Unlock for access to all 127 flashcards in this deck.
Unlock Deck
k this deck
56
If a linear population function is 50,000 in year t = 0 and grows by 750 people per year, then , where b = _____ and m = _____
, where b = _____ and m = _____ Unlock Deck
Unlock for access to all 127 flashcards in this deck.
Unlock Deck
k this deck
57
At a price of $2.65 per gallon, the average weekly demand by consumers for gasoline is 42 gallons. If the price rises to $2.75, the weekly demand drops to 38 gallons. Assuming demand is linear, let , where Q is the weekly quantity of gasoline demanded and p is the price per gallon. Then b = _____ and m = _____.
, where Q is the weekly quantity of gasoline demanded and p is the price per gallon. Then b = _____ and m = _____. Unlock Deck
Unlock for access to all 127 flashcards in this deck.
Unlock Deck
k this deck
58
An airplane has room for 390 coach-fare seats. It can replace any 3 coach-fare seats with 2 first-class seats. Suppose the airplane is configured with x coach-fare seats and y first-class seats, with no space wasted. If x = 0, what is the value of y?
Unlock Deck
Unlock for access to all 127 flashcards in this deck.
Unlock Deck
k this deck
59
An airplane has room for 330 coach-fare seats. It can replace any 3 coach-fare seats with 2 first-class seats. Suppose the airplane is configured with x coach-fare seats and y first-class seats, with no space wasted. If , then b = _____ and m = _____.
, then b = _____ and m = _____. Unlock Deck
Unlock for access to all 127 flashcards in this deck.
Unlock Deck
k this deck
60
If a linear population function is 60,000 in year t = 0 and 90,000 by year t = 20, then , where b = _____ and m = _____.
, where b = _____ and m = _____. Unlock Deck
Unlock for access to all 127 flashcards in this deck.
Unlock Deck
k this deck
61
An athlete wanting to strengthen his cardiovascular system will bench-press a weight, w, as many times, N, as possible. The following table shows the relationship between N and w.
Assuming linearity, let . Then b = _____ and m = _____.
Assuming linearity, let . Then b = _____ and m = _____. Unlock Deck
Unlock for access to all 127 flashcards in this deck.
Unlock Deck
k this deck
62
An athlete wanting to strengthen his cardiovascular system will bench-press a weight, w, as many times, N, as possible. The following table shows the relationship between N and w.
Assuming linearity, what is the maximum weight this athlete will be able bench-press 6 times? Round to the nearest whole number.
Assuming linearity, what is the maximum weight this athlete will be able bench-press 6 times? Round to the nearest whole number. Unlock Deck
Unlock for access to all 127 flashcards in this deck.
Unlock Deck
k this deck
63
Find a formula for the linear function that passes through the points (4,-4) and (-3,24)
Unlock Deck
Unlock for access to all 127 flashcards in this deck.
Unlock Deck
k this deck
64
Find a formula for the linear function that passes through the point (3,7) with slope 3.
Unlock Deck
Unlock for access to all 127 flashcards in this deck.
Unlock Deck
k this deck
65
Find a formula for the linear function that has x-intercept -4 and y-intercept 16.
Unlock Deck
Unlock for access to all 127 flashcards in this deck.
Unlock Deck
k this deck
66
The following table shows the relationship between s, the side length of an equilateral triangle, p, the perimeter of the triangle, and A, the area of the triangle.
If A is a linear function of s, give its rate of change. If it is not linear, enter "not linear".
If A is a linear function of s, give its rate of change. If it is not linear, enter "not linear". Unlock Deck
Unlock for access to all 127 flashcards in this deck.
Unlock Deck
k this deck
67
A salesman earns , where n is the number of products sold, and is the weekly wage in dollars. What does the number 450 represent? (Mark all that apply)
A) The slope
B) The vertical intercept
C) The salesman's base salary
D) The salesman's commission for each product sold
, where n is the number of products sold, and is the weekly wage in dollars. What does the number 450 represent? (Mark all that apply)A) The slope
B) The vertical intercept
C) The salesman's base salary
D) The salesman's commission for each product sold
Unlock Deck
Unlock for access to all 127 flashcards in this deck.
Unlock Deck
k this deck
68
The distance traveled by a car is miles, where t is the number of hours driven. What is the vertical intercept?
miles, where t is the number of hours driven. What is the vertical intercept? Unlock Deck
Unlock for access to all 127 flashcards in this deck.
Unlock Deck
k this deck
69
The distance traveled by a car is Miles, where t is the number of hours driven. What is the meaning of the number 80? (Mark all that apply)
A) The vertical intercept
B) The slope
C) The total distance traveled
D) The speed of the car
Miles, where t is the number of hours driven. What is the meaning of the number 80? (Mark all that apply)A) The vertical intercept
B) The slope
C) The total distance traveled
D) The speed of the car
Unlock Deck
Unlock for access to all 127 flashcards in this deck.
Unlock Deck
k this deck
70
Could the following table represent a linear function?
Unlock Deck
Unlock for access to all 127 flashcards in this deck.
Unlock Deck
k this deck
71
Could the following table represent a linear function?
Unlock Deck
Unlock for access to all 127 flashcards in this deck.
Unlock Deck
k this deck
72
Could the following table represent a linear function?
Unlock Deck
Unlock for access to all 127 flashcards in this deck.
Unlock Deck
k this deck
73
Which of the following figures shows the graph of a person's weight, w, as a function of time t, in months if the person starts out at 150 pounds and loses 10 pounds a month?
A)
B)
C)
D)
A)
B)
C)
D)
Unlock Deck
Unlock for access to all 127 flashcards in this deck.
Unlock Deck
k this deck
74
One of the functions represented in the table below is linear. What is its vertical intercept?
Unlock Deck
Unlock for access to all 127 flashcards in this deck.
Unlock Deck
k this deck
75
For the line ,
a) what is the slope of the line?
b) what is the y-intercept of the line?
,a) what is the slope of the line?
b) what is the y-intercept of the line?
Unlock Deck
Unlock for access to all 127 flashcards in this deck.
Unlock Deck
k this deck
76
A cookie store has a fixed monthly cost of $550. It costs the cookie store $0.25 to make a cookie and the store sells each cookie for $1.50. Express revenue R, cost C, and profit P for the cookie store when making and selling cookies in a month.
cookies in a month. Unlock Deck
Unlock for access to all 127 flashcards in this deck.
Unlock Deck
k this deck
77
A certain baseball card's value is given by
where is the number of years after the card was issued. Interpret the constants 1.1 and 4.2.
where is the number of years after the card was issued. Interpret the constants 1.1 and 4.2. Unlock Deck
Unlock for access to all 127 flashcards in this deck.
Unlock Deck
k this deck
78
The population of a pack of rats can be represented by the formulaWhere Represents the population in hundreds, and represents the time, in months, since January 2010. Which of the following is correct regarding the vertical intercept?
A)
B)
C)
D)
Where Represents the population in hundreds, and represents the time, in months, since January 2010. Which of the following is correct regarding the vertical intercept?A)
B)
C)
D)
Unlock Deck
Unlock for access to all 127 flashcards in this deck.
Unlock Deck
k this deck
79
The population of a pack of rats can be represented by the formulaWhere Represents the population in hundreds, and Represents the time, in months, since January 2010. Which of the following is correct regarding the slope.
A)
B)
C)
D)
Where Represents the population in hundreds, and Represents the time, in months, since January 2010. Which of the following is correct regarding the slope.A)
B)
C)
D)
Unlock Deck
Unlock for access to all 127 flashcards in this deck.
Unlock Deck
k this deck
80
A wildlife ranger finds that there is a linear relationship between the number of bushels of corn distributed in a month and the number of deer at the park. If the ranger distributes no bushels of corn, there are 47 deer at the park. For each additional bushel of corn distributed, 7 more deer come to the park.
a) If d is the number of deer at the park and b is the number of bushels of corn fed in a month, find a formula for d in terms of b .
b) How many deer are at the park if the ranger feeds 2 bushels of corn?
c) How many bushels of corn must be distributed in order to have 75 deer at the park?
a) If d is the number of deer at the park and b is the number of bushels of corn fed in a month, find a formula for d in terms of b .
b) How many deer are at the park if the ranger feeds 2 bushels of corn?
c) How many bushels of corn must be distributed in order to have 75 deer at the park?
Unlock Deck
Unlock for access to all 127 flashcards in this deck.
Unlock Deck
k this deck
Unlock Deck
Unlock for access to all 127 flashcards in this deck.


