Deck 11: Analysis of Variance: One-Way Classification
Full screen (f)
Question
Question
Question
Question
Question
Question
Question
Question
Question
Question
Question
Question
Question
Question
Question
Question
Question
Question
Question
Question
Question
Question
Question
Question
Question
Question
Question
Question
Question
Data Set 11-1: The baseline of each curve represents scores on the dependent variable (just like the curves in the book).
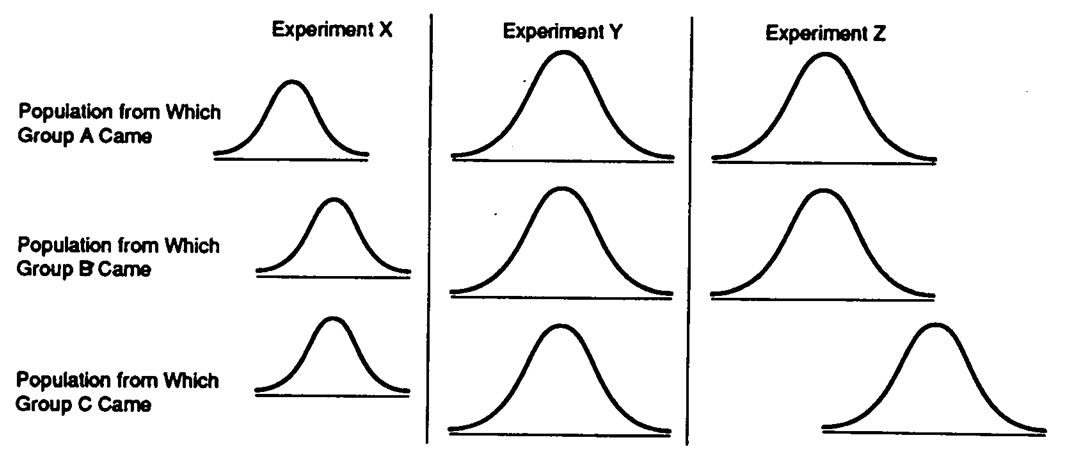
-Refer to Data Set 11-1. The null hypothesis should be rejected for an ANOVA on Experiment
A) X
B) Y
C) Z
-Refer to Data Set 11-1. The null hypothesis should be rejected for an ANOVA on Experiment
A) X
B) Y
C) Z
Question
Data Set 11-1: The baseline of each curve represents scores on the dependent variable (just like the curves in the book).
-Refer to Data Set 11-1. The denominator of the F ratio would be smallest for an ANOVA on Experiment
A) X
B) Y
C) Z
-Refer to Data Set 11-1. The denominator of the F ratio would be smallest for an ANOVA on Experiment
A) X
B) Y
C) Z
Question
Data Set 11-1: The baseline of each curve represents scores on the dependent variable (just like the curves in the book).
-Refer to Data Set 11-1. The null hypothesis is true in Experiment
A) X
B) Y
C) Z
-Refer to Data Set 11-1. The null hypothesis is true in Experiment
A) X
B) Y
C) Z
Question
Data Set 11-2: The baseline of each curve represents scores on the dependent variable (just like the curves in the book).
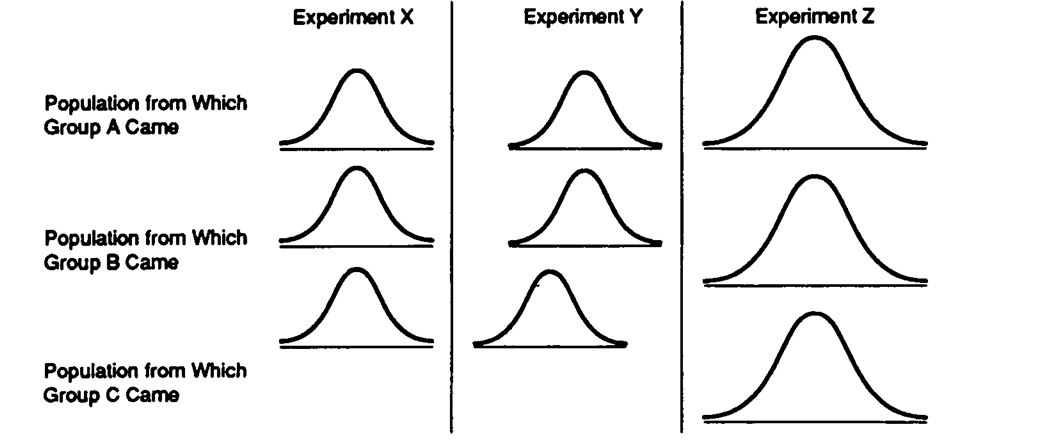
-Refer to Data Set 11-2. The null hypothesis should be rejected for an ANOVA on Experiment
A) X
B) Y
C) Z
-Refer to Data Set 11-2. The null hypothesis should be rejected for an ANOVA on Experiment
A) X
B) Y
C) Z
Question
Data Set 11-2: The baseline of each curve represents scores on the dependent variable (just like the curves in the book).
-Refer to Data Set 11-2. The denominator of the F ratio would be largest for an ANOVA onExperiment
A) X
B) Y
C) Z
-Refer to Data Set 11-2. The denominator of the F ratio would be largest for an ANOVA onExperiment
A) X
B) Y
C) Z
Question
Data Set 11-2: The baseline of each curve represents scores on the dependent variable (just like the curves in the book).
-Refer to Data Set 11-2. The null hypothesis is true in Experiment
A) X
B) Y
C) Z
D)X and Z
-Refer to Data Set 11-2. The null hypothesis is true in Experiment
A) X
B) Y
C) Z
D)X and Z
Question
Data Set 11-3: The baseline of each curve represents scores on the dependent variable (just like the curves in the book).
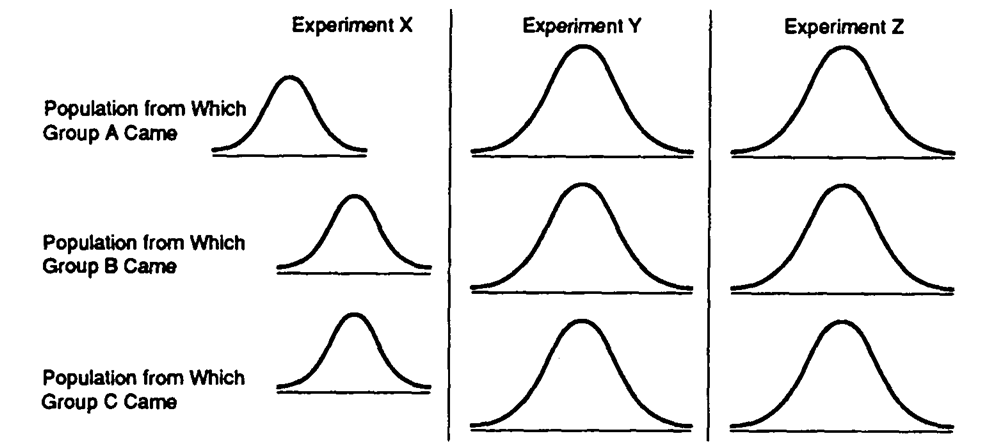
-Refer to Data Set 11-3. The null hypothesis should be rejected for an ANOVA in Experiment
A) X
B) Y
C) Z
-Refer to Data Set 11-3. The null hypothesis should be rejected for an ANOVA in Experiment
A) X
B) Y
C) Z
Question
Data Set 11-3: The baseline of each curve represents scores on the dependent variable (just like the curves in the book).
-Refer to Data Set 11-3. The denominator of the F ratio would be largest for an ANOVA inExperiment
A) X
B) Y
C) Z
D)Y and Z
-Refer to Data Set 11-3. The denominator of the F ratio would be largest for an ANOVA inExperiment
A) X
B) Y
C) Z
D)Y and Z
Question
Data Set 11-3: The baseline of each curve represents scores on the dependent variable (just like the curves in the book).
-Refer to Data Set 11-3. The null hypothesis is true in Experiment
A) X
B) Y
C) Z
D)Y and Z
-Refer to Data Set 11-3. The null hypothesis is true in Experiment
A) X
B) Y
C) Z
D)Y and Z
Question
Data Set 11-4: The baseline of each curve represents scores on the dependent variable (just like the curves in the book).
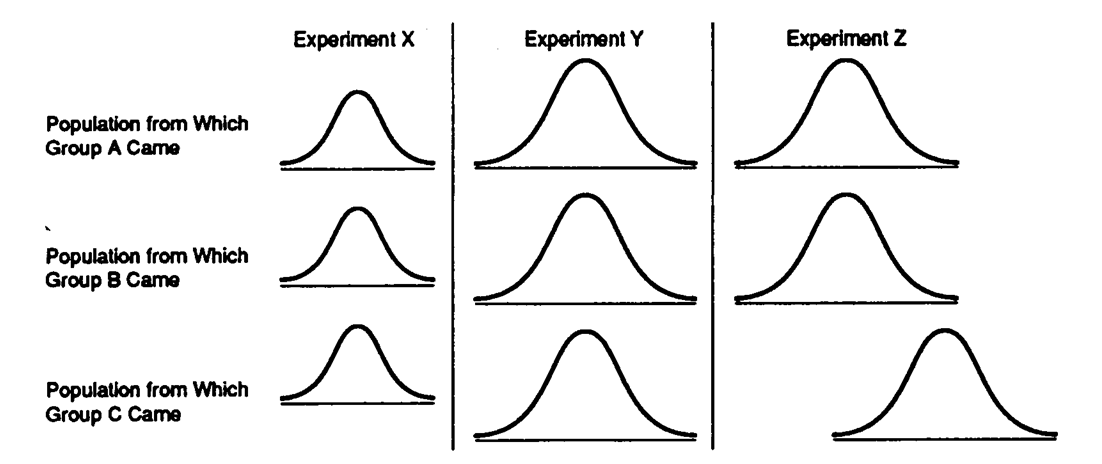
-Refer to Data Set 11-4. The null hypothesis should be rejected for an ANOVA in Experiment
A) X
B) Y
C) Z
-Refer to Data Set 11-4. The null hypothesis should be rejected for an ANOVA in Experiment
A) X
B) Y
C) Z
Question
Data Set 11-4: The baseline of each curve represents scores on the dependent variable (just like the curves in the book).
-Refer to Data Set 11-4. The denominator of the F ratio would be largest for an ANOVA in Experiment
A) X
B) Y
C) Z
D)Y and Z
-Refer to Data Set 11-4. The denominator of the F ratio would be largest for an ANOVA in Experiment
A) X
B) Y
C) Z
D)Y and Z
Question
Data Set 11-4: The baseline of each curve represents scores on the dependent variable (just like the curves in the book).
-Refer to Data Set 11-4. The null hypothesis is true in Experiment
A) X
B) Y
C) Z
D) X and Y
-Refer to Data Set 11-4. The null hypothesis is true in Experiment
A) X
B) Y
C) Z
D) X and Y
Question
Question
Question
Question
Question
Question
Question
Question
Question
Question
Question
Question
Question
Question
Question
Question
Question
Question
Question
Question
Question
Question
Question
Question
Question
Question
Question
Question
Question
Question
Question
Question
Question
Question
Question
Question
Question
Question
Question
Question

Unlock Deck
Sign up to unlock the cards in this deck!
Unlock Deck
Unlock Deck
1/176
Play
Full screen (f)
Deck 11: Analysis of Variance: One-Way Classification
1
The person responsible for developing analysis of variance was Karl Pearson.
False
2
The numerator of an F ratio is a variance.
True
3
In a one-way ANOVA, the total variability is divided into four portions.
False
4
The F distribution is skewed.
Unlock Deck
Unlock for access to all 176 flashcards in this deck.
Unlock Deck
k this deck
5
MStreat is a good estimator of 2, even when the null hypothesis is false.
Unlock Deck
Unlock for access to all 176 flashcards in this deck.
Unlock Deck
k this deck
6
A priori tests are those that are planned before an ANOVA is calculated.
Unlock Deck
Unlock for access to all 176 flashcards in this deck.
Unlock Deck
k this deck
7
To compare two means from a three-group data set, use a Tukey Honestly Significant Difference test.
Unlock Deck
Unlock for access to all 176 flashcards in this deck.
Unlock Deck
k this deck
8
The effect size index, d, is not appropriate for one-way ANOVA data.
Unlock Deck
Unlock for access to all 176 flashcards in this deck.
Unlock Deck
k this deck
9
Analysis of variance is a null hypothesis statistical testing technique.
Unlock Deck
Unlock for access to all 176 flashcards in this deck.
Unlock Deck
k this deck
10
The person responsible for developing analysis of variance was William Gosset.
Unlock Deck
Unlock for access to all 176 flashcards in this deck.
Unlock Deck
k this deck
11
The denominator of an F ratio is a variance.
Unlock Deck
Unlock for access to all 176 flashcards in this deck.
Unlock Deck
k this deck
12
In a one-way ANOVA, the total variability is divided into three portions.
Unlock Deck
Unlock for access to all 176 flashcards in this deck.
Unlock Deck
k this deck
13
A sum of squares divided by degrees of freedom is a mean square.
Unlock Deck
Unlock for access to all 176 flashcards in this deck.
Unlock Deck
k this deck
14
MSerror is a good estimator of 2, even when the null hypothesis is false.
Unlock Deck
Unlock for access to all 176 flashcards in this deck.
Unlock Deck
k this deck
15
After an ANOVA is calculated and the group means examined, a post hoc test is appropriate.
Unlock Deck
Unlock for access to all 176 flashcards in this deck.
Unlock Deck
k this deck
16
To compare two means from a three-group data set, use three t tests.
Unlock Deck
Unlock for access to all 176 flashcards in this deck.
Unlock Deck
k this deck
17
Two effect size indexes, f and d, are appropriate for one-way ANOVA data.
Unlock Deck
Unlock for access to all 176 flashcards in this deck.
Unlock Deck
k this deck
18
The one-way in one-way analysis of variance means that there is only one independent variable.
Unlock Deck
Unlock for access to all 176 flashcards in this deck.
Unlock Deck
k this deck
19
The person responsible for developing analysis of variance was Francis Galton.
Unlock Deck
Unlock for access to all 176 flashcards in this deck.
Unlock Deck
k this deck
20
F values are ratios of two variances.
Unlock Deck
Unlock for access to all 176 flashcards in this deck.
Unlock Deck
k this deck
21
In a one-way ANOVA, the total variability is divided into two portions.
Unlock Deck
Unlock for access to all 176 flashcards in this deck.
Unlock Deck
k this deck
22
The F distribution is not a normal distribution.
Unlock Deck
Unlock for access to all 176 flashcards in this deck.
Unlock Deck
k this deck
23
A sum of squares is a mean square divided by degrees of freedom.
Unlock Deck
Unlock for access to all 176 flashcards in this deck.
Unlock Deck
k this deck
24
MSerror is a good estimator of 2 when the null hypothesis is true.
Unlock Deck
Unlock for access to all 176 flashcards in this deck.
Unlock Deck
k this deck
25
After an ANOVA is calculated and the group means examined, an a priori test is appropriate.
Unlock Deck
Unlock for access to all 176 flashcards in this deck.
Unlock Deck
k this deck
26
A Tukey Honestly Significant Difference test can be used to compare two means from a four-group data set.
Unlock Deck
Unlock for access to all 176 flashcards in this deck.
Unlock Deck
k this deck
27
The effect size index, f, is appropriate for one-way ANOVA data.
Unlock Deck
Unlock for access to all 176 flashcards in this deck.
Unlock Deck
k this deck
28
The assumptions of analysis of variance are more numerous than those for the independent samples t test.
Unlock Deck
Unlock for access to all 176 flashcards in this deck.
Unlock Deck
k this deck
29
Data Set 11-1: The baseline of each curve represents scores on the dependent variable (just like the curves in the book).
-Refer to Data Set 11-1. The null hypothesis should be rejected for an ANOVA on Experiment
A) X
B) Y
C) Z
-Refer to Data Set 11-1. The null hypothesis should be rejected for an ANOVA on Experiment
A) X
B) Y
C) Z
Unlock Deck
Unlock for access to all 176 flashcards in this deck.
Unlock Deck
k this deck
30
Data Set 11-1: The baseline of each curve represents scores on the dependent variable (just like the curves in the book).
-Refer to Data Set 11-1. The denominator of the F ratio would be smallest for an ANOVA on Experiment
A) X
B) Y
C) Z
-Refer to Data Set 11-1. The denominator of the F ratio would be smallest for an ANOVA on Experiment
A) X
B) Y
C) Z
Unlock Deck
Unlock for access to all 176 flashcards in this deck.
Unlock Deck
k this deck
31
Data Set 11-1: The baseline of each curve represents scores on the dependent variable (just like the curves in the book).
-Refer to Data Set 11-1. The null hypothesis is true in Experiment
A) X
B) Y
C) Z
-Refer to Data Set 11-1. The null hypothesis is true in Experiment
A) X
B) Y
C) Z
Unlock Deck
Unlock for access to all 176 flashcards in this deck.
Unlock Deck
k this deck
32
Data Set 11-2: The baseline of each curve represents scores on the dependent variable (just like the curves in the book).
-Refer to Data Set 11-2. The null hypothesis should be rejected for an ANOVA on Experiment
A) X
B) Y
C) Z
-Refer to Data Set 11-2. The null hypothesis should be rejected for an ANOVA on Experiment
A) X
B) Y
C) Z
Unlock Deck
Unlock for access to all 176 flashcards in this deck.
Unlock Deck
k this deck
33
Data Set 11-2: The baseline of each curve represents scores on the dependent variable (just like the curves in the book).
-Refer to Data Set 11-2. The denominator of the F ratio would be largest for an ANOVA onExperiment
A) X
B) Y
C) Z
-Refer to Data Set 11-2. The denominator of the F ratio would be largest for an ANOVA onExperiment
A) X
B) Y
C) Z
Unlock Deck
Unlock for access to all 176 flashcards in this deck.
Unlock Deck
k this deck
34
Data Set 11-2: The baseline of each curve represents scores on the dependent variable (just like the curves in the book).
-Refer to Data Set 11-2. The null hypothesis is true in Experiment
A) X
B) Y
C) Z
D)X and Z
-Refer to Data Set 11-2. The null hypothesis is true in Experiment
A) X
B) Y
C) Z
D)X and Z
Unlock Deck
Unlock for access to all 176 flashcards in this deck.
Unlock Deck
k this deck
35
Data Set 11-3: The baseline of each curve represents scores on the dependent variable (just like the curves in the book).
-Refer to Data Set 11-3. The null hypothesis should be rejected for an ANOVA in Experiment
A) X
B) Y
C) Z
-Refer to Data Set 11-3. The null hypothesis should be rejected for an ANOVA in Experiment
A) X
B) Y
C) Z
Unlock Deck
Unlock for access to all 176 flashcards in this deck.
Unlock Deck
k this deck
36
Data Set 11-3: The baseline of each curve represents scores on the dependent variable (just like the curves in the book).
-Refer to Data Set 11-3. The denominator of the F ratio would be largest for an ANOVA inExperiment
A) X
B) Y
C) Z
D)Y and Z
-Refer to Data Set 11-3. The denominator of the F ratio would be largest for an ANOVA inExperiment
A) X
B) Y
C) Z
D)Y and Z
Unlock Deck
Unlock for access to all 176 flashcards in this deck.
Unlock Deck
k this deck
37
Data Set 11-3: The baseline of each curve represents scores on the dependent variable (just like the curves in the book).
-Refer to Data Set 11-3. The null hypothesis is true in Experiment
A) X
B) Y
C) Z
D)Y and Z
-Refer to Data Set 11-3. The null hypothesis is true in Experiment
A) X
B) Y
C) Z
D)Y and Z
Unlock Deck
Unlock for access to all 176 flashcards in this deck.
Unlock Deck
k this deck
38
Data Set 11-4: The baseline of each curve represents scores on the dependent variable (just like the curves in the book).
-Refer to Data Set 11-4. The null hypothesis should be rejected for an ANOVA in Experiment
A) X
B) Y
C) Z
-Refer to Data Set 11-4. The null hypothesis should be rejected for an ANOVA in Experiment
A) X
B) Y
C) Z
Unlock Deck
Unlock for access to all 176 flashcards in this deck.
Unlock Deck
k this deck
39
Data Set 11-4: The baseline of each curve represents scores on the dependent variable (just like the curves in the book).
-Refer to Data Set 11-4. The denominator of the F ratio would be largest for an ANOVA in Experiment
A) X
B) Y
C) Z
D)Y and Z
-Refer to Data Set 11-4. The denominator of the F ratio would be largest for an ANOVA in Experiment
A) X
B) Y
C) Z
D)Y and Z
Unlock Deck
Unlock for access to all 176 flashcards in this deck.
Unlock Deck
k this deck
40
Data Set 11-4: The baseline of each curve represents scores on the dependent variable (just like the curves in the book).
-Refer to Data Set 11-4. The null hypothesis is true in Experiment
A) X
B) Y
C) Z
D) X and Y
-Refer to Data Set 11-4. The null hypothesis is true in Experiment
A) X
B) Y
C) Z
D) X and Y
Unlock Deck
Unlock for access to all 176 flashcards in this deck.
Unlock Deck
k this deck
41
Data Set 11-5:
-The three components of the error variance in Data Set 11-5 are
A) about equal
B) very unequal
C) some are equal and some are unequal
D) not enough information is given.
-The three components of the error variance in Data Set 11-5 are
A) about equal
B) very unequal
C) some are equal and some are unequal
D) not enough information is given.
Unlock Deck
Unlock for access to all 176 flashcards in this deck.
Unlock Deck
k this deck
42
Data Set 11-5:
-Descriptions for Groups A, B, and C in Data Set 11-5 follow. For which would the ANOVA described in Chapter 11not be appropriate?
A) 10 mg, 20 mg, and 100 mg of a new drug, 6 rats
B) Yale, Princeton, and Harvard, 6 students
C) before, after, and three months later, 2 rats
D) all of the descriptive alternatives are correct.
-Descriptions for Groups A, B, and C in Data Set 11-5 follow. For which would the ANOVA described in Chapter 11
A) 10 mg, 20 mg, and 100 mg of a new drug, 6 rats
B) Yale, Princeton, and Harvard, 6 students
C) before, after, and three months later, 2 rats
D) all of the descriptive alternatives are correct.
Unlock Deck
Unlock for access to all 176 flashcards in this deck.
Unlock Deck
k this deck
43
Data Set 11-5:
-The largest HSD in Data Set 11-5 would be found in comparing
A) A vs B
B) A vs C
C) B vs C
D) cannot be determined from the information given.
-The largest HSD in Data Set 11-5 would be found in comparing
A) A vs B
B) A vs C
C) B vs C
D) cannot be determined from the information given.
Unlock Deck
Unlock for access to all 176 flashcards in this deck.
Unlock Deck
k this deck
44
Data Set 11-5:
-Suppose each of the scores in Data Set 11-5 was changed by adding 1 to it. SSerror will then be
A) smaller
B) larger
C) the same size
D) cannot be determined from the information given.
-Suppose each of the scores in Data Set 11-5 was changed by adding 1 to it. SSerror will then be
A) smaller
B) larger
C) the same size
D) cannot be determined from the information given.
Unlock Deck
Unlock for access to all 176 flashcards in this deck.
Unlock Deck
k this deck
45
Data Set 11-6: Walking is valuable exercise. Does the size of the place you live have any relationship to how much walking you do? The following data (in miles per day) are entirely hypothetical, but represent a reasonable guess. (The place names for this problem are ordered from large to small and are from particular sources-can you identify a source or two?)
-For Data Set 11-6, the number of levels of the independent variable is
A) 1
B) 2
C) 3
-For Data Set 11-6, the number of levels of the independent variable is
A) 1
B) 2
C) 3
Unlock Deck
Unlock for access to all 176 flashcards in this deck.
Unlock Deck
k this deck
46
Data Set 11-6: Walking is valuable exercise. Does the size of the place you live have any relationship to how much walking you do? The following data (in miles per day) are entirely hypothetical, but represent a reasonable guess. (The place names for this problem are ordered from large to small and are from particular sources-can you identify a source or two?)
-The proper critical value for Data Set 11-6 with alpha at the .05 level is
A) 3.47
B) 3.40
C) 5.78
-The proper critical value for Data Set 11-6 with alpha at the .05 level is
A) 3.47
B) 3.40
C) 5.78
Unlock Deck
Unlock for access to all 176 flashcards in this deck.
Unlock Deck
k this deck
47
Data Set 11-6: Walking is valuable exercise. Does the size of the place you live have any relationship to how much walking you do? The following data (in miles per day) are entirely hypothetical, but represent a reasonable guess. (The place names for this problem are ordered from large to small and are from particular sources-can you identify a source or two?)
-For Data Set 11-6, the proper conclusion is that there are
A) no significant differences the null hypothesis should be rejected
B) no significant differences the null hypothesis should be retained
C) significant differences the null hypothesis should be rejected
D) significant differences the null hypothesis should be retained.
Unlock Deck
Unlock for access to all 176 flashcards in this deck.
Unlock Deck
k this deck
48
Data Set 11-7: As you may know, there has been some controversy about who the actual author was of plays we today attribute to Shakespeare. Suppose that three critics gave their judgments as to the likelihood (0 to 100%) that each of the three named below was the actual author.
-The scores in Data Set 11-7_____________ be analyzed using the techniques in Chapter 11 because
A) can, all the requirements for ANOVA are met
B) cannot, the same dependent variable was not used with each "author"
C) cannot, the independent variable is just names
D) cannot, the judgments are correlated measures.
Unlock Deck
Unlock for access to all 176 flashcards in this deck.
Unlock Deck
k this deck
49
Data Set 11-7: As you may know, there has been some controversy about who the actual author was of plays we today attribute to Shakespeare. Suppose that three critics gave their judgments as to the likelihood (0 to 100%) that each of the three named below was the actual author.
-Regardless of your answer to the question above, the MStreat for the numbers in Data Set 11-7 is
A) 6339
B) 3289
C) 2153
D) 1644
E) 508
-Regardless of your answer to the question above, the MStreat for the numbers in Data Set 11-7 is
A) 6339
B) 3289
C) 2153
D) 1644
E) 508
Unlock Deck
Unlock for access to all 176 flashcards in this deck.
Unlock Deck
k this deck
50
Data Set 11-7: As you may know, there has been some controversy about who the actual author was of plays we today attribute to Shakespeare. Suppose that three critics gave their judgments as to the likelihood (0 to 100%) that each of the three named below was the actual author.
-Regardless of your answer to the questions above, the dferror for the numbers in Data Set 11-7 is
A) 8
B) 6
C) 3
-Regardless of your answer to the questions above, the dferror for the numbers in Data Set 11-7 is
A) 8
B) 6
C) 3
Unlock Deck
Unlock for access to all 176 flashcards in this deck.
Unlock Deck
k this deck
51
Data Set 11-8:
-Consider the three components of the error variance in Data Set 11-8.
A) They are about equal
B) They are not equal
C) Two are equal and one is different
D) Not enough information is given.
-Consider the three components of the error variance in Data Set 11-8.
A) They are about equal
B) They are not equal
C) Two are equal and one is different
D) Not enough information is given.
Unlock Deck
Unlock for access to all 176 flashcards in this deck.
Unlock Deck
k this deck
52
Data Set 11-8:
-Descriptions for Groups A, B, and C in Data Set 11-8 follow. For which would the ANOVA described in Chapter 11not be appropriate?
A) New Yorkers, Bostonians, Chicagoers 9 political participants
B) age 16, age 20, age 24 3 female participants
C) freshmen, sophomores, seniors 9 student participants
D) all of the other alternatives are correct.
-Descriptions for Groups A, B, and C in Data Set 11-8 follow. For which would the ANOVA described in Chapter 11
A) New Yorkers, Bostonians, Chicagoers 9 political participants
B) age 16, age 20, age 24 3 female participants
C) freshmen, sophomores, seniors 9 student participants
D) all of the other alternatives are correct.
Unlock Deck
Unlock for access to all 176 flashcards in this deck.
Unlock Deck
k this deck
53
Data Set 11-8:
-Suppose you performed HSD tests on the means of the groups in Data Set 11-8. The HSD values would be
A) all about equal and not significant
B) all about equal and significant
C) equal for two comparisons and larger for the other
D) equal for two comparisons and smaller for the other.
-Suppose you performed HSD tests on the means of the groups in Data Set 11-8. The HSD values would be
A) all about equal and not significant
B) all about equal and significant
C) equal for two comparisons and larger for the other
D) equal for two comparisons and smaller for the other.
Unlock Deck
Unlock for access to all 176 flashcards in this deck.
Unlock Deck
k this deck
54
The person who developed analysis of variance as a statistical technique was
A) Gosset
B) Quetelet
C) Tukey
D) none of the other alternatives are correct.
A) Gosset
B) Quetelet
C) Tukey
D) none of the other alternatives are correct.
Unlock Deck
Unlock for access to all 176 flashcards in this deck.
Unlock Deck
k this deck
55
The F distribution is called F
A) because it was the sixth statistical distribution discovered after 1900
B) because it is the only fixed statistical distribution
C) because the distribution is a theoretical frequency distribution
D) to honor a man whose name began with F.
A) because it was the sixth statistical distribution discovered after 1900
B) because it is the only fixed statistical distribution
C) because the distribution is a theoretical frequency distribution
D) to honor a man whose name began with F.
Unlock Deck
Unlock for access to all 176 flashcards in this deck.
Unlock Deck
k this deck
56
Credit for the development of ANOVA goes to
A) Francis Galton, a geneticist
B) Karl Pearson, a statistician
C) Ronald Fisher, a biologist
D) George Snedecor, a psychologist.
A) Francis Galton, a geneticist
B) Karl Pearson, a statistician
C) Ronald Fisher, a biologist
D) George Snedecor, a psychologist.
Unlock Deck
Unlock for access to all 176 flashcards in this deck.
Unlock Deck
k this deck
57
The person who developed ANOVA was
A) W. S. Gosset, a businessman
B) John W. Tukey, a statistician
C) "student," a pseudonym
D) Ronald A. Fisher, a biologist.
A) W. S. Gosset, a businessman
B) John W. Tukey, a statistician
C) "student," a pseudonym
D) Ronald A. Fisher, a biologist.
Unlock Deck
Unlock for access to all 176 flashcards in this deck.
Unlock Deck
k this deck
58
A) R. A. Fisher
B) George Snedecor
C) William S. Gosset ("student")
D) Karl Pearson.
Unlock Deck
Unlock for access to all 176 flashcards in this deck.
Unlock Deck
k this deck
59
Ronald A. Fisher gets credit for developing
A) analysis of variance
B) the t distribution
C) both of the descriptive alternatives are correct
D) neither of the descriptive alternatives is correct
A) analysis of variance
B) the t distribution
C) both of the descriptive alternatives are correct
D) neither of the descriptive alternatives is correct
Unlock Deck
Unlock for access to all 176 flashcards in this deck.
Unlock Deck
k this deck
60
Ronald A. Fisher made significant contributions to statistics and
A) psychology
B) chemistry
C) sociology
D) none of the other alternatives are correct.
A) psychology
B) chemistry
C) sociology
D) none of the other alternatives are correct.
Unlock Deck
Unlock for access to all 176 flashcards in this deck.
Unlock Deck
k this deck
61
Ronald A. Fisher
A) discovered the exact sampling distribution of r
B) wrote Statistical Methods for Research Workers
C) invented analysis of variance
D) all of the descriptive alternatives are correct.
A) discovered the exact sampling distribution of r
B) wrote Statistical Methods for Research Workers
C) invented analysis of variance
D) all of the descriptive alternatives are correct.
Unlock Deck
Unlock for access to all 176 flashcards in this deck.
Unlock Deck
k this deck
62
The designs analyzed in Chapter 11 called for the samples to be
A) independent, as described for the independent-measures t test
B) related, as described for the paired-measures t test
C) either of the descriptive alternatives.
A) independent, as described for the independent-measures t test
B) related, as described for the paired-measures t test
C) either of the descriptive alternatives.
Unlock Deck
Unlock for access to all 176 flashcards in this deck.
Unlock Deck
k this deck
63
The ANOVA technique as described in Chapter 11 cannot be used when
A) the number of scores in each group is unequal
B) subjects are randomly assigned to one of the groups before the independent variable is administered
C) samples are drawn from populations that have equal variances
D) subjects participate in every level of the independent variable.
A) the number of scores in each group is unequal
B) subjects are randomly assigned to one of the groups before the independent variable is administered
C) samples are drawn from populations that have equal variances
D) subjects participate in every level of the independent variable.
Unlock Deck
Unlock for access to all 176 flashcards in this deck.
Unlock Deck
k this deck
64
The ANOVA techniques described in Chapter 11 cannot be used to analyze an experiment with
A) two levels of the independent variable
B) three levels of the independent variable
C) paired samples designs:
D) independent samples designs.
A) two levels of the independent variable
B) three levels of the independent variable
C) paired samples designs:
D) independent samples designs.
Unlock Deck
Unlock for access to all 176 flashcards in this deck.
Unlock Deck
k this deck
65
The techniques of Chapter 11 are not appropriate if the data come from
A) a paired-samples design
B) populations that do not have the same mean
C) both of the descriptive alternatives are correct
D) neither of the descriptive alternatives is correct.
A) a paired-samples design
B) populations that do not have the same mean
C) both of the descriptive alternatives are correct
D) neither of the descriptive alternatives is correct.
Unlock Deck
Unlock for access to all 176 flashcards in this deck.
Unlock Deck
k this deck
66
The ANOVA technique described in the text can be used on
A) paired-samples designs
B) independent-samples designs
C) both of the descriptive alternatives are correct
D) neither of the descriptive alternatives are correct.
A) paired-samples designs
B) independent-samples designs
C) both of the descriptive alternatives are correct
D) neither of the descriptive alternatives are correct.
Unlock Deck
Unlock for access to all 176 flashcards in this deck.
Unlock Deck
k this deck
67
Suppose you found a way to redo a study so that the SSerror was reduced compared to the first time you ran the experiment. The SStreat stayed the same as before. The effect of this will be to
A) increase the population variance
B) be more likely to detect population differences if there are any
C) increase the degrees of freedom
D) all of the descriptive alternatives are correct.
A) increase the population variance
B) be more likely to detect population differences if there are any
C) increase the degrees of freedom
D) all of the descriptive alternatives are correct.
Unlock Deck
Unlock for access to all 176 flashcards in this deck.
Unlock Deck
k this deck
68
Suppose MStreat is calculated for three samples that are from a population with a mean = 10. Under which condition below would MStreat certainly become larger?
A) the addition of a sample from a population with the a mean of 10
B) the addition of a sample from a population with a mean = 20
C) the removal of one of the three samples from the calculations
D) all of the other alternatives are correct.
A) the addition of a sample from a population with the a mean of 10
B) the addition of a sample from a population with a mean = 20
C) the removal of one of the three samples from the calculations
D) all of the other alternatives are correct.
Unlock Deck
Unlock for access to all 176 flashcards in this deck.
Unlock Deck
k this deck
69
The larger the population variance, the larger________ is.
A) F
B) df
C) MSerror
D) all of the descriptive alternatives are correct.
A) F
B) df
C) MSerror
D) all of the descriptive alternatives are correct.
Unlock Deck
Unlock for access to all 176 flashcards in this deck.
Unlock Deck
k this deck
70
If the null hypothesis is true, an analysis of variance determines the probability that the samples
A) came from the same population
B) came from different populations
C) came from an F distribution
D) are random samples.
A) came from the same population
B) came from different populations
C) came from an F distribution
D) are random samples.
Unlock Deck
Unlock for access to all 176 flashcards in this deck.
Unlock Deck
k this deck
71
If the null hypothesis is true, mean square__________ will be a good estimate of the population variance.
A) error
B) treatment
C) both of the descriptive alternatives are correct
D) neither of the descriptive alternatives is correct.
A) error
B) treatment
C) both of the descriptive alternatives are correct
D) neither of the descriptive alternatives is correct.
Unlock Deck
Unlock for access to all 176 flashcards in this deck.
Unlock Deck
k this deck
72
If the null hypothesis is true,_______________ will be a good estimate of the population variance.
A) the error mean square
B) the treatment mean square
C) both of the descriptive alternatives are correct
D) neither of the descriptive alternatives is correct.
A) the error mean square
B) the treatment mean square
C) both of the descriptive alternatives are correct
D) neither of the descriptive alternatives is correct.
Unlock Deck
Unlock for access to all 176 flashcards in this deck.
Unlock Deck
k this deck
73
If the null hypothesis is false,______________ will be a good estimate of the population variance.
A) the error mean square
B) the treatment mean square
C) both of the descriptive alternatives are correct
D) neither of the descriptive alternatives is correct.
A) the error mean square
B) the treatment mean square
C) both of the descriptive alternatives are correct
D) neither of the descriptive alternatives is correct.
Unlock Deck
Unlock for access to all 176 flashcards in this deck.
Unlock Deck
k this deck
74
When the null hypothesis is true, which of the following is a good estimate of the population variance?
A) MStreat
B) MSerror
C) both of the descriptive alternatives are correct
D) neither of the descriptive alternatives is correct.
A) MStreat
B) MSerror
C) both of the descriptive alternatives are correct
D) neither of the descriptive alternatives is correct.
Unlock Deck
Unlock for access to all 176 flashcards in this deck.
Unlock Deck
k this deck
75
If the null hypothesis is not true, mean square______________ will be a good estimate of the population variance.
A) error
B) treatment
C) both of the descriptive alternatives are correct
D) neither of the descriptive alternatives is correct.
A) error
B) treatment
C) both of the descriptive alternatives are correct
D) neither of the descriptive alternatives is correct.
Unlock Deck
Unlock for access to all 176 flashcards in this deck.
Unlock Deck
k this deck
76
The mean square error will be a good estimate of the population variance when
A) when the null hypothesis is true
B) when the null hypothesis is false
C) regardless of whether the null hypothesis is true or false
A) when the null hypothesis is true
B) when the null hypothesis is false
C) regardless of whether the null hypothesis is true or false
Unlock Deck
Unlock for access to all 176 flashcards in this deck.
Unlock Deck
k this deck
77
MSerror will be a good estimate of the population variance
A) when the null hypothesis is true
B) when the null hypothesis is false
C) both of the descriptive alternatives are correct
D) never, MSerror is not an estimate of the population variance.
A) when the null hypothesis is true
B) when the null hypothesis is false
C) both of the descriptive alternatives are correct
D) never, MSerror is not an estimate of the population variance.
Unlock Deck
Unlock for access to all 176 flashcards in this deck.
Unlock Deck
k this deck
78
When the null hypothesis is false, which of the following is a good estimate of the population variance?
A) MStreat
B) MSerror
C) both of the descriptive alternatives are correct
D) neither of the descriptive alternatives is correct.
A) MStreat
B) MSerror
C) both of the descriptive alternatives are correct
D) neither of the descriptive alternatives is correct.
Unlock Deck
Unlock for access to all 176 flashcards in this deck.
Unlock Deck
k this deck
79
"All of the samples in the study came from populations with identical means"is a statement of
A) an assumption about the data that is required if the F distribution is to be accurate
B) the null hypothesis
C) both of the descriptive alternatives are correct
D) neither of the descriptive alternatives are correct.
A) an assumption about the data that is required if the F distribution is to be accurate
B) the null hypothesis
C) both of the descriptive alternatives are correct
D) neither of the descriptive alternatives are correct.
Unlock Deck
Unlock for access to all 176 flashcards in this deck.
Unlock Deck
k this deck
80
The null hypothesis in an ANOVA problem is that
A) all the groups are drawn from the same population
B) none of the groups were drawn from the same population
C) one or more of the groups was drawn from a different population
D) any of the other alternatives, depending on how many levels of the independent variable there are.
A) all the groups are drawn from the same population
B) none of the groups were drawn from the same population
C) one or more of the groups was drawn from a different population
D) any of the other alternatives, depending on how many levels of the independent variable there are.
Unlock Deck
Unlock for access to all 176 flashcards in this deck.
Unlock Deck
k this deck
Unlock Deck
Unlock for access to all 176 flashcards in this deck.


