Deck 2: Exploring Data: Frequency Distributions and Graphs
Full screen (f)
Question
Question
Question
Question
Question
Question
Question
Question
Question
Question
Question
Question
Question
Question
Question
Question
Question
Question
Question
Question
Question
Question
Question
Question
Question
Question
Question
Question
Question
Question
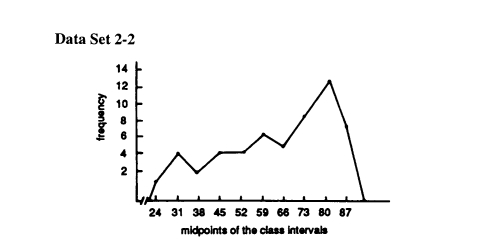
-The distribution in Data Set 2-2 is
A) positively skewed
B) negatively skewed
C) symmetrical
D) not skewed at all.
Question
-Referring to Data Set 2-2, the number of scores in the interval 59 - 66 is
A) 6
B) 5
C) 11
D) unknown, there is no such interval in Data Set 2-2.
Question
Data Set 2-3 The graph in Data Set 2-3 is based on registration figures by the American Kennel Club.
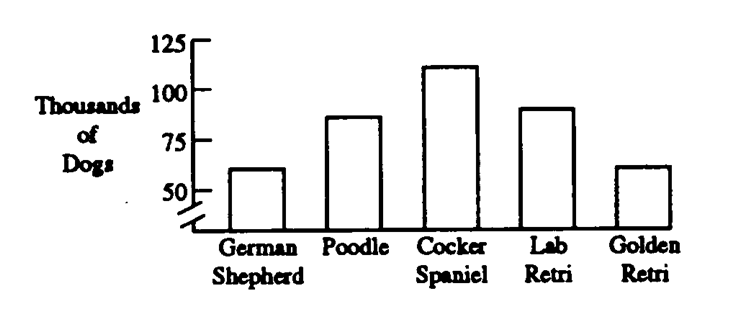
-The proper name for the graph in Data Set 2-3 is
A) frequency polygon
B) histogram
C) bar graph
D) line graph.
-The proper name for the graph in Data Set 2-3 is
A) frequency polygon
B) histogram
C) bar graph
D) line graph.
Question
Data Set 2-3 The graph in Data Set 2-3 is based on registration figures by the American Kennel Club.
-Data Set 2-3
A) is positively skewed
B) is negatively skewed
C) is not skewed
D) is not appropriate for a determination of skewness.
-Data Set 2-3
A) is positively skewed
B) is negatively skewed
C) is not skewed
D) is not appropriate for a determination of skewness.
Question
Question
Question
Question
Question
Question
Question
Question
Question
Question
Question
Question
Question
Question
Question
Question
Question
Question
Question
Question
Question
Question
Question
Question
Question
Question
Question
Question
Question
Question
Question
Question
Question
Question
Question
Question
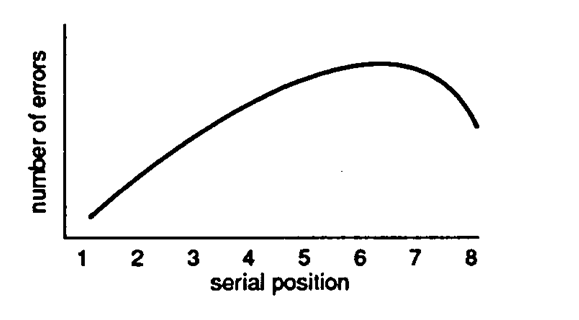
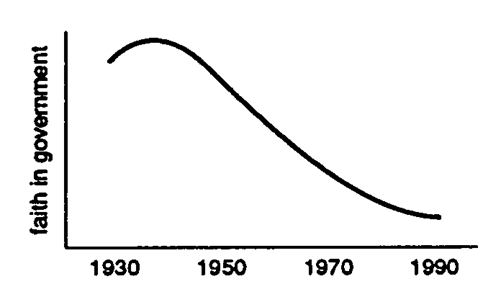
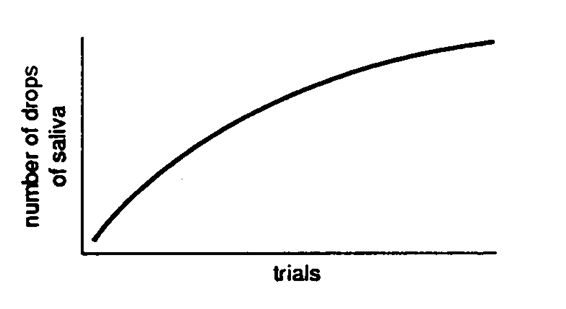
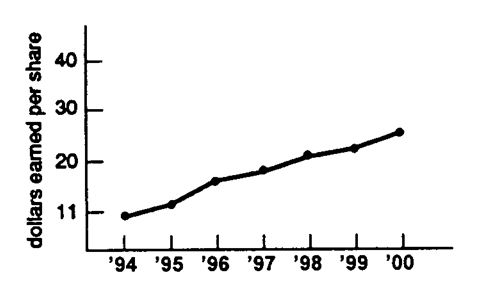
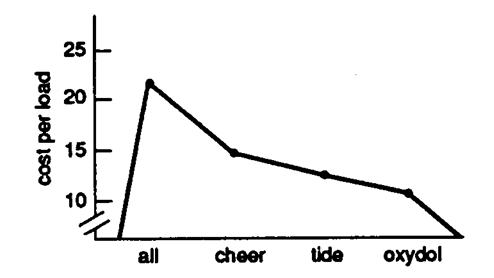
Describe each figure below as a frequency polygon, histogram, or line graph.
-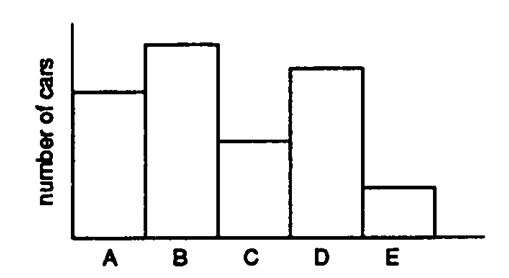
A) frequency polygon
B) histogram
C) line graph
-
A) frequency polygon
B) histogram
C) line graph
Question
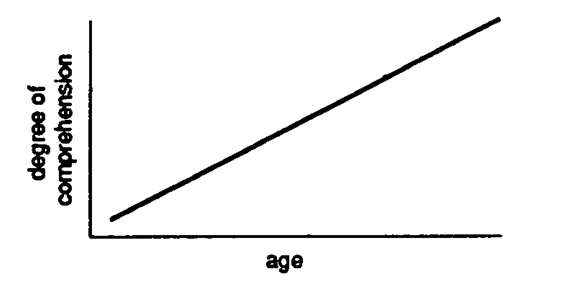
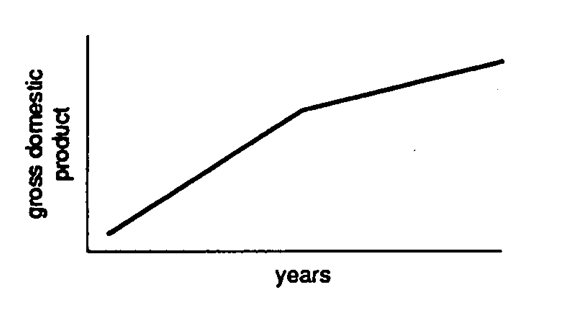
Describe each figure below as a frequency polygon, histogram, or line graph.
-
A) frequency polygon
B) histogram
C) line graph
-
A) frequency polygon
B) histogram
C) line graph
Question
Describe each figure below as a frequency polygon, histogram, or line graph.
-
A) frequency polygon
B) histogram
C) line graph
-
A) frequency polygon
B) histogram
C) line graph
Question
Describe each figure below as a frequency polygon, histogram, or line graph.
-
A) frequency polygon
B) histogram
C) line graph
-
A) frequency polygon
B) histogram
C) line graph
Question
Describe each figure below as a frequency polygon, histogram, or line graph.
-
A) frequency polygon
B) histogram
C) line graph
-
A) frequency polygon
B) histogram
C) line graph
Question
Describe each figure below as a frequency polygon, histogram, or line graph.
-
A) frequency polygon
B) histogram
C) line graph
-
A) frequency polygon
B) histogram
C) line graph
Question
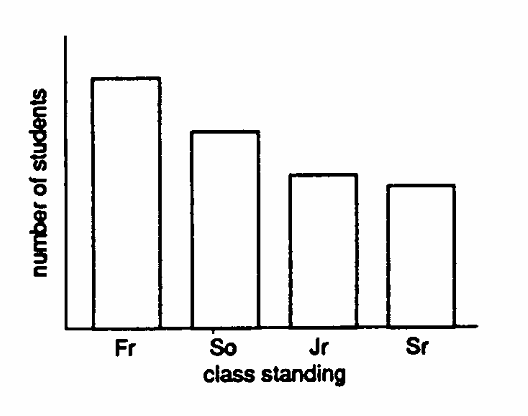
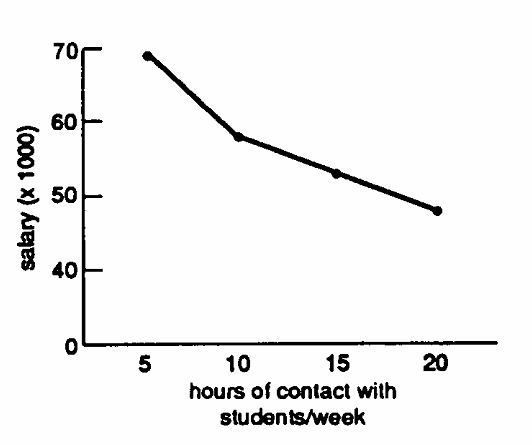
Identify each graph below as correct or incorrect. Describe what is wrong with each incorrect one.
-
A) correct
B) incorrect
-
A) correct
B) incorrect
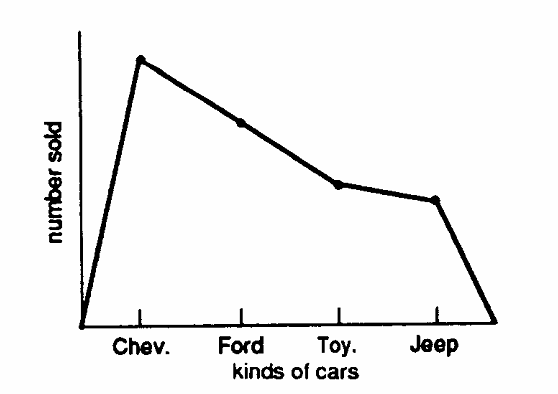
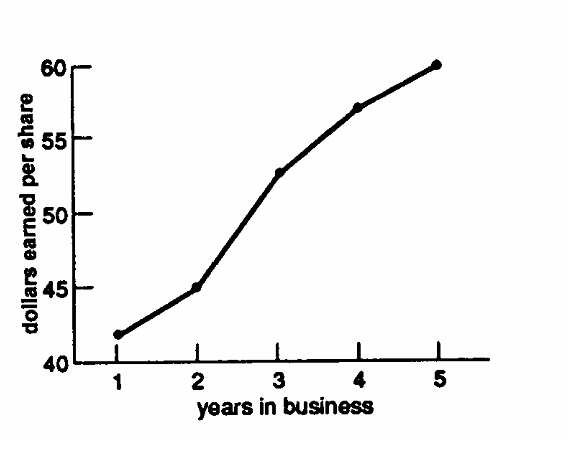
Question
Identify each graph below as correct or incorrect. Describe what is wrong with each incorrect one.
-
A) correct
B) incorrect
-
A) correct
B) incorrect
Question
Identify each graph below as correct or incorrect. Describe what is wrong with each incorrect one.
-
A) correct
B) incorrect
-
A) correct
B) incorrect
Question
Identify each graph below as correct or incorrect. Describe what is wrong with each incorrect one.
-
A) correct
B) incorrect
-
A) correct
B) incorrect
Question
Describe each graph below as correct or incorrect. Tell what is wrong with the incorrect one(s).
-
A) correct
B) incorrect
-
A) correct
B) incorrect
Question
Describe each graph below as correct or incorrect. Tell what is wrong with the incorrect one(s).
-
A) correct
B) incorrect
-
A) correct
B) incorrect

Unlock Deck
Sign up to unlock the cards in this deck!
Unlock Deck
Unlock Deck
1/94
Play
Full screen (f)
Deck 2: Exploring Data: Frequency Distributions and Graphs
1
Simple frequency distributions have class intervals that cover two or more scores.
False
2
Horizontal axis, X-axis, and abscissa are all names for the same line.
True
3
A bar graph is used to present the frequencies of a quantitative variable.
False
4
A bar graph is the proper graph for the frequency distribution of Satisfaction With Life Scale scores.
Unlock Deck
Unlock for access to all 94 flashcards in this deck.
Unlock Deck
k this deck
5
Bell-shaped and rectangular distributions are symmetrical.
Unlock Deck
Unlock for access to all 94 flashcards in this deck.
Unlock Deck
k this deck
6
A negatively skewed curve has a thin point directed to the right side of a graph.
Unlock Deck
Unlock for access to all 94 flashcards in this deck.
Unlock Deck
k this deck
7
A line graph shows the relationship between two variables.
Unlock Deck
Unlock for access to all 94 flashcards in this deck.
Unlock Deck
k this deck
8
Line graphs are used more extensively in psychology textbooks and journal articles than frequency polygons.
Unlock Deck
Unlock for access to all 94 flashcards in this deck.
Unlock Deck
k this deck
9
Your text says that the primary use of graphs is to show results to others.
Unlock Deck
Unlock for access to all 94 flashcards in this deck.
Unlock Deck
k this deck
10
Tally marks are not part of a formal presentation of a simple frequency distribution.
Unlock Deck
Unlock for access to all 94 flashcards in this deck.
Unlock Deck
k this deck
11
Vertical axis, Y-axis, and abscissa are all names for the same line.
Unlock Deck
Unlock for access to all 94 flashcards in this deck.
Unlock Deck
k this deck
12
A frequency polygon and a bar graph can be used for the same frequency distribution.
Unlock Deck
Unlock for access to all 94 flashcards in this deck.
Unlock Deck
k this deck
13
A histogram is used to present the frequencies of a qualitative variable.
Unlock Deck
Unlock for access to all 94 flashcards in this deck.
Unlock Deck
k this deck
14
The proper graph for the frequency distribution of college majors is a bar graph.
Unlock Deck
Unlock for access to all 94 flashcards in this deck.
Unlock Deck
k this deck
15
A distribution with two humps is called a skewed distribution.
Unlock Deck
Unlock for access to all 94 flashcards in this deck.
Unlock Deck
k this deck
16
A positively skewed curve has a thin point directed to the right side of a graph.
Unlock Deck
Unlock for access to all 94 flashcards in this deck.
Unlock Deck
k this deck
17
A line graph and a frequency polygon can be used interchangeably.
Unlock Deck
Unlock for access to all 94 flashcards in this deck.
Unlock Deck
k this deck
18
Line graphs are used more extensively in psychology textbooks and journal articles than bar graphs.
Unlock Deck
Unlock for access to all 94 flashcards in this deck.
Unlock Deck
k this deck
19
Your text shows a template that gives the proportions for the X and Y axis that is "almost guaranteed to produce a pleasant-looking graph."
Unlock Deck
Unlock for access to all 94 flashcards in this deck.
Unlock Deck
k this deck
20
Grouped frequency distributions have class intervals that cover two or more scores.
Unlock Deck
Unlock for access to all 94 flashcards in this deck.
Unlock Deck
k this deck
21
Horizontal axis, X-axis, and ordinate are all names for the same line.
Unlock Deck
Unlock for access to all 94 flashcards in this deck.
Unlock Deck
k this deck
22
A histogram and a bar graph can be used for the same frequency distribution.
Unlock Deck
Unlock for access to all 94 flashcards in this deck.
Unlock Deck
k this deck
23
A bar graph is used to present the frequencies of a qualitative variable.
Unlock Deck
Unlock for access to all 94 flashcards in this deck.
Unlock Deck
k this deck
24
To show the relationship between serial position of words on a list and errors, the proper graph is a line graph.
Unlock Deck
Unlock for access to all 94 flashcards in this deck.
Unlock Deck
k this deck
25
A positively skewed curve has a thin point directed to the left side of a graph.
Unlock Deck
Unlock for access to all 94 flashcards in this deck.
Unlock Deck
k this deck
26
Bar graphs are used more extensively in psychology textbooks and journal articles than line graphs.
Unlock Deck
Unlock for access to all 94 flashcards in this deck.
Unlock Deck
k this deck
27
Graphs are used by scientists in the early stages of a project, even before data are collected
Unlock Deck
Unlock for access to all 94 flashcards in this deck.
Unlock Deck
k this deck
28
Data Set 2-1
A student was interested in the structure of the families in the U.S. He sampled 29 of his 330 classmates and got the following answers to the question, "How many children are there in your family?"
3 , 1 , 2 , 2 , 4 , 2 , 1 , 2 , 2 , 1 , 3 , 2 , 3 , 3 , 4 , 2 , 2 , 1 , 3 , 5 , 1 , 1 , 3 , 5 , 2 , 4 , 7 , 1 , 2
-Referring to Data Set 2-1, the proper frequency distribution is:
A)
B)
C)
D) None of the other alternatives are correct.
Unlock Deck
Unlock for access to all 94 flashcards in this deck.
Unlock Deck
k this deck
29
Data Set 2-1
A student was interested in the structure of the families in the U.S. He sampled 29 of his 330 classmates and got the following answers to the question, "How many children are there in your family?"
3 , 1 , 2 , 2 , 4 , 2 , 1 , 2 , 2 , 1 , 3 , 2 , 3 , 3 , 4 , 2 , 2 , 1 , 3 , 5 , 1 , 1 , 3 , 5 , 2 , 4 , 7 , 1 , 2
-Referring to Data Set 2-1, the distribution of these scores is
A) positively skewed
B) negatively skewed
C) symmetrical
D) not skewed at all.
Unlock Deck
Unlock for access to all 94 flashcards in this deck.
Unlock Deck
k this deck
30
-The distribution in Data Set 2-2 is
A) positively skewed
B) negatively skewed
C) symmetrical
D) not skewed at all.
Unlock Deck
Unlock for access to all 94 flashcards in this deck.
Unlock Deck
k this deck
31
-Referring to Data Set 2-2, the number of scores in the interval 59 - 66 is
A) 6
B) 5
C) 11
D) unknown, there is no such interval in Data Set 2-2.
Unlock Deck
Unlock for access to all 94 flashcards in this deck.
Unlock Deck
k this deck
32
Data Set 2-3 The graph in Data Set 2-3 is based on registration figures by the American Kennel Club.
-The proper name for the graph in Data Set 2-3 is
A) frequency polygon
B) histogram
C) bar graph
D) line graph.
-The proper name for the graph in Data Set 2-3 is
A) frequency polygon
B) histogram
C) bar graph
D) line graph.
Unlock Deck
Unlock for access to all 94 flashcards in this deck.
Unlock Deck
k this deck
33
Data Set 2-3 The graph in Data Set 2-3 is based on registration figures by the American Kennel Club.
-Data Set 2-3
A) is positively skewed
B) is negatively skewed
C) is not skewed
D) is not appropriate for a determination of skewness.
-Data Set 2-3
A) is positively skewed
B) is negatively skewed
C) is not skewed
D) is not appropriate for a determination of skewness.
Unlock Deck
Unlock for access to all 94 flashcards in this deck.
Unlock Deck
k this deck
34
The horizontal axis of a graph of a frequency distribution is called
A) a line graph
B) the ordinate
C) the abscissa
D) a histogram.
A) a line graph
B) the ordinate
C) the abscissa
D) a histogram.
Unlock Deck
Unlock for access to all 94 flashcards in this deck.
Unlock Deck
k this deck
35
A formal grouped frequency distribution is characterized by
A) class intervals and tally marks
B) class intervals and no tally marks
C) scores and tally marks
D) scores and no tally marks.
A) class intervals and tally marks
B) class intervals and no tally marks
C) scores and tally marks
D) scores and no tally marks.
Unlock Deck
Unlock for access to all 94 flashcards in this deck.
Unlock Deck
k this deck
36
A rough-draft grouped frequency distribution is characterized by
A) class intervals and tally marks
B) class intervals and no tally marks
C) scores and tally marks
D) scores and no tally marks.
A) class intervals and tally marks
B) class intervals and no tally marks
C) scores and tally marks
D) scores and no tally marks.
Unlock Deck
Unlock for access to all 94 flashcards in this deck.
Unlock Deck
k this deck
37
Which of the following intervals has a midpoint of 7?
A) 5-7
B) 3-7
C) 5-9
D) none of the other alternatives are correct.
A) 5-7
B) 3-7
C) 5-9
D) none of the other alternatives are correct.
Unlock Deck
Unlock for access to all 94 flashcards in this deck.
Unlock Deck
k this deck
38
Which of the following class intervals has a midpoint of 45?
A) 40-45
B) 45-50
C) 43-47
D) none of the other alternatives are correct.
A) 40-45
B) 45-50
C) 43-47
D) none of the other alternatives are correct.
Unlock Deck
Unlock for access to all 94 flashcards in this deck.
Unlock Deck
k this deck
39
Grouped frequency distributions and simple frequency distributions differ in
A) the type of data displayed
B) the range of scores covered by the distribution
C) the conclusions that can be drawn about skewness
D) all of the other alternatives are correct.
A) the type of data displayed
B) the range of scores covered by the distribution
C) the conclusions that can be drawn about skewness
D) all of the other alternatives are correct.
Unlock Deck
Unlock for access to all 94 flashcards in this deck.
Unlock Deck
k this deck
40
Suppose you had frequency counts of people who were listening to one of four radio stations. The appropriate graph for such data would be a
A) frequency polygon
B) histogram
C) bar graph
D) line graph.
A) frequency polygon
B) histogram
C) bar graph
D) line graph.
Unlock Deck
Unlock for access to all 94 flashcards in this deck.
Unlock Deck
k this deck
41
Suppose you had frequency counts of sparrows, starlings, swans, swallows, sandpipers, and sapsuckers. The appropriate graph for such data would be a
A) bar graph
B) histogram
C) frequency polygon
D) line graph.
A) bar graph
B) histogram
C) frequency polygon
D) line graph.
Unlock Deck
Unlock for access to all 94 flashcards in this deck.
Unlock Deck
k this deck
42
A line graph is used
A) in place of a frequency polygon
B) in place of a histogram
C) in place of a bar graph
D) to present the relationship between two variables.
A) in place of a frequency polygon
B) in place of a histogram
C) in place of a bar graph
D) to present the relationship between two variables.
Unlock Deck
Unlock for access to all 94 flashcards in this deck.
Unlock Deck
k this deck
43
A frequency polygon and a histogram are alike in that they both
A) are used to graph nominal scale data
B) are examples of a line graph
C) are used to graph empirical frequency distributions
D) all of the other alternatives are correct
A) are used to graph nominal scale data
B) are examples of a line graph
C) are used to graph empirical frequency distributions
D) all of the other alternatives are correct
Unlock Deck
Unlock for access to all 94 flashcards in this deck.
Unlock Deck
k this deck
44
To graph the relationship between years and the number of automobile accidents, use
A) frequency polygon
B) histogram
C) bar graph
D) line graph.
A) frequency polygon
B) histogram
C) bar graph
D) line graph.
Unlock Deck
Unlock for access to all 94 flashcards in this deck.
Unlock Deck
k this deck
45
To graph the relationship between age and auditory sensitivity, use a
A) frequency polygon
B) histogram
C) bar graph
D) line graph.
A) frequency polygon
B) histogram
C) bar graph
D) line graph.
Unlock Deck
Unlock for access to all 94 flashcards in this deck.
Unlock Deck
k this deck
46
The graph that is used to present data on two variables rather than one is the
A) frequency polygon
B) histogram
C) bar graph
D) line graph.
A) frequency polygon
B) histogram
C) bar graph
D) line graph.
Unlock Deck
Unlock for access to all 94 flashcards in this deck.
Unlock Deck
k this deck
47
The best way to determine if a graph is a histogram or a bar graph is to look at
A) the height of the bars
B) whether the bars are wide or narrow
C) the kind of variable on the Y axis
D) the kind of variable on the X axis.
A) the height of the bars
B) whether the bars are wide or narrow
C) the kind of variable on the Y axis
D) the kind of variable on the X axis.
Unlock Deck
Unlock for access to all 94 flashcards in this deck.
Unlock Deck
k this deck
48
Which alternative has elements that are congruent (all belong together)?
A) X axis/ ordinate/ to the right is positive
B) Y axis/ abscissa/ up is positive
C) Y axis/ abscissa/ right is positive
D) X axis/ abscissa/ to the right is positive.
A) X axis/ ordinate/ to the right is positive
B) Y axis/ abscissa/ up is positive
C) Y axis/ abscissa/ right is positive
D) X axis/ abscissa/ to the right is positive.
Unlock Deck
Unlock for access to all 94 flashcards in this deck.
Unlock Deck
k this deck
49
The graphic in the text showing the majors of college graduates was a
A) histogram
B) frequency polygon
C) bar graph
D) line graph.
A) histogram
B) frequency polygon
C) bar graph
D) line graph.
Unlock Deck
Unlock for access to all 94 flashcards in this deck.
Unlock Deck
k this deck
50
Assume you collect data from psychology majors who indicate their favorite class in psychology. Students choose from five classes. What kind of graph should you use to display the data?
A) histogram
B) bar graph
C) line graph
D) not enough information to answer this question.
A) histogram
B) bar graph
C) line graph
D) not enough information to answer this question.
Unlock Deck
Unlock for access to all 94 flashcards in this deck.
Unlock Deck
k this deck
51
A distribution shaped like a box is a_______________distribution; one that has two peaks is a ____________ distribution.
A) bell-shaped rectangular
B) rectangular bimodal
C) bimodal bell-shaped
D) bimodal bell-shaped.
A) bell-shaped rectangular
B) rectangular bimodal
C) bimodal bell-shaped
D) bimodal bell-shaped.
Unlock Deck
Unlock for access to all 94 flashcards in this deck.
Unlock Deck
k this deck
52
The distribution not described in the text was the
A) rectangular curve
B) triangular curve
C) bimodal curve
D) bell-shaped curve.
A) rectangular curve
B) triangular curve
C) bimodal curve
D) bell-shaped curve.
Unlock Deck
Unlock for access to all 94 flashcards in this deck.
Unlock Deck
k this deck
53
A distribution with two separated peaks is a__________distribution; one that is normal is a ___________distribution.
A) bimodal rectangular
B) rectangular bimodal
C) bimodal bell-shaped
D) rectangular bell-shaped.
A) bimodal rectangular
B) rectangular bimodal
C) bimodal bell-shaped
D) rectangular bell-shaped.
Unlock Deck
Unlock for access to all 94 flashcards in this deck.
Unlock Deck
k this deck
54
The normal distribution is a special case of a
A) skewed distribution
B) bell-shaped distribution
C) rectangular distribution
D) bimodal distribution.
A) skewed distribution
B) bell-shaped distribution
C) rectangular distribution
D) bimodal distribution.
Unlock Deck
Unlock for access to all 94 flashcards in this deck.
Unlock Deck
k this deck
55
The serial position effect was displayed in the text with mean errors on the ordinate and serial position on the abscissa. This graphic is an example of a
A) frequency polygon
B) histogram
C) bar graph
D) line graph.
A) frequency polygon
B) histogram
C) bar graph
D) line graph.
Unlock Deck
Unlock for access to all 94 flashcards in this deck.
Unlock Deck
k this deck
56
The serial position effect shows that when material is learned in order, the most difficult part
A) is near the beginning
B) is near the middle
C) is near the end
D) depends on whether the material is numerical, poetry or prose.
A) is near the beginning
B) is near the middle
C) is near the end
D) depends on whether the material is numerical, poetry or prose.
Unlock Deck
Unlock for access to all 94 flashcards in this deck.
Unlock Deck
k this deck
57
Suppose a frequency distribution with a range of 0 to 100 was severely negatively skewed. The greatest frequency of scores would be clustered near
A) 0
B) 50
C) 100
D) unknown not enough information is given.
A) 0
B) 50
C) 100
D) unknown not enough information is given.
Unlock Deck
Unlock for access to all 94 flashcards in this deck.
Unlock Deck
k this deck
58
If a set of scores ranged from 50 to 99 and the distribution was negatively skewed, you would expect to find the fewest scores in the interval
A) 50 to 59
B) 60 to 69
C) 80 to 89
D) 90 to 99.
A) 50 to 59
B) 60 to 69
C) 80 to 89
D) 90 to 99.
Unlock Deck
Unlock for access to all 94 flashcards in this deck.
Unlock Deck
k this deck
59
The frequency distribution scores ranged from 0 to 100. Low scores were infrequent, there were a moderate number around 50, and near 100 scores were quite frequent. The distribution is
A) positively skewed
B) negatively skewed
C) symmetrical
D) not enough information is given.
A) positively skewed
B) negatively skewed
C) symmetrical
D) not enough information is given.
Unlock Deck
Unlock for access to all 94 flashcards in this deck.
Unlock Deck
k this deck
60
Skewness refers to
A) the shape of the curve
B) the number of items in the curve
C) the standard error in the curve
D) none of the other alternatives are correct.
A) the shape of the curve
B) the number of items in the curve
C) the standard error in the curve
D) none of the other alternatives are correct.
Unlock Deck
Unlock for access to all 94 flashcards in this deck.
Unlock Deck
k this deck
61
Suppose a frequency distribution with a range of 0 to 100 was severely positively skewed. The greatest frequency of scores would be clustered near
A) 20
B) 50
C) 80
D) unknown not enough information is given
A) 20
B) 50
C) 80
D) unknown not enough information is given
Unlock Deck
Unlock for access to all 94 flashcards in this deck.
Unlock Deck
k this deck
62
Suppose a frequency distribution with a range of 0 to 100 was positively skewed. The greatest frequency of scores would be expected around
A) 25
B) 50
C) 75
D) any of the other alternatives are possible for a positively skewed distribution.
A) 25
B) 50
C) 75
D) any of the other alternatives are possible for a positively skewed distribution.
Unlock Deck
Unlock for access to all 94 flashcards in this deck.
Unlock Deck
k this deck
63
When a curve has a shape with two peaks, it is called
A) normal
B) skewed
C) rectangular
D) bimodal.
A) normal
B) skewed
C) rectangular
D) bimodal.
Unlock Deck
Unlock for access to all 94 flashcards in this deck.
Unlock Deck
k this deck
64
Graphs are popular because they
A) allow comparisons to other studies when designing a project
B) help guide future research
C) serve as a clear description of previous research
D) all of the other alternatives are correct.
A) allow comparisons to other studies when designing a project
B) help guide future research
C) serve as a clear description of previous research
D) all of the other alternatives are correct.
Unlock Deck
Unlock for access to all 94 flashcards in this deck.
Unlock Deck
k this deck
65
The development of graphics as we know them today
A) ended about 1900
B) ended about 1950
C) ended about 1975
D) continue, new designs are still being created.
A) ended about 1900
B) ended about 1950
C) ended about 1975
D) continue, new designs are still being created.
Unlock Deck
Unlock for access to all 94 flashcards in this deck.
Unlock Deck
k this deck
66
Describe what the following graphs are used for.
a. line graph
b. frequency polygon
c. histogram
d. bar graph
a. line graph
b. frequency polygon
c. histogram
d. bar graph
Unlock Deck
Unlock for access to all 94 flashcards in this deck.
Unlock Deck
k this deck
67
Describe the distinguishing characteristics of the histogram, line graph, and frequency polygon.
Unlock Deck
Unlock for access to all 94 flashcards in this deck.
Unlock Deck
k this deck
68
Under what conditions would you choose to use a histogram rather than a bar graph?
Unlock Deck
Unlock for access to all 94 flashcards in this deck.
Unlock Deck
k this deck
69
Describe each figure below as a frequency polygon, histogram, or line graph.
-
A) frequency polygon
B) histogram
C) line graph
-
A) frequency polygon
B) histogram
C) line graph
Unlock Deck
Unlock for access to all 94 flashcards in this deck.
Unlock Deck
k this deck
70
Describe each figure below as a frequency polygon, histogram, or line graph.
-
A) frequency polygon
B) histogram
C) line graph
-
A) frequency polygon
B) histogram
C) line graph
Unlock Deck
Unlock for access to all 94 flashcards in this deck.
Unlock Deck
k this deck
71
Describe each figure below as a frequency polygon, histogram, or line graph.
-
A) frequency polygon
B) histogram
C) line graph
-
A) frequency polygon
B) histogram
C) line graph
Unlock Deck
Unlock for access to all 94 flashcards in this deck.
Unlock Deck
k this deck
72
Describe each figure below as a frequency polygon, histogram, or line graph.
-
A) frequency polygon
B) histogram
C) line graph
-
A) frequency polygon
B) histogram
C) line graph
Unlock Deck
Unlock for access to all 94 flashcards in this deck.
Unlock Deck
k this deck
73
Describe each figure below as a frequency polygon, histogram, or line graph.
-
A) frequency polygon
B) histogram
C) line graph
-
A) frequency polygon
B) histogram
C) line graph
Unlock Deck
Unlock for access to all 94 flashcards in this deck.
Unlock Deck
k this deck
74
Describe each figure below as a frequency polygon, histogram, or line graph.
-
A) frequency polygon
B) histogram
C) line graph
-
A) frequency polygon
B) histogram
C) line graph
Unlock Deck
Unlock for access to all 94 flashcards in this deck.
Unlock Deck
k this deck
75
Identify each graph below as correct or incorrect. Describe what is wrong with each incorrect one.
-
A) correct
B) incorrect
-
A) correct
B) incorrect
Unlock Deck
Unlock for access to all 94 flashcards in this deck.
Unlock Deck
k this deck
76
Identify each graph below as correct or incorrect. Describe what is wrong with each incorrect one.
-
A) correct
B) incorrect
-
A) correct
B) incorrect
Unlock Deck
Unlock for access to all 94 flashcards in this deck.
Unlock Deck
k this deck
77
Identify each graph below as correct or incorrect. Describe what is wrong with each incorrect one.
-
A) correct
B) incorrect
-
A) correct
B) incorrect
Unlock Deck
Unlock for access to all 94 flashcards in this deck.
Unlock Deck
k this deck
78
Identify each graph below as correct or incorrect. Describe what is wrong with each incorrect one.
-
A) correct
B) incorrect
-
A) correct
B) incorrect
Unlock Deck
Unlock for access to all 94 flashcards in this deck.
Unlock Deck
k this deck
79
Describe each graph below as correct or incorrect. Tell what is wrong with the incorrect one(s).
-
A) correct
B) incorrect
-
A) correct
B) incorrect
Unlock Deck
Unlock for access to all 94 flashcards in this deck.
Unlock Deck
k this deck
80
Describe each graph below as correct or incorrect. Tell what is wrong with the incorrect one(s).
-
A) correct
B) incorrect
-
A) correct
B) incorrect
Unlock Deck
Unlock for access to all 94 flashcards in this deck.
Unlock Deck
k this deck
Unlock Deck
Unlock for access to all 94 flashcards in this deck.


