Deck 5: Analyzing and Interpreting Financial Statements
Full screen (f)
Question
Question
Question
Question
Question
Question
Question
Question
Question
Question
Question
Question
Question
Question
Question
Question
Question
Question
Question
Question
Question
Question
Question
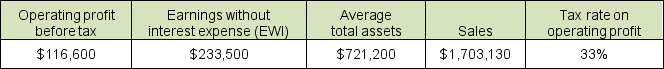
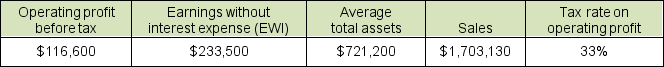
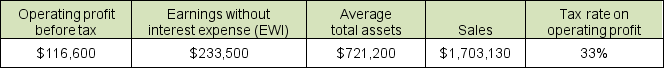
Use the following selected balance sheet and income statement information for Sirius Supply Co. to compute the profit margin, to the nearest hundredth of a percent.
A) 6.85%
B) 32.38%
C) 13.71%
D) 9.19%
A) 6.85%
B) 32.38%
C) 13.71%
D) 9.19%
Question
Use the following selected balance sheet and income statement information for Sirius Supply Co. to compute ROA, to the nearest hundredth.
A) 27.30%
B) 13.71%
C) 16.17%
D) 32.38%
A) 27.30%
B) 13.71%
C) 16.17%
D) 32.38%
Question
Use the following selected balance sheet and income statement information for Sirius Supply Co. to compute asset turnover, to the nearest hundredth of a percent.
A) 0.32
B) 0.16
C) 2.36
D) 1.53
A) 0.32
B) 0.16
C) 2.36
D) 1.53
Question
Question
Selected balance sheet and income statement information from the 2016 fiscal year end for American Symbol Outfitters follows in thousands:
 A. Calculate the company's return on equity (ROE).
B. Explain what information this provides to management.
A. Calculate the company's return on equity (ROE).B. Explain what information this provides to management.
Question
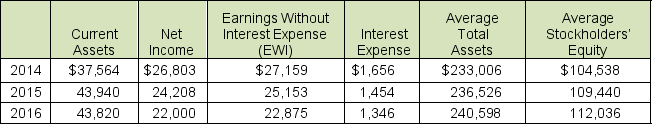
Peter Gilgen & Co.'s (PG & Co.) recent balance sheet (fiscal year 2016) reported average equity of $112,036 and average total assets of $240,598. Assume that the company's statutory tax rate is 35%. PG & Co.'s recent income statement showed the following):
 A. Calculate the income tax rate on earnings before income taxes.
B. How much is EWI?
C. Calculate ROE and ROA.
A. Calculate the income tax rate on earnings before income taxes.B. How much is EWI?
C. Calculate ROE and ROA.
Question
Selected balance sheet and income statement information from the 2016 fiscal year end for Arrows follows:
 A. Compute return on net operating profit (RNOA).
B. Show that RNOA = Net operating profit margin (NOPM) × Net operating asset turnover (NOAT)
A. Compute return on net operating profit (RNOA).B. Show that RNOA = Net operating profit margin (NOPM) × Net operating asset turnover (NOAT)
Question
Selected balance sheet and income statement information from Edward Electric for fiscal years 2014 through 2016 follows:
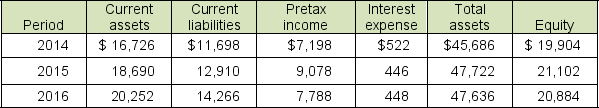 A. Compute times interest earned for each year and discuss any trends.
B. What concerns about Edward Electric's ability to meet its interest obligations might creditors have? Explain.
A. Compute times interest earned for each year and discuss any trends.B. What concerns about Edward Electric's ability to meet its interest obligations might creditors have? Explain.
Question
Selected 2016 balance sheet and income statement information for Cloud 9 Super Store and Big T follow:
 A. Calculate the current ratio and quick ratio for both companies.
B. Which company is more liquid?
C. Calculate the times interest earned and debt-to-equity ratio for both companies.
D. Which company is more solvent? Explain.
A. Calculate the current ratio and quick ratio for both companies.B. Which company is more liquid?
C. Calculate the times interest earned and debt-to-equity ratio for both companies.
D. Which company is more solvent? Explain.
Question
Selected 2016 balance sheet and income statement information for two manufacturing companies: Canyonlands, Inc. and Bryce Corporation follows:
 A. Calculate the current ratio and quick ratio for both companies.
B. Which company is more liquid?
C. Calculate the times interest earned and debt-to-equity ratio for both companies.
D. Which company is more solvent?
A. Calculate the current ratio and quick ratio for both companies.B. Which company is more liquid?
C. Calculate the times interest earned and debt-to-equity ratio for both companies.
D. Which company is more solvent?
Question
Selected recent balance sheet and income statement information for Shepherd, Inc. follows:
 A. Calculate accounts receivable turnover (ART) for 2016 and 2015. Has ART improved during the year or worsened?
B. Calculate inventory turnover (INVT) for 2016 and 2015. Has INVT improved during the year or worsened?
A. Calculate accounts receivable turnover (ART) for 2016 and 2015. Has ART improved during the year or worsened?B. Calculate inventory turnover (INVT) for 2016 and 2015. Has INVT improved during the year or worsened?
Question
Selected recent balance sheet and income statement information for Holiday Corporation follows:
 A Calculate accounts receivable turnover (ART) for 2016 and 2015. Has ART improved during the year or worsened?
B. Calculate inventory turnover (INVT) for 2016 and 2015. Has INVT improved during the year or worsened?
A Calculate accounts receivable turnover (ART) for 2016 and 2015. Has ART improved during the year or worsened?B. Calculate inventory turnover (INVT) for 2016 and 2015. Has INVT improved during the year or worsened?
Question
Selected recent balance sheet and income statement information for Catnip, Inc. follows:
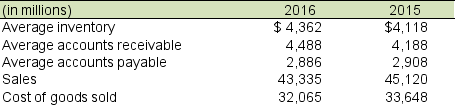 A. Calculate accounts receivable turnover (ART) for 2016 and 2015. Has ART improved during the year or worsened?
B. Calculate inventory turnover (INVT) for 2016 and 2015. Has INVT improved during the year or worsened?
A. Calculate accounts receivable turnover (ART) for 2016 and 2015. Has ART improved during the year or worsened?B. Calculate inventory turnover (INVT) for 2016 and 2015. Has INVT improved during the year or worsened?
Question
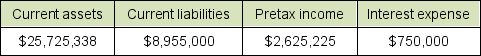
Use the selected balance sheet and income statement information below for Brahtz, Inc. to compute the times interest earned ratio. Explain what information this ratio provides.

Question
Use the selected balance sheet and income statement information below for Brahtz, Inc. to compute the current ratio. Explain what information this ratio provides.
Question
Selected 2016 balance sheet and income statement information for two large communication companies, Vista Communication, Inc., and American Phone, Inc., follow:
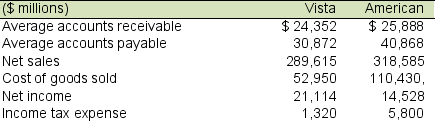 A. Compute accounts receivable turnover for Vista Communications Inc. and American Phone.
B. Interpret and comment on the differences between the receivables turnover rates between each company assuming the industry average is 9.0 times.
A. Compute accounts receivable turnover for Vista Communications Inc. and American Phone.B. Interpret and comment on the differences between the receivables turnover rates between each company assuming the industry average is 9.0 times.
Question
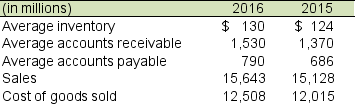
Selected 2016 balance sheet and income statement information for an office supply retailer, Office Supply, Inc., follows (in $ millions):
 Compute accounts receivable turnover and inventory turnover for Office Supply, Inc.
Compute accounts receivable turnover and inventory turnover for Office Supply, Inc. Question
Selected balance sheet and income statement information for Peter Gilgen & Co. for 2014 through 2016 follows (millions):
 Compute the return on financial leverage for each year. Interpret these values for Peter Gilgen & Co.
Compute the return on financial leverage for each year. Interpret these values for Peter Gilgen & Co. Question
Selected balance sheet and income statement information for jewelry retailer, Sparkle & Co. for 2014 through 2016 follows:
 A. Compute the current ratio for each year and discuss any trends. Do you feel that the company is sufficiently liquid? Explain. What additional information might be helpful in analyzing the liquidity?
B. Compute times interest earned for each year and discuss any trends. Do you have any concerns about its level of financial leverage and its ability to meet interest obligations? Explain.
A. Compute the current ratio for each year and discuss any trends. Do you feel that the company is sufficiently liquid? Explain. What additional information might be helpful in analyzing the liquidity?B. Compute times interest earned for each year and discuss any trends. Do you have any concerns about its level of financial leverage and its ability to meet interest obligations? Explain.
Question
Selected 2016 balance sheet and income statement information from Trunk, Inc. and Taylor S. follows:
 A. Compute the following turnover rates for each company:
1. Accounts receivable turnover
2. Inventory turnover
3. Asset turnover
B. Interpret and comment on any differences you observe between the turnover rates for these two companies. What are some characteristics of their respective businesses that would likely lead to the differences identified?
A. Compute the following turnover rates for each company:1. Accounts receivable turnover
2. Inventory turnover
3. Asset turnover
B. Interpret and comment on any differences you observe between the turnover rates for these two companies. What are some characteristics of their respective businesses that would likely lead to the differences identified?
Question
The balance sheets and income statements for Omni Communications follow:
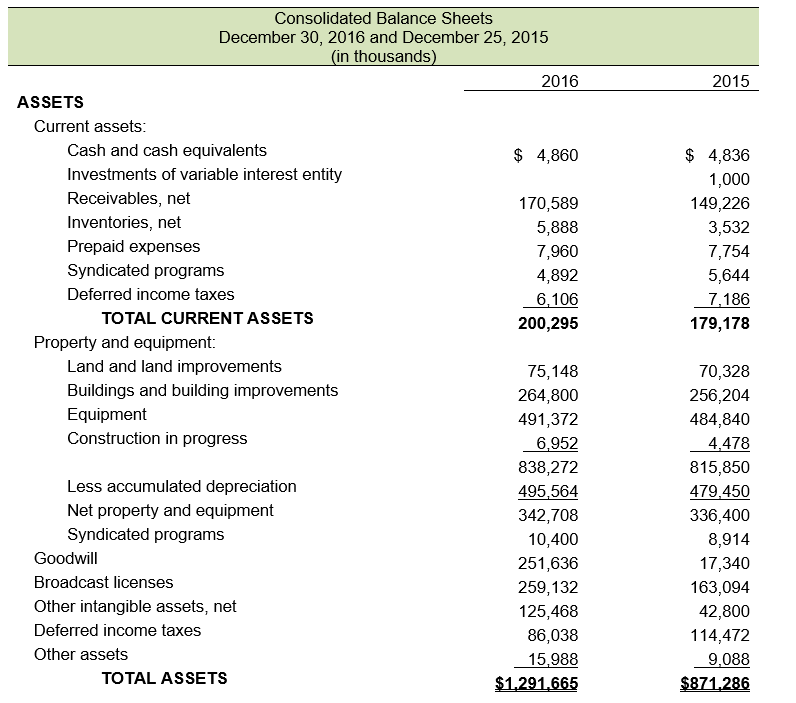
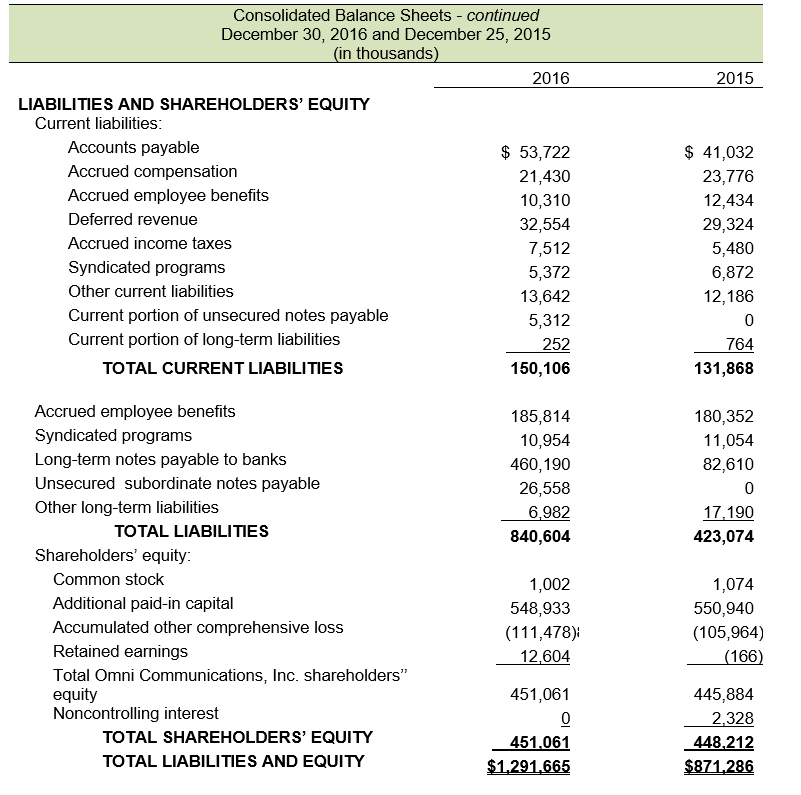
 A. Compute the company's current ratio for 2016 and 2015. Comment on any observed trend.
B. Compute the company's times interest earned and debt-to-equity ratio for 2016 and 2015. Comment on any observed trend.
C. Summarize your findings in a conclusion about the company's liquidity and solvency. Do you have any concerns about the company's ability to meet its debt obligations?
A. Compute the company's current ratio for 2016 and 2015. Comment on any observed trend.B. Compute the company's times interest earned and debt-to-equity ratio for 2016 and 2015. Comment on any observed trend.
C. Summarize your findings in a conclusion about the company's liquidity and solvency. Do you have any concerns about the company's ability to meet its debt obligations?
Question
Selected balance sheet and income statement information for the office supply retailer, Office Supply, Inc., for FY 2014 through FY 2016 follows:
 A. Compute the current ratio for each year and discuss any trends. Do you feel that the company is sufficiently liquid? Explain. What additional information might be helpful in analyzing the liquidity?
B. Compute times interest earned ratio for each year and discuss any trends. Do you have any concerns about its level of financial leverage and its ability to meet interest obligations? Explain.
A. Compute the current ratio for each year and discuss any trends. Do you feel that the company is sufficiently liquid? Explain. What additional information might be helpful in analyzing the liquidity?B. Compute times interest earned ratio for each year and discuss any trends. Do you have any concerns about its level of financial leverage and its ability to meet interest obligations? Explain.
Question
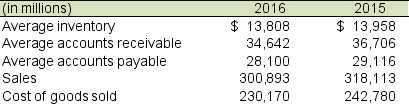
The partial balance sheets and income statements for Peter Gilgen & Co. for fiscal years ending June 30, 2016 and 2015 follow:
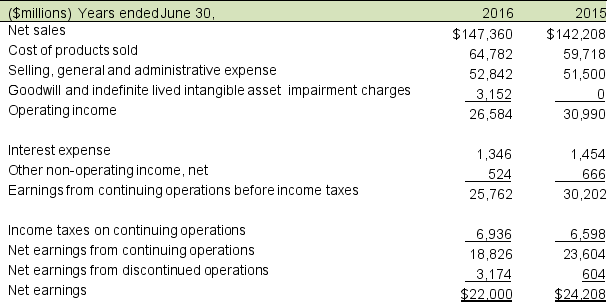 A. Calculate accounts receivable turnover (ART) for 2016 and 2015. Accounts receivable in 2014 totaled $10,670 million. Has ART improved during the year or worsened?
B. Calculate inventory turnover (INVT) for 2016 and 2015. Inventories in 2014 were $12,768 million. Has INVT improved during the year or worsened?
C. Calculate asset turnover (AT) for 2016 and 2015 considering that 2014 total assets are $256,344 million. Has AT improved during the year or worsened?
A. Calculate accounts receivable turnover (ART) for 2016 and 2015. Accounts receivable in 2014 totaled $10,670 million. Has ART improved during the year or worsened?B. Calculate inventory turnover (INVT) for 2016 and 2015. Inventories in 2014 were $12,768 million. Has INVT improved during the year or worsened?
C. Calculate asset turnover (AT) for 2016 and 2015 considering that 2014 total assets are $256,344 million. Has AT improved during the year or worsened?
Question
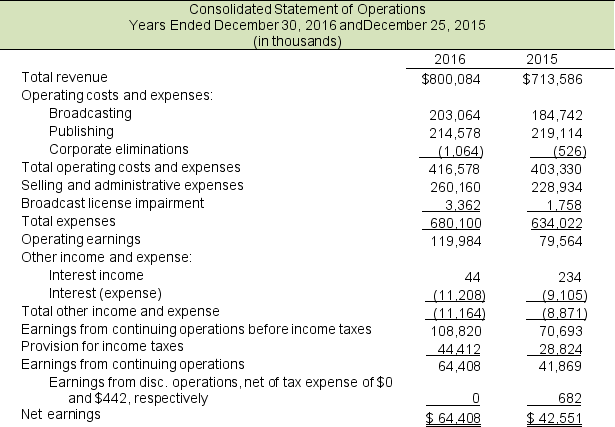
The income statements for Bullseye Corporation for fiscal years 2015, 2014, and 2013 (years ending January 30, 2016, January 31, 2015, and February 1, 2014, respectively) follow:
 A. Prepare a common-size income statement for 2015 and 2014.
B. Comment on the most significant changes.
A. Prepare a common-size income statement for 2015 and 2014.B. Comment on the most significant changes.
Question
The income statements for Bullseye Corporation for fiscal years 2015, 2014, and 2013 follow:
 Prepare a pro-forma income statement for 2016 for Bullseye assuming the following:
A. Total revenues are $142,000 million.
B. Cost of sales is 68% of net sales.
C. Selling, general and administrative expenses increase by 10% from 2015. Credit card expense increases by 12%.
D. Depreciation increases by 5%
E. There is no gain on receivables held for sale.
F. Interest costs remain the same.
G. The effective income tax rate is 35%.
Prepare a pro-forma income statement for 2016 for Bullseye assuming the following:A. Total revenues are $142,000 million.
B. Cost of sales is 68% of net sales.
C. Selling, general and administrative expenses increase by 10% from 2015. Credit card expense increases by 12%.
D. Depreciation increases by 5%
E. There is no gain on receivables held for sale.
F. Interest costs remain the same.
G. The effective income tax rate is 35%.
Question
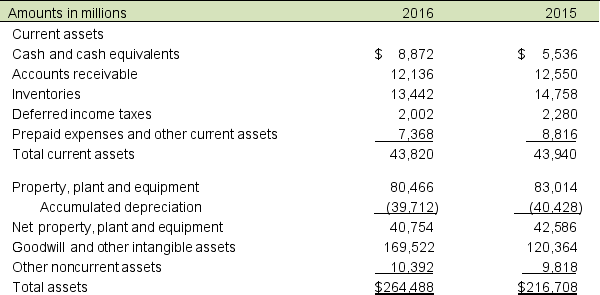
The balance sheets for Bullseye Corporation for the fiscal years 2015 and 2014, (years ending January 30, 2016 and January 31, 2015, respectively) follow:
 A. Prepare a common-size statements for the asset section of Bullseye's balance sheet for FY 2015 and FY 2014.
B. Comment on the most significant changes.
A. Prepare a common-size statements for the asset section of Bullseye's balance sheet for FY 2015 and FY 2014.B. Comment on the most significant changes.
Question
Question
Question

Unlock Deck
Sign up to unlock the cards in this deck!
Unlock Deck
Unlock Deck
1/51
Play
Full screen (f)
Deck 5: Analyzing and Interpreting Financial Statements
1
Asset turnover measures a company's profitability.
False
2
NOPAT is equivalent to income from operating activities.
False
3
If Company A is more profitable than Company B, then Company A will have a higher RNOA than Company B.
False
4
Highly leveraged firms have higher ROE than lower leveraged firms.
Unlock Deck
Unlock for access to all 51 flashcards in this deck.
Unlock Deck
k this deck
5
All else being equal, a higher financial leverage will increase a company's debt rating and decrease the interest rate it must pay.
Unlock Deck
Unlock for access to all 51 flashcards in this deck.
Unlock Deck
k this deck
6
Return on assets can be disaggregated into profit margin and an expense-to-sales ratio.
Unlock Deck
Unlock for access to all 51 flashcards in this deck.
Unlock Deck
k this deck
7
The times interest earned ratio reflects the number of times that the company earned interest during the year.
Unlock Deck
Unlock for access to all 51 flashcards in this deck.
Unlock Deck
k this deck
8
Charlie Plumbing Supplies has a return on assets (ROA) of 24%, while the industry average of similar companies is 13%. This means that Charlie Plumbing Supplies' asset turnover is higher than the industry average.
Unlock Deck
Unlock for access to all 51 flashcards in this deck.
Unlock Deck
k this deck
9
When determining forecasted revenues for proforma purposes, managers should consider economic conditions, potential company changes, and changes in the company's competitive environment.
Unlock Deck
Unlock for access to all 51 flashcards in this deck.
Unlock Deck
k this deck
10
All things equal, increasing turnover, increases:
A) Sales
B) Expenses
C) Assets
D) Shareholder value
A) Sales
B) Expenses
C) Assets
D) Shareholder value
Unlock Deck
Unlock for access to all 51 flashcards in this deck.
Unlock Deck
k this deck
11
Which one of the following ratios does not involve assets?
A) Account receivable turnover
B) Current ratio
C) Profit margin
D) Inventory turnover
A) Account receivable turnover
B) Current ratio
C) Profit margin
D) Inventory turnover
Unlock Deck
Unlock for access to all 51 flashcards in this deck.
Unlock Deck
k this deck
12
Which ratio provides an indication of the salability of the company's products?
A) Account receivable turnover
B) Current ratio
C) Inventory turnover
D) Gross profit margin
A) Account receivable turnover
B) Current ratio
C) Inventory turnover
D) Gross profit margin
Unlock Deck
Unlock for access to all 51 flashcards in this deck.
Unlock Deck
k this deck
13
What does the current ratio measure?
A) Solvency
B) Profitability
C) Short-term debt paying ability
D) Leverage
A) Solvency
B) Profitability
C) Short-term debt paying ability
D) Leverage
Unlock Deck
Unlock for access to all 51 flashcards in this deck.
Unlock Deck
k this deck
14
Liquidity analysis of a company includes the following useful measures: (select all that apply)
A) Current ratio
B) Quick ratio
C) Times interest earned
D) Working capital
A) Current ratio
B) Quick ratio
C) Times interest earned
D) Working capital
Unlock Deck
Unlock for access to all 51 flashcards in this deck.
Unlock Deck
k this deck
15
Which one of the following is removed from net income when determining NOPAT?
A) Cost of goods sold
B) Taxes on operating income
C) Selling, general and administrative expenses
D) Interest expense
A) Cost of goods sold
B) Taxes on operating income
C) Selling, general and administrative expenses
D) Interest expense
Unlock Deck
Unlock for access to all 51 flashcards in this deck.
Unlock Deck
k this deck
16
K Grocers' 2016 balance sheet shows average shareholders' equity of $9,264 million, net income of $1,505 million, and common shares issued of $1,918 million.
The company has no preferred shares issued. K Grocers' return on common equity for the year is:
A) 16.25%
B) 2.74%
C) 36.5%
D) There is not enough information to calculate the ratio
The company has no preferred shares issued. K Grocers' return on common equity for the year is:
A) 16.25%
B) 2.74%
C) 36.5%
D) There is not enough information to calculate the ratio
Unlock Deck
Unlock for access to all 51 flashcards in this deck.
Unlock Deck
k this deck
17
K Grocers' 2016 financial statements show average shareholders' equity of $9,264 million, net income of $1,505 million, interest expense of $870 million, and average total assets of $ 46,982 million.
How much is K Grocers' return on assets for the year? Assume that the statutory tax rate is 35%.
A) 16.2%
B) 5.1%
C) 4.4%
D) There is not enough information to calculate the ratio
How much is K Grocers' return on assets for the year? Assume that the statutory tax rate is 35%.
A) 16.2%
B) 5.1%
C) 4.4%
D) There is not enough information to calculate the ratio
Unlock Deck
Unlock for access to all 51 flashcards in this deck.
Unlock Deck
k this deck
18
K Grocers' 2016 financial statements show total operating assets of $45,004 million, total operating liabilities of $22,690 million, and net income totaling $1,505 million.
How much are K Grocers' net operating assets (NOA) for the year?
A) $45,004 million
B) $22,314 million
C) $67,694 million
D) There is not enough information to calculate the value
How much are K Grocers' net operating assets (NOA) for the year?
A) $45,004 million
B) $22,314 million
C) $67,694 million
D) There is not enough information to calculate the value
Unlock Deck
Unlock for access to all 51 flashcards in this deck.
Unlock Deck
k this deck
19
Into what two measures can return on net operating assets be disaggregated?
A) Profit margin and Return on equity
B) Net operating profit margin and Asset turnover
C) Net operating asset turnover and Return on equity
D) Net operating profit margin and Net operating asset turnover
A) Profit margin and Return on equity
B) Net operating profit margin and Asset turnover
C) Net operating asset turnover and Return on equity
D) Net operating profit margin and Net operating asset turnover
Unlock Deck
Unlock for access to all 51 flashcards in this deck.
Unlock Deck
k this deck
20
Which one of the following is not true concerning return on net operating assets?
A) An infinite number of combinations of net operating profit margin and net operating asset turnover will yield a given RNOA
B) When comparing companies in different industries, a higher profit margin always indicates which company has better management performance
C) In industries with relatively low operating asset turnover, a higher profit margin must be maintained to achieve sufficient RNOA
D) When analyzing conglomerates, analysts use a weighted average of margin and turnover rates to look at RNOA
Unlock Deck
Unlock for access to all 51 flashcards in this deck.
Unlock Deck
k this deck
21
K Grocers' 2016 financial statements show net income of $1,505 million, sales of $225,935 million, and average total assets of $46,982 million.
How much is K Grocers' asset turnover for the year?
A) 0.67
B) 4.81
C) 3.2
D) There is not enough information to calculate the ratio
How much is K Grocers' asset turnover for the year?
A) 0.67
B) 4.81
C) 3.2
D) There is not enough information to calculate the ratio
Unlock Deck
Unlock for access to all 51 flashcards in this deck.
Unlock Deck
k this deck
22
K Grocers' 2016 financial statements show interest expense of $870 million, net income of $1,505 million, sales of $225,935 million, and average total assets of $23,491 million. Assume that the statutory tax rate is 35%.
How much is K Grocers' profit margin for the year?
A) 0.92%
B) 1.05%
C) 8.81%
D) There is not enough information to calculate the ratio
How much is K Grocers' profit margin for the year?
A) 0.92%
B) 1.05%
C) 8.81%
D) There is not enough information to calculate the ratio
Unlock Deck
Unlock for access to all 51 flashcards in this deck.
Unlock Deck
k this deck
23
Use the following selected balance sheet and income statement information for Sirius Supply Co. to compute the profit margin, to the nearest hundredth of a percent.
A) 6.85%
B) 32.38%
C) 13.71%
D) 9.19%
A) 6.85%
B) 32.38%
C) 13.71%
D) 9.19%
Unlock Deck
Unlock for access to all 51 flashcards in this deck.
Unlock Deck
k this deck
24
Use the following selected balance sheet and income statement information for Sirius Supply Co. to compute ROA, to the nearest hundredth.
A) 27.30%
B) 13.71%
C) 16.17%
D) 32.38%
A) 27.30%
B) 13.71%
C) 16.17%
D) 32.38%
Unlock Deck
Unlock for access to all 51 flashcards in this deck.
Unlock Deck
k this deck
25
Use the following selected balance sheet and income statement information for Sirius Supply Co. to compute asset turnover, to the nearest hundredth of a percent.
A) 0.32
B) 0.16
C) 2.36
D) 1.53
A) 0.32
B) 0.16
C) 2.36
D) 1.53
Unlock Deck
Unlock for access to all 51 flashcards in this deck.
Unlock Deck
k this deck
26
Walkie Enterprises reported sales revenue totaling $1,120,000, $1,340,000, and $1,675,000 in the years, 2014, 2015, and 2016, respectively.
Performing horizontal analysis, what is the percentage change for 2016?
A) 25.00%
B) 38.16%
C) 47.16%
D) 14.11%
Performing horizontal analysis, what is the percentage change for 2016?
A) 25.00%
B) 38.16%
C) 47.16%
D) 14.11%
Unlock Deck
Unlock for access to all 51 flashcards in this deck.
Unlock Deck
k this deck
27
Selected balance sheet and income statement information from the 2016 fiscal year end for American Symbol Outfitters follows in thousands:
A. Calculate the company's return on equity (ROE).
B. Explain what information this provides to management.
A. Calculate the company's return on equity (ROE).B. Explain what information this provides to management.
Unlock Deck
Unlock for access to all 51 flashcards in this deck.
Unlock Deck
k this deck
28
Peter Gilgen & Co.'s (PG & Co.) recent balance sheet (fiscal year 2016) reported average equity of $112,036 and average total assets of $240,598. Assume that the company's statutory tax rate is 35%. PG & Co.'s recent income statement showed the following):
A. Calculate the income tax rate on earnings before income taxes.
B. How much is EWI?
C. Calculate ROE and ROA.
A. Calculate the income tax rate on earnings before income taxes.B. How much is EWI?
C. Calculate ROE and ROA.
Unlock Deck
Unlock for access to all 51 flashcards in this deck.
Unlock Deck
k this deck
29
Selected balance sheet and income statement information from the 2016 fiscal year end for Arrows follows:
A. Compute return on net operating profit (RNOA).
B. Show that RNOA = Net operating profit margin (NOPM) × Net operating asset turnover (NOAT)
A. Compute return on net operating profit (RNOA).B. Show that RNOA = Net operating profit margin (NOPM) × Net operating asset turnover (NOAT)
Unlock Deck
Unlock for access to all 51 flashcards in this deck.
Unlock Deck
k this deck
30
Selected balance sheet and income statement information from Edward Electric for fiscal years 2014 through 2016 follows:
A. Compute times interest earned for each year and discuss any trends.
B. What concerns about Edward Electric's ability to meet its interest obligations might creditors have? Explain.
A. Compute times interest earned for each year and discuss any trends.B. What concerns about Edward Electric's ability to meet its interest obligations might creditors have? Explain.
Unlock Deck
Unlock for access to all 51 flashcards in this deck.
Unlock Deck
k this deck
31
Selected 2016 balance sheet and income statement information for Cloud 9 Super Store and Big T follow:
A. Calculate the current ratio and quick ratio for both companies.
B. Which company is more liquid?
C. Calculate the times interest earned and debt-to-equity ratio for both companies.
D. Which company is more solvent? Explain.
A. Calculate the current ratio and quick ratio for both companies.B. Which company is more liquid?
C. Calculate the times interest earned and debt-to-equity ratio for both companies.
D. Which company is more solvent? Explain.
Unlock Deck
Unlock for access to all 51 flashcards in this deck.
Unlock Deck
k this deck
32
Selected 2016 balance sheet and income statement information for two manufacturing companies: Canyonlands, Inc. and Bryce Corporation follows:
A. Calculate the current ratio and quick ratio for both companies.
B. Which company is more liquid?
C. Calculate the times interest earned and debt-to-equity ratio for both companies.
D. Which company is more solvent?
A. Calculate the current ratio and quick ratio for both companies.B. Which company is more liquid?
C. Calculate the times interest earned and debt-to-equity ratio for both companies.
D. Which company is more solvent?
Unlock Deck
Unlock for access to all 51 flashcards in this deck.
Unlock Deck
k this deck
33
Selected recent balance sheet and income statement information for Shepherd, Inc. follows:
A. Calculate accounts receivable turnover (ART) for 2016 and 2015. Has ART improved during the year or worsened?
B. Calculate inventory turnover (INVT) for 2016 and 2015. Has INVT improved during the year or worsened?
A. Calculate accounts receivable turnover (ART) for 2016 and 2015. Has ART improved during the year or worsened?B. Calculate inventory turnover (INVT) for 2016 and 2015. Has INVT improved during the year or worsened?
Unlock Deck
Unlock for access to all 51 flashcards in this deck.
Unlock Deck
k this deck
34
Selected recent balance sheet and income statement information for Holiday Corporation follows:
A Calculate accounts receivable turnover (ART) for 2016 and 2015. Has ART improved during the year or worsened?
B. Calculate inventory turnover (INVT) for 2016 and 2015. Has INVT improved during the year or worsened?
A Calculate accounts receivable turnover (ART) for 2016 and 2015. Has ART improved during the year or worsened?B. Calculate inventory turnover (INVT) for 2016 and 2015. Has INVT improved during the year or worsened?
Unlock Deck
Unlock for access to all 51 flashcards in this deck.
Unlock Deck
k this deck
35
Selected recent balance sheet and income statement information for Catnip, Inc. follows:
A. Calculate accounts receivable turnover (ART) for 2016 and 2015. Has ART improved during the year or worsened?
B. Calculate inventory turnover (INVT) for 2016 and 2015. Has INVT improved during the year or worsened?
A. Calculate accounts receivable turnover (ART) for 2016 and 2015. Has ART improved during the year or worsened?B. Calculate inventory turnover (INVT) for 2016 and 2015. Has INVT improved during the year or worsened?
Unlock Deck
Unlock for access to all 51 flashcards in this deck.
Unlock Deck
k this deck
36
Use the selected balance sheet and income statement information below for Brahtz, Inc. to compute the times interest earned ratio. Explain what information this ratio provides.
Unlock Deck
Unlock for access to all 51 flashcards in this deck.
Unlock Deck
k this deck
37
Use the selected balance sheet and income statement information below for Brahtz, Inc. to compute the current ratio. Explain what information this ratio provides.
Unlock Deck
Unlock for access to all 51 flashcards in this deck.
Unlock Deck
k this deck
38
Selected 2016 balance sheet and income statement information for two large communication companies, Vista Communication, Inc., and American Phone, Inc., follow:
A. Compute accounts receivable turnover for Vista Communications Inc. and American Phone.
B. Interpret and comment on the differences between the receivables turnover rates between each company assuming the industry average is 9.0 times.
A. Compute accounts receivable turnover for Vista Communications Inc. and American Phone.B. Interpret and comment on the differences between the receivables turnover rates between each company assuming the industry average is 9.0 times.
Unlock Deck
Unlock for access to all 51 flashcards in this deck.
Unlock Deck
k this deck
39
Selected 2016 balance sheet and income statement information for an office supply retailer, Office Supply, Inc., follows (in $ millions):
Compute accounts receivable turnover and inventory turnover for Office Supply, Inc.
Compute accounts receivable turnover and inventory turnover for Office Supply, Inc. Unlock Deck
Unlock for access to all 51 flashcards in this deck.
Unlock Deck
k this deck
40
Selected balance sheet and income statement information for Peter Gilgen & Co. for 2014 through 2016 follows (millions):
Compute the return on financial leverage for each year. Interpret these values for Peter Gilgen & Co.
Compute the return on financial leverage for each year. Interpret these values for Peter Gilgen & Co. Unlock Deck
Unlock for access to all 51 flashcards in this deck.
Unlock Deck
k this deck
41
Selected balance sheet and income statement information for jewelry retailer, Sparkle & Co. for 2014 through 2016 follows:
A. Compute the current ratio for each year and discuss any trends. Do you feel that the company is sufficiently liquid? Explain. What additional information might be helpful in analyzing the liquidity?
B. Compute times interest earned for each year and discuss any trends. Do you have any concerns about its level of financial leverage and its ability to meet interest obligations? Explain.
A. Compute the current ratio for each year and discuss any trends. Do you feel that the company is sufficiently liquid? Explain. What additional information might be helpful in analyzing the liquidity?B. Compute times interest earned for each year and discuss any trends. Do you have any concerns about its level of financial leverage and its ability to meet interest obligations? Explain.
Unlock Deck
Unlock for access to all 51 flashcards in this deck.
Unlock Deck
k this deck
42
Selected 2016 balance sheet and income statement information from Trunk, Inc. and Taylor S. follows:
A. Compute the following turnover rates for each company:
1. Accounts receivable turnover
2. Inventory turnover
3. Asset turnover
B. Interpret and comment on any differences you observe between the turnover rates for these two companies. What are some characteristics of their respective businesses that would likely lead to the differences identified?
A. Compute the following turnover rates for each company:1. Accounts receivable turnover
2. Inventory turnover
3. Asset turnover
B. Interpret and comment on any differences you observe between the turnover rates for these two companies. What are some characteristics of their respective businesses that would likely lead to the differences identified?
Unlock Deck
Unlock for access to all 51 flashcards in this deck.
Unlock Deck
k this deck
43
The balance sheets and income statements for Omni Communications follow:
A. Compute the company's current ratio for 2016 and 2015. Comment on any observed trend.
B. Compute the company's times interest earned and debt-to-equity ratio for 2016 and 2015. Comment on any observed trend.
C. Summarize your findings in a conclusion about the company's liquidity and solvency. Do you have any concerns about the company's ability to meet its debt obligations?
A. Compute the company's current ratio for 2016 and 2015. Comment on any observed trend.B. Compute the company's times interest earned and debt-to-equity ratio for 2016 and 2015. Comment on any observed trend.
C. Summarize your findings in a conclusion about the company's liquidity and solvency. Do you have any concerns about the company's ability to meet its debt obligations?
Unlock Deck
Unlock for access to all 51 flashcards in this deck.
Unlock Deck
k this deck
44
Selected balance sheet and income statement information for the office supply retailer, Office Supply, Inc., for FY 2014 through FY 2016 follows:
A. Compute the current ratio for each year and discuss any trends. Do you feel that the company is sufficiently liquid? Explain. What additional information might be helpful in analyzing the liquidity?
B. Compute times interest earned ratio for each year and discuss any trends. Do you have any concerns about its level of financial leverage and its ability to meet interest obligations? Explain.
A. Compute the current ratio for each year and discuss any trends. Do you feel that the company is sufficiently liquid? Explain. What additional information might be helpful in analyzing the liquidity?B. Compute times interest earned ratio for each year and discuss any trends. Do you have any concerns about its level of financial leverage and its ability to meet interest obligations? Explain.
Unlock Deck
Unlock for access to all 51 flashcards in this deck.
Unlock Deck
k this deck
45
The partial balance sheets and income statements for Peter Gilgen & Co. for fiscal years ending June 30, 2016 and 2015 follow:
A. Calculate accounts receivable turnover (ART) for 2016 and 2015. Accounts receivable in 2014 totaled $10,670 million. Has ART improved during the year or worsened?
B. Calculate inventory turnover (INVT) for 2016 and 2015. Inventories in 2014 were $12,768 million. Has INVT improved during the year or worsened?
C. Calculate asset turnover (AT) for 2016 and 2015 considering that 2014 total assets are $256,344 million. Has AT improved during the year or worsened?
A. Calculate accounts receivable turnover (ART) for 2016 and 2015. Accounts receivable in 2014 totaled $10,670 million. Has ART improved during the year or worsened?B. Calculate inventory turnover (INVT) for 2016 and 2015. Inventories in 2014 were $12,768 million. Has INVT improved during the year or worsened?
C. Calculate asset turnover (AT) for 2016 and 2015 considering that 2014 total assets are $256,344 million. Has AT improved during the year or worsened?
Unlock Deck
Unlock for access to all 51 flashcards in this deck.
Unlock Deck
k this deck
46
The income statements for Bullseye Corporation for fiscal years 2015, 2014, and 2013 (years ending January 30, 2016, January 31, 2015, and February 1, 2014, respectively) follow:
A. Prepare a common-size income statement for 2015 and 2014.
B. Comment on the most significant changes.
A. Prepare a common-size income statement for 2015 and 2014.B. Comment on the most significant changes.
Unlock Deck
Unlock for access to all 51 flashcards in this deck.
Unlock Deck
k this deck
47
The income statements for Bullseye Corporation for fiscal years 2015, 2014, and 2013 follow:
Prepare a pro-forma income statement for 2016 for Bullseye assuming the following:
A. Total revenues are $142,000 million.
B. Cost of sales is 68% of net sales.
C. Selling, general and administrative expenses increase by 10% from 2015. Credit card expense increases by 12%.
D. Depreciation increases by 5%
E. There is no gain on receivables held for sale.
F. Interest costs remain the same.
G. The effective income tax rate is 35%.
Prepare a pro-forma income statement for 2016 for Bullseye assuming the following:A. Total revenues are $142,000 million.
B. Cost of sales is 68% of net sales.
C. Selling, general and administrative expenses increase by 10% from 2015. Credit card expense increases by 12%.
D. Depreciation increases by 5%
E. There is no gain on receivables held for sale.
F. Interest costs remain the same.
G. The effective income tax rate is 35%.
Unlock Deck
Unlock for access to all 51 flashcards in this deck.
Unlock Deck
k this deck
48
The balance sheets for Bullseye Corporation for the fiscal years 2015 and 2014, (years ending January 30, 2016 and January 31, 2015, respectively) follow:
A. Prepare a common-size statements for the asset section of Bullseye's balance sheet for FY 2015 and FY 2014.
B. Comment on the most significant changes.
A. Prepare a common-size statements for the asset section of Bullseye's balance sheet for FY 2015 and FY 2014.B. Comment on the most significant changes.
Unlock Deck
Unlock for access to all 51 flashcards in this deck.
Unlock Deck
k this deck
49
Explain the trade-off between profit margin and asset turnover.
Unlock Deck
Unlock for access to all 51 flashcards in this deck.
Unlock Deck
k this deck
50
Discuss factors that limit the usefulness of financial accounting information for ratio analysis.
Unlock Deck
Unlock for access to all 51 flashcards in this deck.
Unlock Deck
k this deck
51
Ratio analysis is more complicated when a company is a conglomerate. Why?
Unlock Deck
Unlock for access to all 51 flashcards in this deck.
Unlock Deck
k this deck
Unlock Deck
Unlock for access to all 51 flashcards in this deck.


